cogeotiff / www.cogeo.org Goto Github PK
View Code? Open in Web Editor NEWCloud Optimized GeoTIFF website
Home Page: http://cogeo.org
License: Apache License 2.0
Cloud Optimized GeoTIFF website
Home Page: http://cogeo.org
License: Apache License 2.0


I am not sure this is the most appropriate place to ask this, so, please feel free to direct me elsewhere.
What is the recommended mime type for a cloud optimized geotiff? Additionally, is there an application / RFC in the works to register an "official" COG mime type with IANA? I am aware of image/tiff introduced by RFC 3302, however it seems desirable to distinguish between COGs and GeoTiffs / non-GeoTiffs.
Thanks in advance!
Range requests: How does a client know which ranges to request? Is a first request made to get the SRS + other metadata, then that SRS is used to convert coordinates to the byte range?
Caching: Are there any common mechanisms/techniques for caching wrt. the range requests? Does it even make sense? Is it wholly the responsibility of the client? Or are there some options for middleware?
Would be happy to create a PR for the 'in depth' page if appropriate (or anywhere else) :-)
There's a few more implementations that I know about that we should add in (and probably are more that I don't know about)
Also would be awesome if someone could test and confirm ESRI support.
See COG at foss4g-na section at https://medium.com/radiant-earth-insights/cloud-optimized-geotiff-advances-6b01750eb5ac for information on a great presentation on COG. It'd be great to include the presentation directly on the www.cogeo.org website.
The current version of the website is done by someone (me) with no web design experience - it's a clone of an existing template with a few tweaks.
There's now a nice logo and we got a nice palette, so it'd be great to update to those. Or anyone who is better at such things is more than welcome to take a real crack at improving the website design.
First let me say that Nodata/Mask is a complex topic. Internal nodata, bit mask in GeoTIFF are a GDAL specification (meaning introduced by GDAL devs) but are widely supported (e.g https://github.com/geotiffjs/geotiff.js/blob/ac1fe594455430ae9180f5108c0a2f32615d382f/src/globals.js#L107) and not present in the GeoTIFF nor TIFF specification (surprisingly cc @wildintellect).
When sharing data as COG if think it should be mandatory to have the nodata value/mask/alpha band set (at least when there is a ghost part in the data).
It would be really difficult to enforce this in the specification but I think the least we could do is to add a note on this web page telling that if possible a method describing the ghost/masked/undefined area must be used.
from https://github.com/mapbox/nodata

doc
@cholmes any though?
We now have https://twitter.com/cogeotiff
Would be good to have that info on the website, so people can follow.
Maybe one of those social media icon things that has twitter, github, and maybe slack?
QGIS 3.0 has much nicer COG support. It would be great to update http://www.cogeo.org/qgis-tutorial.html to be the 3.x support (and rename the current one to QGIS 2.x tutorial, and link to it)
http://www.cogeo.org/ redirects to https://www.cogeo.org/ which is a good thing. Unfortunately some external images are embedded via http. From those, the only the www.cbers.inpe.br one is not available via https. This makes browsers display warnings.
The site should not load any insecure external resources.
If you decide to work on this, please also see which of all the external links can be changed to https too. :)
Has anyone explored reading and visualizing COGs on Android? GeoTools depends on JDK packages which aren't available in Android SDK, and GDAL4Android seems like it would be a big hammer for small apps visualizing COGs online and/or offline.
If not, would a native Android implementation be useful to others?
Asking in reference to google/ground-android#1596. Thanks!
There's now a slack for COG's. We should add that to the site so people know about it.
Hi !
It's not really clear if COG are supported using widespread webmapping libraries (openlayers, leaflet, ...) or not. From what I could understand, it's perfectly feasible, but there's no implementation of COG layers (neither native, nor as extensions, and neither for ol nor for leaflet)
Following some links, I could find this : https://eox.at/2018/01/visualizing-geotiff-tiles-with-openlayers/ which initally looks like it, but then it seems it doesn't use HTTP GET range requests feature but still a pretiled geotiffs.
It's quite surprising as integrating with Openlayers or Leaflet is a very common scenario and looks like a perfect match for COG !
Cheers,
Olivier
The Providers page has a link to an Auth guide, but it doesn't appear to exist. Missing checkin?
Add https://pypi.org/project/rio-cogeo/ to the list of implementations, ideally with some instructions on how to use it.
There's now a new gdal driver dedicated to COG: https://gdal.org/drivers/raster/cog.html - we should guide users through using it, and go in depth on the various options and when you want to use them. Would be nice to have a dedicated 'tutorial' page for this.
I was told this repository might be a good starting point for this conversation. If there is a better place for this, let me know.
A project I'm working on is going to try serving tiles of data on the geostationary satellite projection through a Web Mapping Tile Service (WMTS) server. The data is written to COGs right now and I'm looking at various WMS/WMTS solutions for serving the data. I'd like to keep the door open to hosting this data on cloud storage at some point (stored locally at first) which is why it seems like COGs or zarr or TileDB would be a good storage format. The two main issues I'm having is servers (MapServer, GeoServer, NASA OnEarth, etc) that either require data to be converted to another format, documentation that doesn't cover really cover raster formats with a time dimension, or other documentation difficulties.
Does anyone have experience with COGs in a Web Mapping Tile Service setup? Are COGs as the main storage format a problem with these services since they usually have to convert to PNGs? Any guidance would be appreciated.
GDAL now has a dedicated COG driver - https://gdal.org/drivers/raster/cog.html would be good to update the developers guide to use it, as it's a bit simpler.
Please,
Consider to add to the cogeo.org website that the COG is now an OGC standard: https://www.ogc.org/press-release/cloud-optimized-geotiff-cog-published-as-official-ogc-standard/
It was done respecting carefully the community practices without adding or breaking any of the characteristics specified here.
Please see the standard here: https://docs.ogc.org/is/21-026/21-026.html
I hope we can both continue collaborating in promoting COG.
Thanks,
Just had good success on stacspec.org with https://realfavicongenerator.net/
Would be great to have one up for cogeo.org
There's a really nice explanation of COG's at https://medium.com/planet-stories/a-handy-introduction-to-cloud-optimized-geotiffs-1f2c9e716ec3
At the very least it'd be good to put a prominent link to it, as it's a great explanation. Ideally we'd even port a good bit of that info to the site itself, as it's a better explanation than anything on the site currently.
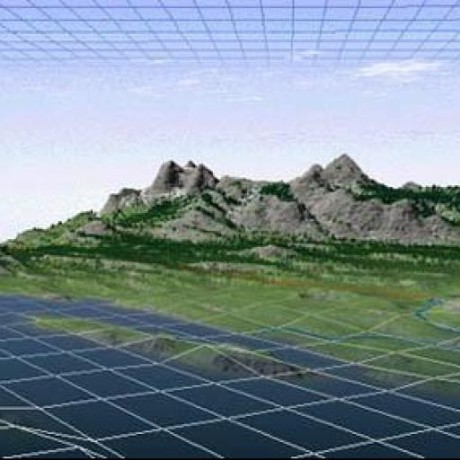
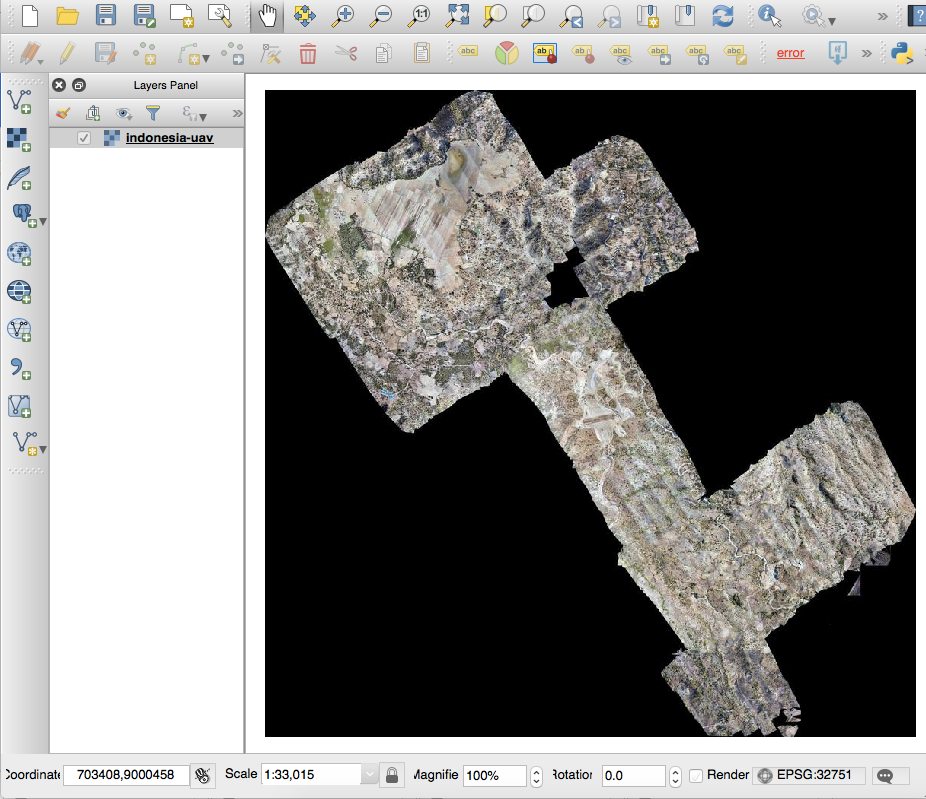
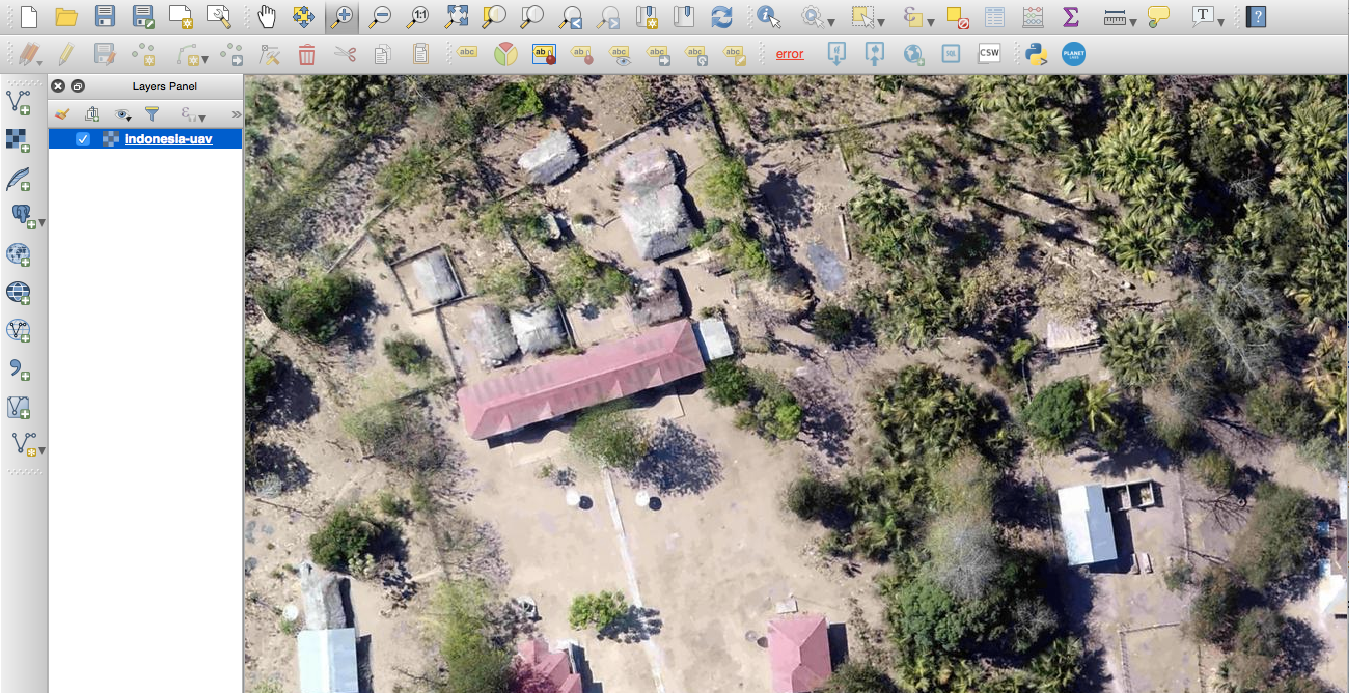
It's somewhat easy to handle transparency, but that depends on the remote data you're looking at. In your case, adding -srcnodata 0 to the gdalbuildvrt command tells gdal to consider pixels with 0 value (ie real black) as transparent, which gives the following here: https://i.imgur.com/Feca8ny.png.
The BG is red in my QGIS precisely for this, to see if data is transparent..
Of course, this has some drawbacks,cf https://i.imgur.com/4EamrFS.png:
Sadly, those shortcomings can only be fixed "at the source"..
I'm trying to take advantage of COG format to write a python script to download only the data inside of a state border for example "california.shp". The data I want to download is hosted on AWS as requester pays, so it's important that I only download exactly what I need.
I have gone several pages in on google, and despite all the pages saying how great COG is because of the range requests, I just can't find a single real example showing how to do this.
So, given a shapefile, and an aws data COG data source (for example, naip-imagery), how would you do this? It would be great to have example scripts on this website (or anywhere, really).
This is the code I have so far. (Along with some creative suggestions from ChatGPT that didn't work out, I'm assuming it has just as little information to feed into the model as I did when trying to figure it out...)
import boto3
import shapefile
from shapely.geometry import Polygon, Point

# Read in shapefile, which is in WGS84
california_border = Polygon(shapefile.Reader("california.shp")).shapes()[0].points)

# Connect to AWS
client = boto3.client(
    "s3",
    aws_access_key_id=<MY_ACCESS_KEY>,
    aws_secret_access_key=<MY_SECRET_ACCESS_KEY>,
    region_name="us-west-2"
)

# List objects in the "naip-analytic" dataset
objects = client.list_objects_v2(
    Bucket="naip-analytic",
    Prefix="ca/2020/60cm/rgbir_cog/32114", #One out of 6 folders available for California, this holds 43 .tif files
    MaxKeys=1000,
    RequestPayer="requester"
)

for obj in objects["Contents"]:
    print(obj["Key"])
    # Get object metadata
    metadata = client.head_object(
        Bucket="naip-analytic",
        Key=obj["Key"],
        RequestPayer="requester"
    )

    coords = metadata["Metadata"] #This doesn't actually hold any information (suggested by ChatGPT). Full output below

    #Everything below is non-working suggestions from ChatGPT, left in case they inspire any good ideas
    xmin = float(coords["s3:xmin"])
    ymin = float(coords["s3:ymin"])
    xmax = float(coords["s3:xmax"])
    ymax = float(coords["s3:ymax"])

    # Check if image intersects the California border
    if california_border.intersects(Polygon([(xmin, ymin), (xmax, ymin), (xmax, ymax), (xmin, ymax)])):
        # Calculate the overlap between the image and the California border
        overlap = california_border.intersection(Polygon([(xmin, ymin), (xmax, ymin), (xmax, ymax), (xmin, ymax)]))
        # Calculate the start and end bytes of the overlap
        start_x, start_y = overlap.exterior.coords[0]
        end_x, end_y = overlap.exterior.coords[2]
        start_byte = int((start_x - xmin) / (xmax - xmin) * obj["Size"]) #This was ChatGPT's guess. I am not sure if this is approrpiate
        end_byte = int((end_x - xmin) / (xmax - xmin) * obj["Size"])
        # Create a range request for the image
        url = f"https://naip-analytic.s3.amazonaws.com/{obj['Key']}?AWSAccessKeyId={client.meta.config.access_key}&Signature={client.meta.config.secret_key}&Expires={client.meta.config.signature_version}"
        headers = {
            "Range": f"bytes={start_byte}-{end_byte}"
        }
        print(url)
My metadata response from AWS looks like this:
{'ResponseMetadata': {'RequestId': 'BCZWDXWE7BJ1444B', 'HostId': 'BnfupuW09mBf8wBWNCYt2sLFLl78sY3niZ+TKZx6UkGZqCIFk3uNLCqPRG76I3qvAEWpkLLhR3s=', 'HTTPStatusCode': 200, 'HTTPHeaders': {'x-amz-id-2': 'BnfupuW09mBf8wBWNCYt2sLFLl78sY3niZ+TKZx6UkGZqCIFk3uNLCqPRG76I3qvAEWpkLLhR3s=', 'x-amz-request-id': 'BCZWDXWE7BJ1444B', 'date': 'Thu, 05 Jan 2023 17:23:55 GMT', 'x-amz-request-charged': 'requester', 'last-modified': 'Fri, 28 Jan 2022 16:31:34 GMT', 'etag': '"3357a147f64f23e7b8471760b7faf242-44"', 'accept-ranges': 'bytes', 'content-type': 'image/tiff', 'server': 'AmazonS3', 'content-length': '361935973'}, 'RetryAttempts': 0}, 'AcceptRanges': 'bytes', 'LastModified': datetime.datetime(2022, 1, 28, 16, 31, 34, tzinfo=tzutc()), 'ContentLength': 361935973, 'ETag': '"3357a147f64f23e7b8471760b7faf242-44"', 'ContentType': 'image/tiff', 'Metadata': {}, 'RequestCharged': 'requester'}
I'm hoping someone here is familiar enough with the format to point me in the right direction, it's disappointing that something so simple isn't described anywhere.
I'm not sure where to find:
Thanks! I really appreciate any help.
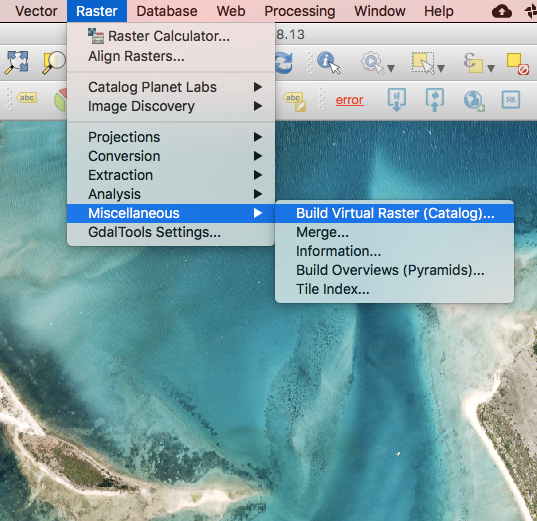
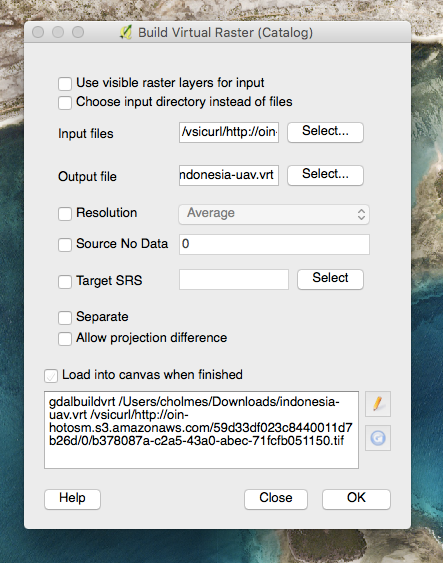
I've attempted several ways to get the "Build Virtual Raster" tool in QGIS to build a .vrt file using actual virtual files (https:...). It works fine with the same files if I previously download them, but I get the error "Incorrect parameter value for INPUT" when I try to access them on the web. I've tried accessing the files both with and without the /vsiurl/ prepend, and I ger the same error. The Python code below I copied from the tool dialog, then I edited it and ran it in the Python Console. Any guidance would be greatly appreciated!
processing.run("gdal:buildvirtualraster", {'INPUT':[' /vsicurl/https://prd-tnm.s3.amazonaws.com/StagedProducts/Elevation/1m/Projects/IN_Indiana_Statewide_LiDAR_2017_B17/TIFF/USGS_1M_16_x65y432_IN_Indiana_Statewide_LiDAR_2017_B17.tif',' /vsicurl/https://prd-tnm.s3.amazonaws.com/StagedProducts/Elevation/1m/Projects/IN_Indiana_Statewide_LiDAR_2017_B17/TIFF/USGS_1M_16_x64y436_IN_Indiana_Statewide_LiDAR_2017_B17.tif'],'RESOLUTION':0,'SEPARATE':False,'PROJ_DIFFERENCE':False,'ADD_ALPHA':False,'ASSIGN_CRS':None,'RESAMPLING':0,'SRC_NODATA':'','EXTRA':'','OUTPUT':'TEMPORARY_OUTPUT'})
Traceback (most recent call last):
File "C:\OSGeo4W\apps\Python39\lib\code.py", line 90, in runcode
exec(code, self.locals)
File "", line 1, in
File "C:\OSGeo4W/apps/qgis/./python/plugins\processing\tools\general.py", line 108, in run
return Processing.runAlgorithm(algOrName, parameters, onFinish, feedback, context)
File "C:\OSGeo4W/apps/qgis/./python/plugins\processing\core\Processing.py", line 181, in runAlgorithm
raise QgsProcessingException(msg)
_core.QgsProcessingException: Unable to execute algorithm
Incorrect parameter value for INPUT

It makes sense to me to put the logo on the main page in place of the broken NASA one then, IMO. The spec could get added there as well.
Originally posted by @coneypylon in #64 (comment)
We need to put up some logos on the website:


'I would suggest following the guidelines listed in Creative Commons Considerations for licensors and licensees. In particular, the following look relevant:
Specify precisely what it is you are licensing (i.e. your logo creations, the narrative content of the page)
Indicate rights not covered by the license (i.e. the logos of the commercial entities)
You may find HTML generated by the "Use this file on the web" links from Wikimedia Commons to be useful for specifying the license of individual images. As an example, here is the File:Logo square postgis.png entry:
'
The logos are made by Radiant and can be cc licensed.
A declarative, efficient, and flexible JavaScript library for building user interfaces.
🖖 Vue.js is a progressive, incrementally-adoptable JavaScript framework for building UI on the web.
TypeScript is a superset of JavaScript that compiles to clean JavaScript output.
An Open Source Machine Learning Framework for Everyone
The Web framework for perfectionists with deadlines.
A PHP framework for web artisans
Bring data to life with SVG, Canvas and HTML. 📊📈🎉
JavaScript (JS) is a lightweight interpreted programming language with first-class functions.
Some thing interesting about web. New door for the world.
A server is a program made to process requests and deliver data to clients.
Machine learning is a way of modeling and interpreting data that allows a piece of software to respond intelligently.
Some thing interesting about visualization, use data art
Some thing interesting about game, make everyone happy.
We are working to build community through open source technology. NB: members must have two-factor auth.
Open source projects and samples from Microsoft.
Google ❤️ Open Source for everyone.
Alibaba Open Source for everyone
Data-Driven Documents codes.
China tencent open source team.
