constantamateur / soupx Goto Github PK
View Code? Open in Web Editor NEWR package to quantify and remove cell free mRNAs from droplet based scRNA-seq data
R package to quantify and remove cell free mRNAs from droplet based scRNA-seq data


I get the following error when I try to create cleaned seurat object
Error in createCleanedSeurat(scl) :
no slot of name "calc.params" for this object of class "Seurat"
I introduced SoupX into my pipeline after finding that certain genes were ubiquitously differentially expressed between conditions across all cell types in my dataset and suspecting that this was due to ambient RNA. SoupX greatly improved the consistency of clustering across different resolutions after integrating the samples. However, I have noticed that many of the new DEGs appear to be spurious - for example, Plp1, a gene that is expressed specifically in oligodendrocytes, is now DE in microglia between conditions - expressed in 64% and 75.5% of microglia in the two conditions respectively!
Plp1, and the other spurious DEGs, are highly expressed in the soup and among those most adjusted by SoupX. I suspect that these DEGs are introduced due to inconsistencies in processing between samples - a larger fraction of the soup was (presumably) removed in some samples than others. Comparing my results with the literature, I believe that previously the DEGs were genuinely DE between conditions, but not necessarily DE in those specific cells, whereas now some of the DEGs are neither genuinely DE between conditions nor genuinely expressed in those cells.
I used the automated pipeline and the estimated global rho for each of my samples was 4-6%. Clearly this is an underestimate as there is a substantial amount of ambient RNA remaining and so I am looking into the manual estimation method. However, I'm not sure how to guarantee that all of the samples are adjusted to an equivalent degree. I could set the contamination fraction to be the same for every sample, but I'm not sure whether this would be better or worse as some samples may contain a higher proportion of ambient RNA than others.
I suspect that part of the issue may be that some empty drops contained a similar amount of RNA as some real cells and so were not correctly filtered out by CellRanger. I usually remove these after SoupX. Will removing these cells and then using DropletUtils:::write10xCounts to replace the files in the outs/filtered_feature_bc_matrix folder be sufficient to provide the correct inputs for SoupX?
I'm currently trying different processing methods to see how the output is affected, but in the meantime I would really like to know whether you have encountered the spurious differential expression problem before and if you have any advice on how to resolve it.
I have been using the estimateNonExpressingCells and calculateContaminationFraction to calculate the contamination fraction from nuclei by using mitochondrial genes. However, this occasionally gave very high contamination estimates. When the autoEstCont function was added, I began using that with the prior rho equal to the estimate from using mitochondrial genes. This seemed to solve the high estimate issue.
This was working well until I switched to using v1.4.5. Now, the autoEstCont function always lowers the estimated contamination, sometimes drastically. I would expect some samples to go up and some to go down after using the autoEstCont function. The reduction in the estimate also seems to scale linearly when adjusting the prior SD. Has anyone else had this issue?
Hi, thanks for the nice tool to correct ambient RNA expression!
I've been following the vignette, and everything has been going well up till the correction of the expression profile using adjustCounts, rho was estimated fine.
However upon running adjustCounts I get the following error message:
Warning message in tgt * ws <= bucketLims:
"longer object length is not a multiple of shorter object length"
Warning message in bucketLims/ws:
"longer object length is not a multiple of shorter object length"
Warning message in tgt * ws <= bucketLims:
"longer object length is not a multiple of shorter object length"
Warning message in bucketLims/ws:
"longer object length is not a multiple of shorter object length"
Warning message in tgt * ws <= bucketLims:
"longer object length is not a multiple of shorter object length"
Warning message in bucketLims/ws:
"longer object length is not a multiple of shorter object length"
Warning message in tgt * ws <= bucketLims:
"longer object length is not a multiple of shorter object length"
Warning message in bucketLims/ws:
"longer object length is not a multiple of shorter object length"
Warning message in tgt * ws <= bucketLims:
"longer object length is not a multiple of shorter object length"
Warning message in bucketLims/ws:
"longer object length is not a multiple of shorter object length"
Warning message in tgt * ws <= bucketLims:
"longer object length is not a multiple of shorter object length"
Warning message in bucketLims/ws:
"longer object length is not a multiple of shorter object length"
Warning message in tgt * ws <= bucketLims:
"longer object length is not a multiple of shorter object length"
Warning message in bucketLims/ws:
"longer object length is not a multiple of shorter object length"
Warning message in tgt * ws <= bucketLims:
"longer object length is not a multiple of shorter object length"
Warning message in bucketLims/ws:
"longer object length is not a multiple of shorter object length"
Warning message in tgt * ws <= bucketLims:
"longer object length is not a multiple of shorter object length"
Warning message in bucketLims/ws:
"longer object length is not a multiple of shorter object length"
Warning message in tgt * ws <= bucketLims:
"longer object length is not a multiple of shorter object length"
Warning message in bucketLims/ws:
"longer object length is not a multiple of shorter object length"
Warning message in tgt * ws <= bucketLims:
"longer object length is not a multiple of shorter object length"
Warning message in bucketLims/ws:
"longer object length is not a multiple of shorter object length"
Warning message in tgt * ws <= bucketLims:
"longer object length is not a multiple of shorter object length"
Warning message in bucketLims/ws:
"longer object length is not a multiple of shorter object length"
Warning message in tgt * ws <= bucketLims:
"longer object length is not a multiple of shorter object length"
Warning message in bucketLims/ws:
"longer object length is not a multiple of shorter object length"
Error: Matrices must have same dimensions in e1 - Matrix(e2)
Traceback:
- adjustCounts(sc)
- adjustCounts(tmp, clusters = FALSE, method = method, roundToInt = FALSE,
. verbose = verbose, tol = tol, pCut = pCut)- out - do.call(cbind, lapply(seq(ncol(out)), function(e) alloc(expSoupCnts[e],
. out[, e], soupFrac)))- out - do.call(cbind, lapply(seq(ncol(out)), function(e) alloc(expSoupCnts[e],
. out[, e], soupFrac)))- callGeneric(e1, Matrix(e2))
- eval(call, parent.frame())
- eval(call, parent.frame())
- e1 - Matrix(e2)
- e1 - Matrix(e2)
- dimCheck(e1, e2)
- stop(gettextf("Matrices must have same dimensions in %s", deparse(sys.call(sys.parent()))),
. call. = FALSE, domain = NA)
I don't know where the problem lies unfortunately... Any help troubleshooting would be appreciated.
I tried checking the structure of my CellSoup object (using str(cs)) and got the following output:
List of 6
$ toc : num [1:22390, 1:2951] 0 0 0 0 0 0 1 0 0 0 ...
..- attr(, "dimnames")=List of 2
.. ..$ : chr [1:22390] "Xkr4" "Gm1992" "Rp1" "Sox17" ...
.. ..$ : chr [1:2951] "EXT145_AAACCTGCACGGCGTT" "EXT145_AAACCTGCAGACGCAA" "EXT145_AAACCTGCATCGGAAG" "EXT145_AAACCTGTCATGGTCA" ...
$ metaData :'data.frame': 2951 obs. of 5 variables:
..$ nUMIs : num [1:2951] 4837 4906 13139 5049 5500 ...
..$ clusters: chr [1:2951] "Cortico" "Lacto" "EC2" "Lacto" ...
..$ UMAP_1 : num [1:2951] 8.93 1.68 10.17 3.26 0.7 ...
..$ UMAP_2 : num [1:2951] -8.53 1.15 3.89 -3.95 -2.23 ...
..$ rho : num [1:2951] 0.018 0.018 0.018 0.018 0.018 0.018 0.018 0.018 0.018 0.018 ...
$ nDropUMIs : Named num [1:737280] 7 0 1 1 1 1 15 1 1 43 ...
..- attr(, "names")= chr [1:737280] "AAACCTGAGAAACCAT-1" "AAACCTGAGAAACCGC-1" "AAACCTGAGAAACCTA-1" "AAACCTGAGAAACGAG-1" ...
$ soupProfile:'data.frame': 28692 obs. of 2 variables:
..$ est : num [1:28692] 1.47e-06 1.47e-06 0.00 0.00 0.00 ...
..$ counts: num [1:28692] 4 4 0 0 0 13 0 82 72 0 ...
$ DR : chr [1:2] "UMAP_1" "UMAP_2"
$ fit :List of 6
..$ dd :'data.frame': 1300 obs. of 14 variables:
.. ..$ gene : Factor w/ 100 levels "1810011O10Rik",..: 37 98 30 25 66 13 89 51 8 11 ...
.. ..$ passNonExp : logi [1:1300] TRUE TRUE TRUE TRUE TRUE TRUE ...
.. ..$ rhoEst : num [1:1300] 0 0 0.0435 0 0 ...
.. ..$ rhoIdx : int [1:1300] 1 1 8 1 1 1 7 1 8 1 ...
.. ..$ obsCnt : num [1:1300] 0 0 1 0 0 0 2 0 1 0 ...
.. ..$ expCnt : num [1:1300] 32.4 37.6 23 34.1 33.4 ...
.. ..$ isExpressedFDR: num [1:1300] 1.54e-11 2.57e-13 4.39e-07 3.97e-12 7.00e-12 ...
.. ..$ geneIdx : int [1:1300] 6 7 8 12 13 14 16 20 25 29 ...
.. ..$ tfidf : num [1:1300] 3.45 3.45 3.42 3.36 3.36 ...
.. ..$ soupIdx : int [1:1300] 1414 1211 2027 1345 1371 1982 557 1115 2075 1478 ...
.. ..$ soupExp : num [1:1300] 8.22e-05 9.54e-05 5.83e-05 8.66e-05 8.47e-05 ...
.. ..$ useEst : logi [1:1300] TRUE TRUE TRUE TRUE TRUE TRUE ...
.. ..$ rhoHigh : num [1:1300] 0.114 0.0982 0.2426 0.1082 0.1106 ...
.. ..$ rhoLow : num [1:1300] 0 0 0.0011 0 0 ...
..$ priorRho : num 0.05
..$ priorRhoStdDev: num 0.1
..$ posterior : num [1:1001] 0 5.96 7.25 8.05 8.64 ...
..$ rhoEst : num 0.018
..$ rhoFWHM : num [1:2] 0.01 0.043
- attr(*, "class")= chr [1:2] "list" "SoupChannel"
At first glance everything looks fine to me? Googling the error message didn't help me further..
Thanks!
Hello!
I've been trying to load my data into R, however because I received the cellranger output through a dropbox, I don't think the function can establish a connection to read the files. Could someone who has successfully loaded data through this function share with me their file names and what their output looked like for cellranger V3?
Here's my session info and errors:
dataDirs = c('E:/Casey/data/twentyfour_Month_Raw_Data/twenty_four_month_data/raw_data_matrix_included')
scl = load10X(dataDirs, keepDroplets = TRUE)
Loading data for 10X channel Channel1 from E:/Casey/data/twentyfour_Month_Raw_Data/twenty_four_month_data/raw_data_matrix_included
Error in open.connection(file) : cannot open the connection
In addition: Warning message:
In open.connection(file) :
cannot open file 'E:/Casey/data/twentyfour_Month_Raw_Data/twenty_four_month_data/raw_data_matrix_included/raw_feature_bc_matrix/matrix.mtx.gz': No such file or directory
R version 3.6.0 (2019-04-26)
Platform: x86_64-w64-mingw32/x64 (64-bit)
Running under: Windows 10 x64 (build 17134)
Thanks!
Hello,
Thank you for the package and the detailed vignette!
I followed the steps to estimate and correct for ambient RNA using a set of genes (manual estimation). I work with tumor samples (tumor cells + normal cells from the microenv).
I chose to use 3 sets of genes to manually estimate the contamination. These genes should be expressed exclusively in a subset of the cells:
HBgenes=c("HBB", "HBA2") #-> expressed in erythrocytes
NORgenes=c("PHOX2B") #-> a transcription factor involved in the development of noradrenergic neuron populations
ENDOgenes=c("ENG", "PTPRB") #->expressed in endothelial cells
Here's a look at the data before running SoupX, I just plot a tsne + the expression of my favourite genes (I used Seurat).

We can clearly see the contamination, especially with HBB which seems to be expressed within the PHOX2B+ population.
First of all, here's the output of plotMarkerMap to check the expression of contaminating genes:

I have two questions here:
Expression of PHOX2B seems to be slightly different from the background (light reddish colour) and only a few cells are outlined in green indicating a significant difference. Does this mean we are probably dealing with a strong PHOX2B contamination from the "soup"?
For ENG gene, log2Ratio is very high everywhere but only a few cells show statistically significant difference (outlined in green). I wonder how we should interpret the cells that don't cluster together (no green outline + distributed in the middle). They may be be doublets? This is perhaps beyond the scope of SoupX usage, but if you have any thoughts on this, I'd be glad to hear them!
Finally, here's the output of plotMarkerMap to show the cells on which the estimations are done:

and the reported contamination fraction:
Estimated global contamination fraction of 9.53%
After running SoupX, I carry on with the analysis using the corrected counts (dimensionally reduction, normalization, clustering..). The first thing I noticed is the presence of background expression of HBB gene away from, what seems to be, the true cluster of erythrocytes (cluster 4). So I am still suspecting the presence of contamination.


Many thanks in advance for the help!
Best,
Amira
I used the endothelial marker VWF to estimate the contamination fraction for a group of immune cells.
After running
sc <- calculateContaminationFraction(sc=sc, nonExpressedGeneList=nonExpGlist, useToEst = useToEst_clustering)
I got
Estimated global contamination fraction of 114.78%
How could that be possible? Why does the algorithm return a value more than 100% ?
Hi,
Thanks a lot for making this lovely package!
I am trying to run SoupX on a scRNAseq dataset and am getting the following error: Error in quantile.default(soupProf$est, soupQuantile) : missing values and NaN's not allowed if 'na.rm' is FALSE. Here is the approach I am using:
sc = SoupChannel(tod, toc)sc = setClusters(sc, setNames(HDCM_meta$seurat_clusters, HDCM_meta_cells))sc = autoEstCont(sc, soupQuantile=0.2)When I run autoEstCont I get the error Error in quantile.default(soupProf$est, soupQuantile) : missing values and NaN's not allowed if 'na.rm' is FALSE. After checking the sc object, the counts are all 0 and the est are all NaN. Would appreciate any help! It seems like in the vignette, you guys do not do subset the cells from the raw and filtered matrices?
Thanks!
Can you please tell me what are the possible bugs with my code?
plotMarkerDistribution(sc)


Error in estimateNonExpressingCells(sc, as.list(gns), ...): Invalid cluster specification.  clusters must be a named vector with all column names in the table of counts appearing.
Traceback:

1. plotMarkerDistribution(sc)
2. inferNonExpressedGenes(sc, ...)
3. estimateNonExpressingCells(sc, as.list(gns), ...)
4. stop("Invalid cluster specification.  clusters must be a named vector with all column names in the table of counts appearing.")
I am using gene x cell count matrices as input in the following way:
tod <- read.delim(
  "../0.Data/SoupX_input/V_1/raw_gene_bc_matrices/GRCh38/matrix.csv",
  row.names = 1, sep="\t")

toc <- read.delim(
  "../0.Data/SoupX_input/V_1/filtered_gene_bc_matrices/GRCh38/matrix.csv",
  row.names = 1, sep="\t", header=TRUE)

tod <- as.matrix(tod)
toc <- as.matrix(toc)

channel1 = SoupChannel(tod, toc, channelName="Channel1", keepDroplets = TRUE)

scl = SoupChannelList(list(channel1))
There are no errors or warnings, however in the scl object, the scl$soupMatrix matrix constains only NaN, whereas the scl$soupMatrix matrix of the demo has numbers.
As an alternative, I created a barcodes.tsv, genes.tsv, and matrix.mtx files, and loaded them using:
scl = load10X(dataDirs)
The files get loaded, however the soupMatrix object in scl is also full of NaN.
@constantAmateur do you have any insights on how to solve this?
Thank you
A
Hello, I am pretty new to this R world, but I am trying to clean up some data and found SoupX to be the solution. I am trying to follow the vignette provided with the package using my own data and as soon as I tried to run "sc = load10X(dataDirs)", I get the following error:
sc = load10X(dataDirs)
Loading raw count data
Error in full.data[[1]] : subscript out of bounds
Can someone help me figuring out the problem, please?
Thanks
Hi,
I run into following error while running strainCells.
Error in if (any(i < 0L)) { : missing value where TRUE/FALSE needed In addition: Warning message: In int2i(as.integer(i), n) : NAs introduced by coercion to integer range
I don't see any NAs introduced in the dataset and it runs fine with smaller datasets.
Can you help in troubleshooting this?
Thanks
shristi
Hi,
I have been using SoupX for my 10X data and it seems to be working great.
But I am having issues with SoupX when I try to load count matrix. I have one count matrix. How do I create subset of it to remove empty droplets?
Here are commands:
tod <- read.delim("Maligant50.csv", row.names = 1, sep=",")
toc <- read.delim("Maligant50.csv", row.names = 1, sep=",")

channel1 = SoupChannel(tod,toc,channelName="channel1")
spObj = SoupChannelList(list(channel1))
spObj$channels$channel1 = estimateSoup(spObj$channels$channel1)
I am getting following error:
spObj$channels$channel1 = estimateSoup(spObj$channels$channel1)
Error in base::rowSums(x, na.rm = na.rm, dims = dims, ...) :
  'x' must be an array of at least two dimensions
Am I doing anything wrong?
Many thanks,
Hello!
I'm trying to apply my data on SoupX but I kept getting this error and can not seem to solve it
Error in intI(j, n = x@Dim[2], dn[[2]], give.dn = FALSE) : 'NA' indices are not (yet?) supported for sparse Matrices
Can you please advise if i might have gone wrong anywhere?
sessionInfo()
R version 3.4.1 (2017-06-30)
Platform: x86_64-pc-linux-gnu (64-bit)
Running under: CentOS release 6.5 (Final)
Matrix products: default
BLAS: /mnt/software/stow/R-3.4.1/lib64/R/lib/libRblas.so
LAPACK: /mnt/software/stow/R-3.4.1/lib64/R/lib/libRlapack.so
locale:
[1] LC_CTYPE=en_US.UTF-8 LC_NUMERIC=C
[3] LC_TIME=en_US.UTF-8 LC_COLLATE=en_US.UTF-8
[5] LC_MONETARY=en_US.UTF-8 LC_MESSAGES=en_US.UTF-8
[7] LC_PAPER=en_US.UTF-8 LC_NAME=C
[9] LC_ADDRESS=C LC_TELEPHONE=C
[11] LC_MEASUREMENT=en_US.UTF-8 LC_IDENTIFICATION=C
attached base packages:
[1] stats graphics grDevices utils datasets methods base
other attached packages:
[1] SoupX_0.3.0 devtools_1.13.5 Seurat_2.3.0 Matrix_1.2-14
[5] cowplot_0.9.2 ggplot2_3.0.0
Thanks!
In my project, genes that are highly specific to just one population of cells (Immune, luminal, fibroblast, endothelial) are not known at all.
Thus, I made plot with top 60 candidates of soup specific genes by using "plotMarkerDistribution" described in detailed vignette.
However, it is hard to see bimodal graph expect TGM4 (located middle in top 20 candidates).
which gene could be the soup specific genes with no biomodal graph in this case?
In detailed vignette, all immunoglobulin genes are used since IGCK and IGLC2 were chosen from the plot. However, that is not the case in my data. How can I make the list with TGM4 with no biological information? should I use TGM4 only as the soup specific gene?
I attached my plot for better understanding.
top1-20

top21-40

top 41-60

Thanks,
Hi, thanks for this great tool.
I'm testing various tools dedicated to scRNAseq data and I was wondering if you have any idea of the impact of soupX on the performance of doublet detection tools.
Thank you in advance.
JonathanCruard
Hi!
I am running a pipeline in a Jupyter notebook, and I would like to use SoupX inside a R cell. However, each time I run a cell with library(SoupX), the kernel dies.
My installation script is as follows:
conda create -n myenv python==3.7.*
conda activate myenv

conda install pip
conda install -c conda-forge r-base==3.6.2

conda install nb_conda # install jupyter by default
pip install jupyter_contrib_nbextensions

pip install scanpy
pip install leidenalg
pip install OpenTSNE
pip install rpy2
pip install anndata2ri

conda install pandas==0.25.*

conda install -c conda-forge r-curl==4.3
conda install -c conda-forge r-matrix.utils
conda install -c conda-forge r-sf  # installs hdf5 also
Once in R:
install.packages('usethis')
install.packages('covr')
install.packages('httr')
install.packages('rversions')
install.packages('devtools')

if (!requireNamespace("BiocManager", quietly = TRUE))
    install.packages("BiocManager")

BiocManager::install("multtest")

devtools::install_github('constantAmateur/SoupX',ref='devel')
I use anaconda R to run it in jupyter and I am almost sure that there must be some library or package that breaks the kernel when loading the library, because when running R in the console the package loads correctly.
I know the issue is quite odd for the types of issues that should be received here, but I post it so that you know about it. I will post it in https://github.com/ipython/ipython/issues, so that they can try to solve it.
Thanks!
Hi,
Thank's for making the package.
Is it possible to add a batch parameter?
Thank you
I keep getting the error:
Error in inferNonExpressedGenes(scl) :
could not find function "inferNonExpressedGenes"
But when I pull up the help document, using "?inferNonExpressedGenes" it shows the document.
I tried the function in R version 3.5.1 and R version 3.6.1. I'm not sure what is going on.
Can you please tell me how shall I derive the MLE of \rho_c in 6.2.2 formula (5) of the manuscript?
Really appreciate for your help.
Hi,
Thanks for developing such a neat program.
For the latest version, you removed the function "SoupChannelList", so how should I load the count expression matrix instead of 10X data from cellranger? Thanks.
Hi @constantAmateur: I am having troubling loading my dataset with load10x for the top level cellranger output.
(1) I can do SoupChannel with tod and toc. But the next step is estimateSoup or setSoupProfile, right? After which I have to add the metadata, such as the clustering, correct?
(2) When loading tod and toc using Seurat::Read10X, what is the purpose of saying "GRCh38"? (on the vignette).
(3) For setclusters to work if I can't upload the cellranger outs folder, I have to put my own clustering info. Is that clustering done on the raw_feature_bc_matrix, for example, using Seurat? Or does it have to be done on both raw and filtered bc matrix?
Thanks a lot for your response, and any additional information that you think will help me. For my dataset, I want to get to a point where I can use autoEstCont.
Hi, I'm trying to use SoupX and do the quickstart.
First I have the 10X data, both raw and filtered matrix.
The "load10X()" function is worked, but when I run "autoEstCont()" it told me I should run clustering first.
So I run
sc = setClusters(sc,[email protected])
Then do
sc = autoEstCont(sc)
But this time I got the error message about "Error in dimnames(x) <- dn: The length of 'dimnames' [1] must be equal to the array range"
How can I fix this problem?
I have used SoupX successfully in the past on 10X v2 libraries, which have far fewer possible barcodes than the v3 chemistry. Calculating cell specific estimates takes a few minutes on my laptop on v2 libraries, but many hours on v3 chemistry and ultimately exhausts available vector memory. Is this a known issue with the current version? Adjusting counts also seems to hang.
I also experienced performance problems on a fresh install of R/Rstudio/SoupX on a new iMac.
Perhaps there is some dependency that is not configured properly on my machines for parallelization?
Hi,
I would like to use SoupX for my dropseq data. Is it possible to just plug the dgTMatrix to estimate Soup?
Best,
Yolanda
Hi,
I think I don't fully understand what Estimated global contamination fraction represents ¿the average conatmination fraction per droplet?
How would cluster information more accurately get rid of contamination ?
Thanks,
Jaime.
Dear Dr. Matthew Young,
It is nice to try to reduce the ambient mRNA in scRNA-seq analysis. I tried to read my 10xgenomics scRNAseq data as below, but encountered an error as below, could you please help to check and give me some tips? Is that because of I loading the folder of aggregated samples by using Cellranger -aggr? Thank you so much.
#===#
dataDirs=c("/scRNAseq/BeforeForceCell/Mixtured/outs")
scl = load10X(dataDirs)
Loading data for 10X channel Channel1 from /scRNAseq/BeforeForceCell/Mixtured/outs
Error in intI(j, n = x@Dim[2], dn[[2]], give.dn = FALSE) :
'NA' indices are not (yet?) supported for sparse Matrices
#===#
Best,
Qi
Hi,
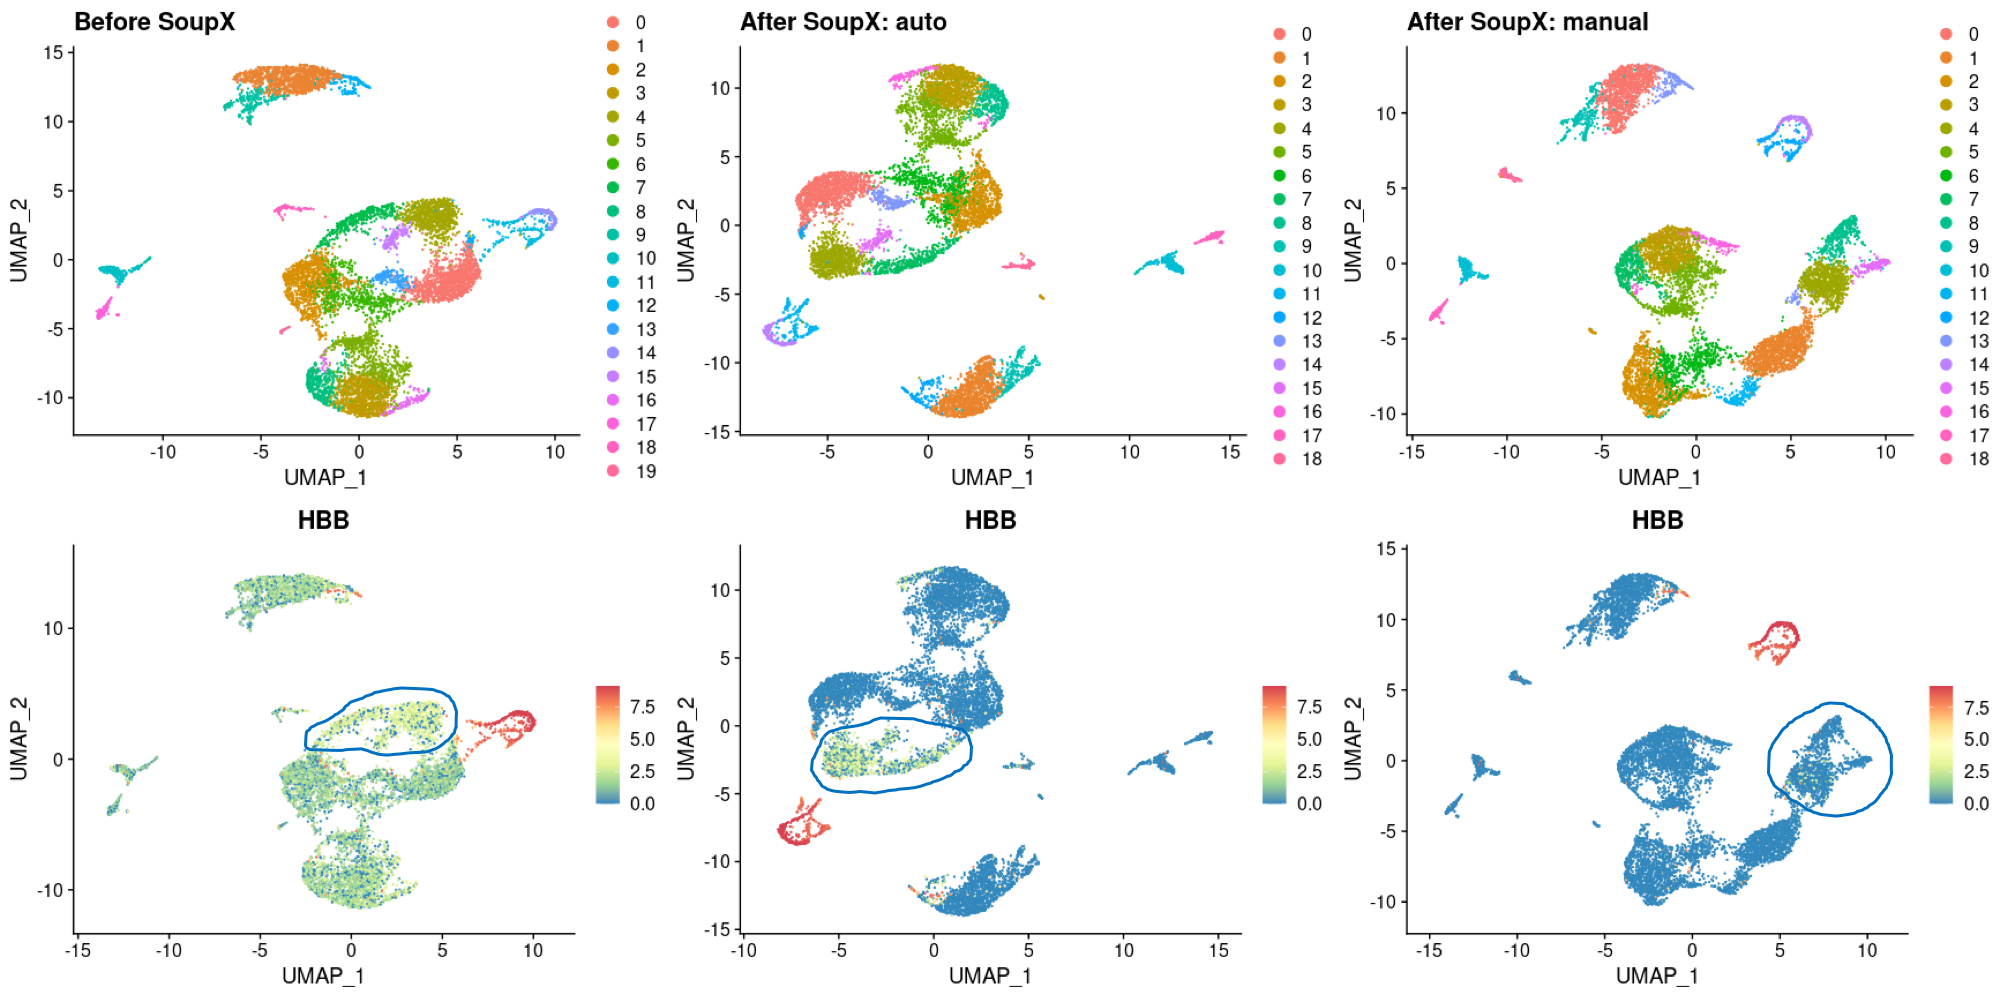
Thank you for the wonderful program. I would like some opinion on the analysis I performed on my dataset.
My dataset is from PBMCs sequenced using the 10X 5'-GEX kit. I can see that there are very obvious background contamination from RBCs, so I tried to remove them.
If you see the attached image, you can see I tried 2 different parameters. For the auto, I used the default, automated SoupX setting while for manual, I manually specify the list of RBC genes only as possible source of background.
After correction, background RBC signal was reduced but to different efficiency. With manual correction, all background signals in all cell clusters except RBC were removed, but with auto, I still see some signal in 1 specific island.
So my questions are:
Hope to hear back from you soon. Thank you very much.
Hi there,
Thanks for developing SoupX, and it has been a pleasure to try it out so far! Could you allow the users to specify ggplot arguments in the self-defined functions, such as point size, alpha, etc? This would be super helpful!
Hi,
I just download the latest version of the SoupX and try to follow the tutorial:
https://cdn.rawgit.com/constantAmateur/SoupX/master/doc/pbmcTutorial.html
I found the function/format in the v1.2.2 didn't match the tutorial, I'm wondering whether the tutorial can be updated to the current version?
Thanks
I-Hao
Thank you for the great tool! I have several questions:
If I decide to setContaminationFraction manually, do I still need to pull the raw_feature_bc_matrix?
If I decide to only plotMarkerDistribution for each sample but not correct the data, does it matter if I use filtered_feature_bc_matrix directly from 10X or it will change the result if load a processed matrix? I have filtered, merged several channels, removed doublets, and attach sample names with the barcode. I wonder will the SoupX need two matrices with matching barcode to recognize each other?
Thanks!
Hello,
I am trying to use the PlotMarkerDistrbution function to infer the non-expressedgene list . However, i keep getting an error regarding indexing. I believe the error is popping up because i am switching out the toc matrix in the SoupChannel with the filtered Seurat count matrix. This filtered matrix has less number of genes than the raw count matrix.
Now i tried only filtering out the cellids in the Cellranger filtered matrix that are not used in seurat object to keep the same gene counts as in the ambient profile or soup. But then the resulting graphs from the plotmarkemap changes drastically.
Can i possibly reduce the raw gene matrix gene numbers to the same as the one in the seurat object, or is that biasing the analysis?
Thanks,
Devika
First, thank you for making SoupX -- the method is elegant, and it seems to work very nicely!
I couldn't get strainChannel to work until I made this little fix to make sure that toc was actually defined inside the function:
diff --git a/R/strainChannel.R b/R/strainChannel.R
index 82a4a09..d4f36d3 100644
--- a/R/strainChannel.R
+++ b/R/strainChannel.R
@@ -20,6 +20,7 @@ strainChannel = function(tod,cellIdxs,nonExpressedGeneList,soupRange=c(0,10),...
   trueCellExpression = strainCells(tod[,cellIdxs],cellRhos,soupProfile)
   #And also calculate the ratio of the observed counts to the soup.  Kept un-logged so it remains sparse
   #We should really convert a bunch of 0s to NaNs, but don't do this to save space.
+  toc <- tod[, cellIdxs]
   expressionRatio = t(t(toc)/colSums(toc))
   expressionRatio@x = expressionRatio@x/soupProfile[expressionRatio@i+1,'est']
   #Now return everything that we've calculated
Hey Matthew,
thanks for the great package. I'm looking for a simple and safe way to implement SoupX package as part of a standard single cell analysis pipeline. Steps would be:
This means all steps have to be automated, and it has to be reasonably fast. Therefore, I would like a rough (under)estimate of the contamination fraction without biological assumptions and manual tweaking. I largely read the vignette and the manuscript, and I understand your points on manual inspection and gene selection. That being said, I need automation. As you are much more experienced in this topic, I would appreciate your opinion:
Cell Ranger does clustering and differential gene expression analysis (if selected). Would it be possible to use these genes [Cell Ranger output folder]/analysis/diffexp/graphclust/differential_expression.csv and clusters [Cell Ranger output folder]/analysis/clustering/graphclust/clusters.csv to reliably estimating the contamination fraction? If so, what would be your approach?
Additionally, could the total read counts in empty droplets VS. the total read counts in cell containing droplets be used to estimate contamination? (This is probably discussed, and I overlooked it)
Alternatively, would simply adding ERCC spike-ins to the single cell suspension (right before loading it to the 10X controller) be a quick experimental fix? This would generate a set of genes that should be expressed in none of the cells.
On another note, I found that sc$isV3 checking the 10x kit version. As now all experiments run on v3+. What is the difference in processing these? v3 seems to use some information from the Soup to call cells.
Apologies for questions stemming from my ignorance & thanks for reading.
Hi,
Thank you for writing this software. My analysis pipeline requires removal of cells with high contamination, so I use the option cellSpecificEstimates = T
I updated to R version 4.0.1 and reinstalled SoupX using install.packages('SoupX'), which does not include the option. So then I tried devtools::install_github("constantAmateur/SoupX",ref='STAN'), but this results in an error:
Downloading GitHub repo constantAmateur/SoupX@STAN
Skipping 2 packages not available: ggplot2, Seurat
   checking DESCRIPTION meta-information ...m/5fkddq9119v31_40dqj5pf2m0000gn/T/RtmpS3cUlW/remotes2b0e89d3ad0/constantAmateur-SoupX-a01ddb0/DESCRIPTION’ ...
* installing *source* package ‘SoupX’ ...
** using staged installation
** R
** data
*** moving datasets to lazyload DB
** inst
** byte-compile and prepare package for lazy loading
sh: line 1: 11153 Killed: 9               R_TESTS= '/Library/Frameworks/R.framework/Resources/bin/R' --no-save --no-restore --no-echo 2>&1 < '/var/folders/lm/5fkddq9119v31_40dqj5pf2m0000gn/T//Rtmp6TouEu/file2b877e5ca7e5'
ERROR: lazy loading failed for package ‘SoupX’
* removing ‘/Library/Frameworks/R.framework/Versions/4.0/Resources/library/SoupX’
* restoring previous ‘/Library/Frameworks/R.framework/Versions/4.0/Resources/library/SoupX’
Error: Failed to install 'SoupX' from GitHub:
  (converted from warning) installation of package ‘/var/folders/lm/5fkddq9119v31_40dqj5pf2m0000gn/T//RtmpS3cUlW/file2b0e66598fff/SoupX_1.4.5.tar.gz’ had non-zero exit status
This is on macOS Catalina with R version 4.0.1, I got the error in RStudio as well as R.
Firstly wanted to say thank you for creating such an excellent package, and a great paper - very intuitive principles using the empty droplets to build a profile of ambient RNA expression!
My question is around what to do when the estimation genes are present in every cell in certain samples. In my case, I am working with gut tissue, and using IG genes to assess contamination. In some gut samples, I keep getting the message from SoupX that there are no non-expressing cells. This is biologically not possible because I have all cell types in my samples (even T-cells haha) unless of course contamination is involved. The below command produces this notification:
estimateNonExpressingCells(sc, nonExpressedGeneList = list(IG = igGenes))
This is upon providing the standard 10X cellranger clustering, and the suggestion from the SoupX package is to set cluster = FALSE. However in other gut samples, the provided 10X cellranger clusters works well. My choice to move forward seems to be either:
i. set an artificially high contamination rate for all samples (say 0.1 as per your vignette)
ii. set cluster = FALSE in all samples, treating each cell as its own cluster (In samples where providing 10X clustering works, i find that setting cluster = FALSE doubles the estimated contamination fraction - but this is actually still well below the 0.1 in option i.)
iii. set artificially high contamination rate for samples (0.1) where I bump in to the 'no non-expressing cell ' problem but provide standard 10x cell ranger clustering info for samples where this is not an issue
iv. set cluster = FALSE instead of setting an artificially high contamination rate for samples where I bump into the the 'no non-expressing cell ' problem, but provide standard 10x cell ranger clustering info for samples where this is not an issue
I am hesitant to pursue options iii. and iv. as these introduce artificial effects on a particular subset of samples by treating these subsets differently (please correct me if I am wrong here). I think part of it is because I believe these 'highly contaminated samples' are inflamed gut tissue, so I think there is a biological reason behind this seperation! So, I would rather treat all samples homogeneously. Do you think this is correct?
The second and more important question then becomes: which is the safer option, to go towards: option i. or ii., especially in knowledge that I need to do differential expression downstream.
Your comment in "#32", suggests you might prefer an artificially high threshold, but I suppose my question to you is, in this setting outlined above would you still pick an artificially high threshold over, setting cluster = FALSE and treating each cell like its own cluster?
Also, in both i. and ii. is it ok to pass clustering information at the adjustCounts step despite not having given clusters for the preceding estimateNonExpressingCells step?
Thank you ever so much again!
Hi Mathew,
I just starting using your method and I was wondering if it is possible to upload custom counts matrixes. I am using 10X samples but for some benchmarks instead of using cellranger output I have my own matrixes. Is it possible? Thanks.
Nice work
E
Hello,
Just wanted to let you know that one of the dependencies of the updated package is outdated. I haven't tried running on an old form of R yet, but I'll let you know if it works. In case you see this before I do try and run this again, what version of R are you running for SoupX?
Thanks,
Casey
Hello,
Do you have any advice for usage with alevin output? Thank you
Hello!
With the new update of SoupX, I noticed that since the soup channel objects get data directly from the cell_ranger_output, if you create a Seurat object to get cell embeddings that has a filtering step like in the standard Seurat pipeline, you get an error when trying to run plotMarkerMap() with useToEst because the sc object and Seurat_DR will have different cell counts. This can be fixed by removing filtering steps in the Seurat pipeline, however that leaves in low quality cells that I'm unaware if they will impact the global contamination.
Thanks!
Casey
Hello!
From you paper you mention that there's a way to integrate SoupX's result with Seurat and Scanpy.
I noticed that there is a function (createCleanedSeurat.R) for Seurat. is there such function for Scanpy?
Thanks!
Hi,
I am using SoupX to decontaminate a dataset of pancreatic cell in which acinar enzymes are contaminating non acinar cells. I have used soup specific genes to determine the fratuion of contamination and correcting the expression profile as follows:
WT_36Dir<- c("/local/ljmartinezv/sc_pancreas_M_Serrano/Final_analysis/WT/AL4936/")
WT_36_CellID <- read.table('WT_36_CELLS', header = FALSE, sep= '\t')
WT_36 <- load10X(dataDir = WT_36Dir, cellIDs = WT_36_CellID$V1, keepDroplets = TRUE)
WT_36 <- estimateSoup(WT_36)
Soup_genes_36 <- head(WT_36$soupProfile[order(WT_36$soupProfile$est, decreasing = TRUE), ], n = 50)
Soup_genes_36 <- rownames(Soup_genes_36)
useToEst_36 = estimateNonExpressingCells(WT_36, nonExpressedGeneList = list(Soup_genes_36))
WT_36 <- calculateContaminationFraction(WT_36, list(Soup_genes_36), useToEst = useToEst_36)
WT_36_decont <- adjustCounts(WT_36)
DropletUtils:::write10xCounts("./WT_36Counts", WT_36_decont)
Does that looks fine to you ?
Thanks in advance,
Jaime.
Hi,
Thank you for this nice package!
The tutorial gives an example using IG genes as nonExpressedGeneList. I wonder what SoupX would do if two or more gene sets are feed into nonExpressedGeneList?
Say cell 1 is a red blood cell, and cell 2 is a B cell. If we use nonExpressedGeneList = list(HB = c("HBB", "HBA2"), IG = c("IGKC")), and would SoupX use IG genes to estimate cell 1 while HB genes for cell 2? If true, could we go further and say that it would be more accurate if more (accurate) gene sets are given?
I am new to single-cell RNA-seq. Sorry if my question are too naive.
Many thanks!
Yiwei Niu
Hi,
I need to clean my scRNA seq data.
I tried following the soupx vignette.
But not able to estimate and adjust counts in soupx after loading10X files (both raw and filtered).
It gives the following error:
"Error in autoEstCont(sc) :
Clustering information must be supplied, run setClusters first."
I will appreciate your help.
Thanks in advance.
In the tutorial(https://cdn.rawgit.com/constantAmateur/SoupX/master/doc/pbmcTutorial.html),
estimateSoup is called explicitly after constructing the SoupChannel.
sc = load10X(dataDirs, keepDroplets = TRUE)
sc = estimateSoup(sc)
but estimateSoup is actually called automatically in the following position
Line 35 in d7c58f7
Why should we call it explicitly again?
Neat program you've developed here!
I would like to work form my downsampled data generated with cellranger aggr across several libraries. However, when I used the load10X() function everything is imported as one "Channel". The info is preserved in the barcode endings "-1"...."-10", but the cells are not being imported based on their respective channel/library.
Hello,
Thanks for creating the SoupX, it seems like a nice package for accounting for the background noise in 10X data.
I have a small question though. I have two single cell samples of a tissue from healthy and diseased patient, and I know a bunch of cell-type specific genes that contaminate the "soup". I could successfully remove them with your algorithm.
However, I also see in each sample a number of general contaminants (like lncRNAs and splicing regualators, most of them are also highly expressed), that are sample-specific. I assume that they are contaminants, as I see them in the "empty droplets". When I look for DE genes between the samples, I of course find those contaminants in the top of the lists for all the clusters, but as I said, I assume they are just artifacts.
I haven't fully understood how to deal with those general contaminant genes that are present in all cell types in the SoupX. Do I just run calculateContaminationFraction() on the list of these genes on all the cells I have? I tried that, but it didn't seem to do much. Or is there a different way to handle this?
Thanks in advance!
When running calculateContaminationFraction as follows:
scveh <- calculateContaminationFraction(scveh, nonExpressedGeneList = genelist, cellSpecificEstimates = TRUE, useToEst = usetoestveh)
I get the following error message:
Error in compileCode(f, code, language = language, verbose = verbose) :
Compilation ERROR, function(s)/method(s) not created! g++: error: unrecognized command line option ‘-std=gnu++14’
make: *** [file1467411a2bdf9.o] Error 1
In addition: Warning message:
In system(cmd, intern = !verbose) :
running command '/scg/apps/software/r/3.6/lib64/R/bin/R CMD SHLIB file1467411a2bdf9.cpp 2> file1467411a2bdf9.cpp.err.txt' had status 1
Error in sink(type = "output") : invalid connection
This is being run in RStudio 3.6 with everything updated fully. Has anyone else had this issue and found a workaround? When I run the command without cellSpecificEstimates it works fine.
Thanks,
Ryan
Hi SoupX team!
I would like to use SoupX on plate-based scRNAseq where we included empty wells (so that we can use them similar to empty droplets). I guess there is no reason to assume that the model would not work on this type of data?
Attempting this, I called the SoupChannelList constructor directly with my data (as the 10x input handling function is not appropriate here) and I got an error in inferNonExpressedGenes().
rm(list=ls())
library(Matrix)
library(Seurat)
library(SoupX)
dir_in <- my path
dir_our <- my path
cnts <- t(readMM(paste0(dir_in, "counts_adata_proc.mtx")))
obs <- read.csv(paste0(dir_in, "obs_adata_proc.csv"), as.is = TRUE)
chips <- unique(obs$chip_id) # The plates.
iscell <- Matrix::colSums(cnts) >= 5000 # Cut off for empty wells (this is higher than in 10x data).
scl <- SoupChannelList(
       channels=lapply(chips[1:2], function(chip){
       SoupChannel(tod = as.matrix(cnts[,obs$chip_id==chip]),
                 toc = as.matrix(cnts[,obs$chip_id==chip & iscell]),
                 channelName = chip,
                 soupRange = c(0,5000), # Cut off for empty wells (this is higher than in 10x data).
                 keepDroplets = TRUE)
   }))
scl <- inferNonExpressedGenes(scl)
Inferring non-expressed genes for channel chip1
Error in split.default(rat@x, rownames(rat)[rat@i + 1]) :
group length is 0 but data length > 0
Do you have any intuition as to why this could happen? I cannot share the data unfortunately.
Session info for this example:
sessionInfo()
R version 3.5.0 (2018-04-23)
Platform: x86_64-apple-darwin17.5.0 (64-bit)
Running under: macOS High Sierra 10.13.4
Matrix products: default
BLAS: /System/Library/Frameworks/Accelerate.framework/Versions/A/Frameworks/vecLib.framework/Versions/A/libBLAS.dylib
LAPACK: /System/Library/Frameworks/Accelerate.framework/Versions/A/Frameworks/vecLib.framework/Versions/A/libLAPACK.dylib
locale:
[1] en_US.UTF-8/en_US.UTF-8/en_US.UTF-8/C/en_US.UTF-8/en_US.UTF-8
attached base packages:
[1] stats graphics grDevices utils datasets methods base
other attached packages:
[1] SoupX_0.2.3 Seurat_2.3.2 cowplot_0.9.2 ggplot2_2.2.1 Matrix_1.2-14
loaded via a namespace (and not attached):
[1] diffusionMap_1.1-0 Rtsne_0.13 VGAM_1.0-5 colorspace_1.3-2 ggridges_0.5.0
[6] class_7.3-14 modeltools_0.2-21 mclust_5.4 htmlTable_1.11.2 base64enc_0.1-3
[11] proxy_0.4-22 rstudioapi_0.7 DRR_0.0.3 bit64_0.9-7 flexmix_2.3-14
[16] prodlim_2018.04.18 mvtnorm_1.0-8 lubridate_1.7.4 ranger_0.10.1 codetools_0.2-15
[21] splines_3.5.0 R.methodsS3_1.7.1 mnormt_1.5-5 robustbase_0.93-0 knitr_1.20
[26] tclust_1.4-1 RcppRoll_0.3.0 jsonlite_1.5 Formula_1.2-3 caret_6.0-80
[31] ica_1.0-2 broom_0.4.4 ddalpha_1.3.3 cluster_2.0.7-1 kernlab_0.9-26
[36] png_0.1-7 R.oo_1.22.0 sfsmisc_1.1-2 compiler_3.5.0 backports_1.1.2
[41] assertthat_0.2.0 lazyeval_0.2.1 lars_1.2 acepack_1.4.1 htmltools_0.3.6
[46] tools_3.5.0 bindrcpp_0.2.2 igraph_1.2.1 gtable_0.2.0 glue_1.2.0
[51] RANN_2.5.1 reshape2_1.4.3 dplyr_0.7.4 Rcpp_0.12.16 trimcluster_0.1-2
[56] gdata_2.18.0 ape_5.1 nlme_3.1-137 iterators_1.0.9 fpc_2.1-11
[61] lmtest_0.9-36 psych_1.8.4 timeDate_3043.102 gower_0.1.2 stringr_1.3.1
[66] irlba_2.3.2 gtools_3.5.0 DEoptimR_1.0-8 zoo_1.8-1 MASS_7.3-50
[71] scales_0.5.0 ipred_0.9-6 doSNOW_1.0.16 parallel_3.5.0 RColorBrewer_1.1-2
[76] yaml_2.1.19 reticulate_1.8 pbapply_1.3-4 gridExtra_2.3 segmented_0.5-3.0
[81] rpart_4.1-13 latticeExtra_0.6-28 stringi_1.2.2 foreach_1.4.4 checkmate_1.8.5
[86] caTools_1.17.1 lava_1.6.1 geometry_0.3-6 dtw_1.20-1 SDMTools_1.1-221
[91] rlang_0.2.0 pkgconfig_2.0.1 prabclus_2.2-6 bitops_1.0-6 lattice_0.20-35
[96] ROCR_1.0-7 purrr_0.2.4 bindr_0.1.1 recipes_0.1.2 htmlwidgets_1.2
[101] bit_1.1-13 tidyselect_0.2.4 CVST_0.2-2 plyr_1.8.4 magrittr_1.5
[106] R6_2.2.2 snow_0.4-2 gplots_3.0.1 Hmisc_4.1-1 dimRed_0.1.0
[111] withr_2.1.2 pillar_1.2.2 foreign_0.8-70 mixtools_1.1.0 fitdistrplus_1.0-9
[116] survival_2.42-3 scatterplot3d_0.3-41 abind_1.4-5 nnet_7.3-12 tsne_0.1-3
[121] tibble_1.4.2 hdf5r_1.0.0 KernSmooth_2.23-15 grid_3.5.0 data.table_1.11.2
[126] FNN_1.1 ModelMetrics_1.1.0 metap_0.9 digest_0.6.15 diptest_0.75-7
[131] tidyr_0.8.0 R.utils_2.6.0 stats4_3.5.0 munsell_0.4.3 magic_1.5-8
Thanks for your help!
David
Hi,
I am using SoupX for my 10X data and it seems to be nice for reducing soup !
Recently, Seurat_v3.0 was pre-released accompanied with big upgrading of 10xCellRanger.
Seurat_v3.0:https://satijalab.org/seurat/
CellRanger3.0:https://www.10xgenomics.com/solutions/single-cell/
I want to use SoupX with Seurat_v3.0 .But I can not use new 10x data in SoupX now.
Could your team plant to update SoupX for Seurat_v3.0 ?
Best regards,
A declarative, efficient, and flexible JavaScript library for building user interfaces.
🖖 Vue.js is a progressive, incrementally-adoptable JavaScript framework for building UI on the web.
TypeScript is a superset of JavaScript that compiles to clean JavaScript output.
An Open Source Machine Learning Framework for Everyone
The Web framework for perfectionists with deadlines.
A PHP framework for web artisans
Bring data to life with SVG, Canvas and HTML. 📊📈🎉
JavaScript (JS) is a lightweight interpreted programming language with first-class functions.
Some thing interesting about web. New door for the world.
A server is a program made to process requests and deliver data to clients.
Machine learning is a way of modeling and interpreting data that allows a piece of software to respond intelligently.
Some thing interesting about visualization, use data art
Some thing interesting about game, make everyone happy.
We are working to build community through open source technology. NB: members must have two-factor auth.
Open source projects and samples from Microsoft.
Google ❤️ Open Source for everyone.
Alibaba Open Source for everyone
Data-Driven Documents codes.
China tencent open source team.