An updated version of the Grafana App for Kubernetes plugin (https://grafana.com/plugins/grafana-kubernetes-app), this plugin allows you to visualize and analyze your Kubernetes cluster’s performance. It demonstrates in graphics the main service metrics and characteristics of the Kubernetes cluster. It also makes it easier to examine the application’s life cycle and error logs.
- Grafana > 5.0.0
- Prometheus + node-exporter + kube-state-metrics (version >= 1.4.0)
- Grafana-piechart-panel
The plugin consists of three main info pages with detailed information about the Kubernetes cluster.
- Logic map of applications;
- Distribution of Kubernetes entities;
- List of pod entities with life metrics;
- Visual presentation of the application’s life cycle and its basic characteristics;
- Description of the ports that allow access services in the cluster.
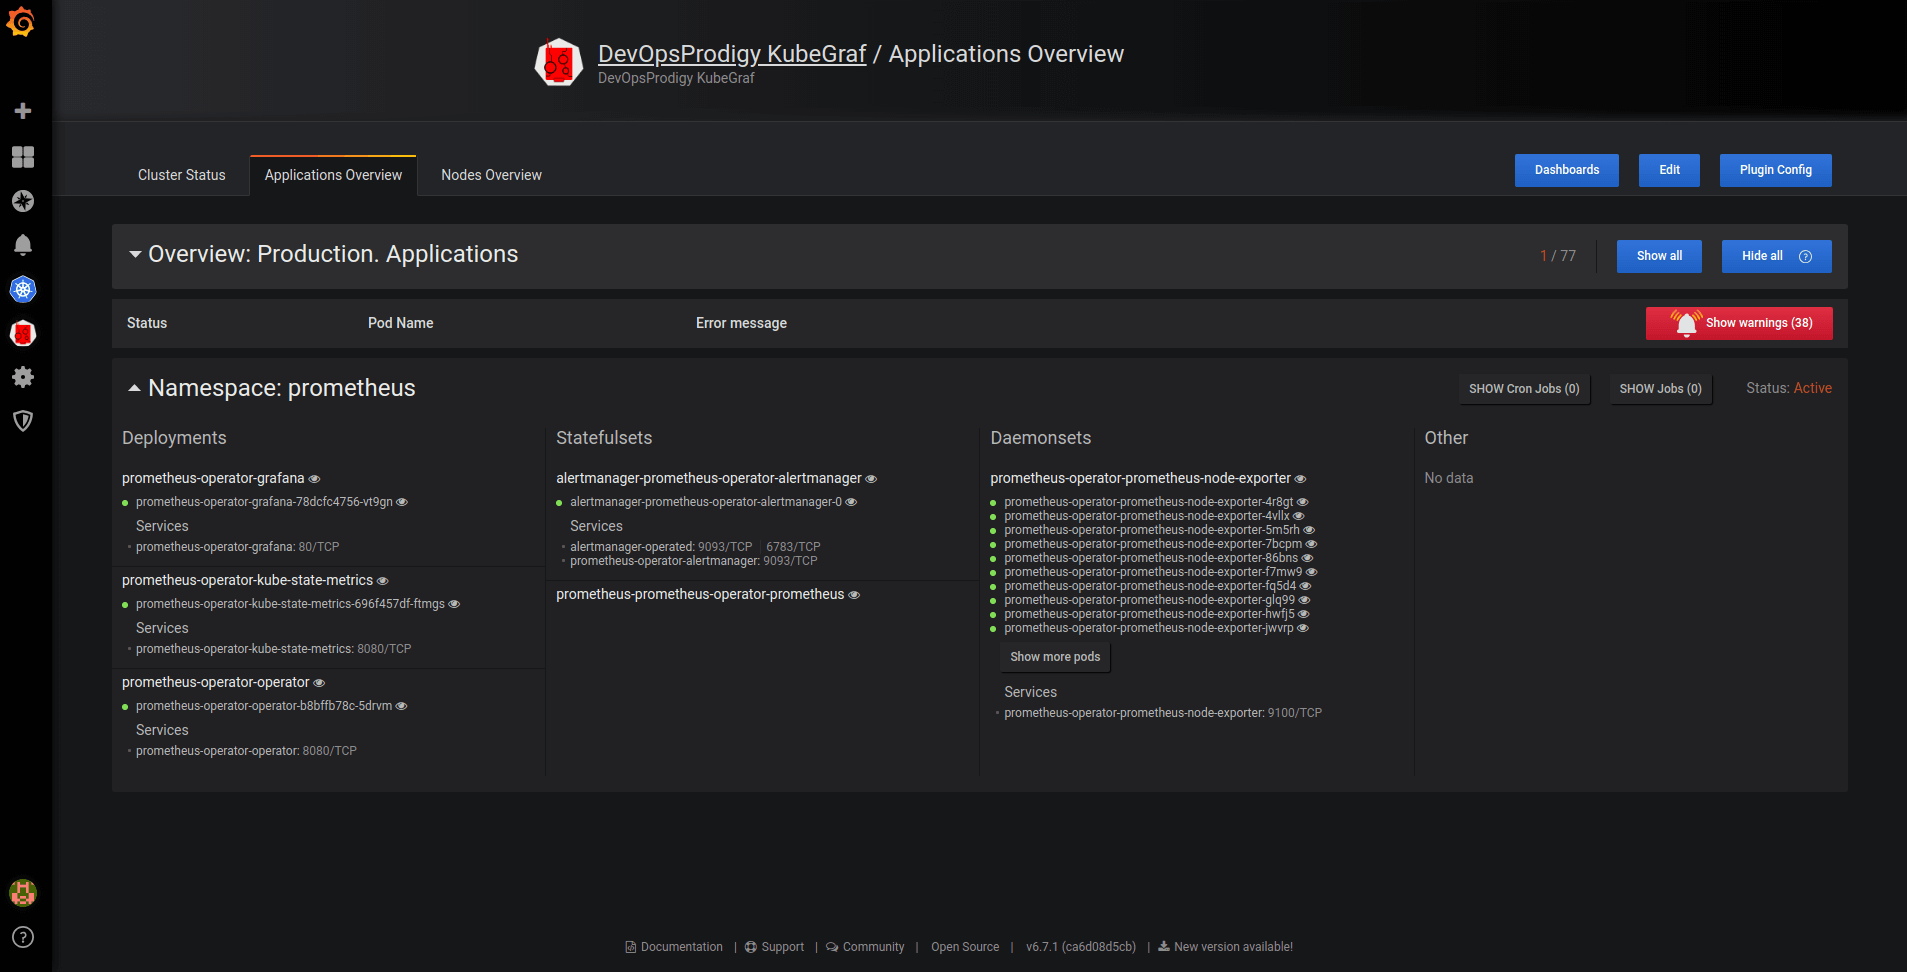
Pic. 1: Applications overview
- Summary about the status of the cluster and the nodes within it;
- Details of monitoring the application’s life cycle;
- Visual presentation of where the services in the cluster servers are located.
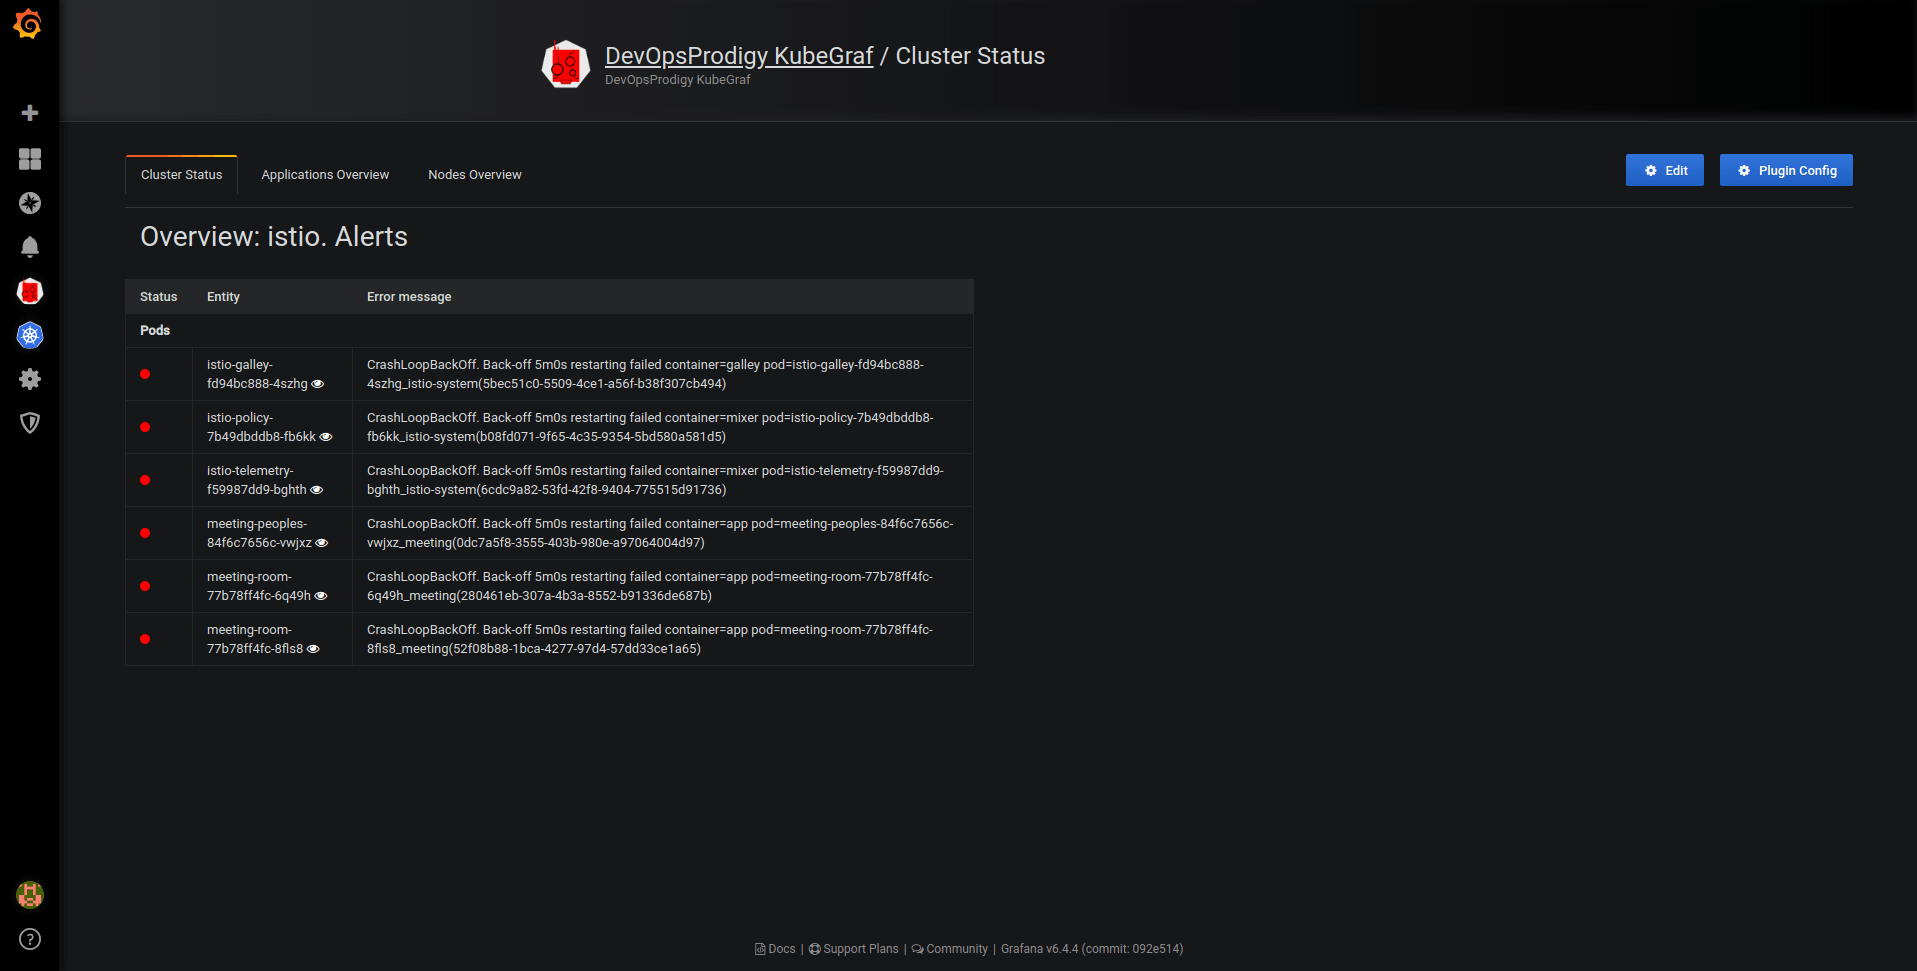
Pic. 2: Cluster status
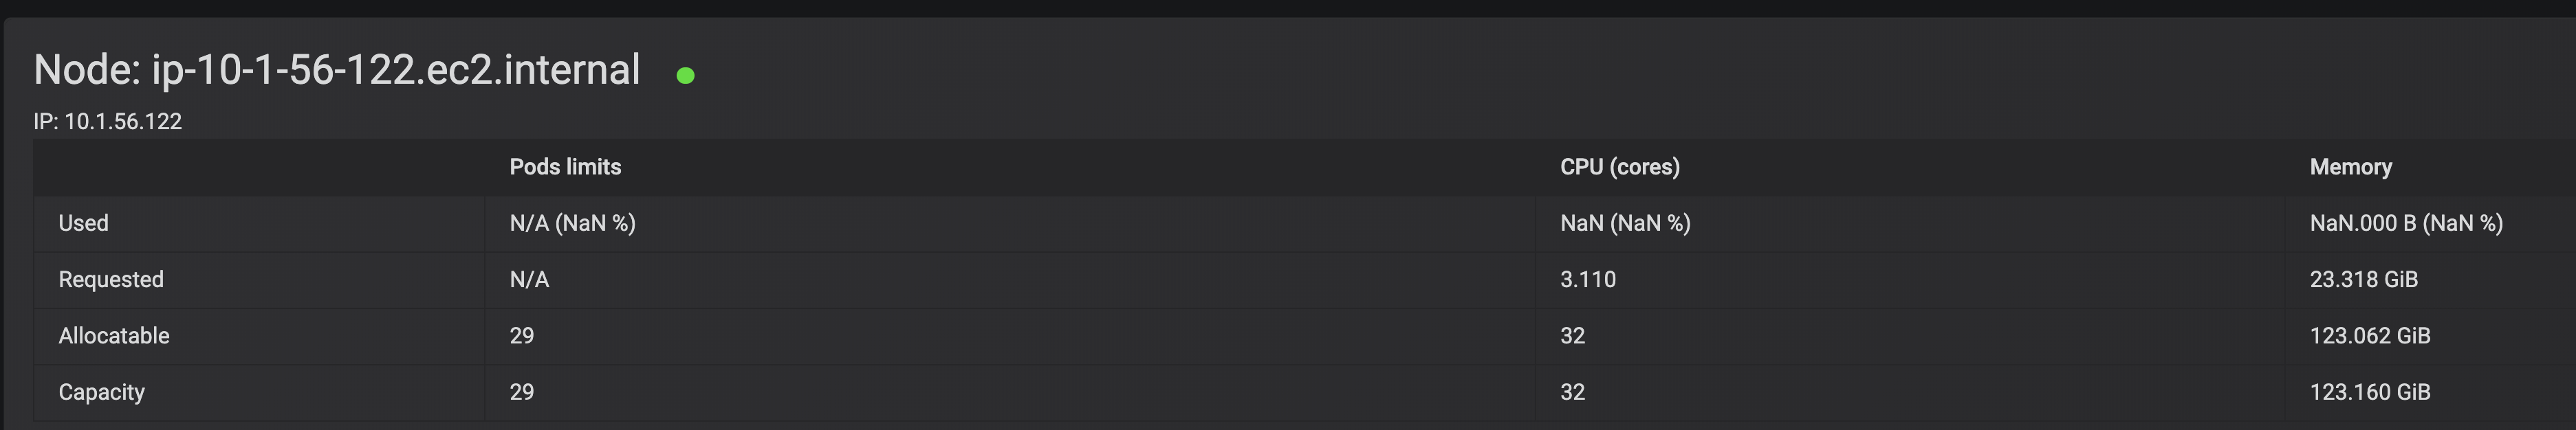
- Summary of cluster’s nodes;
- Information about used and allocated resources (RAM, CPU utilization) and the number of pods;
- Physical distribution of pods.
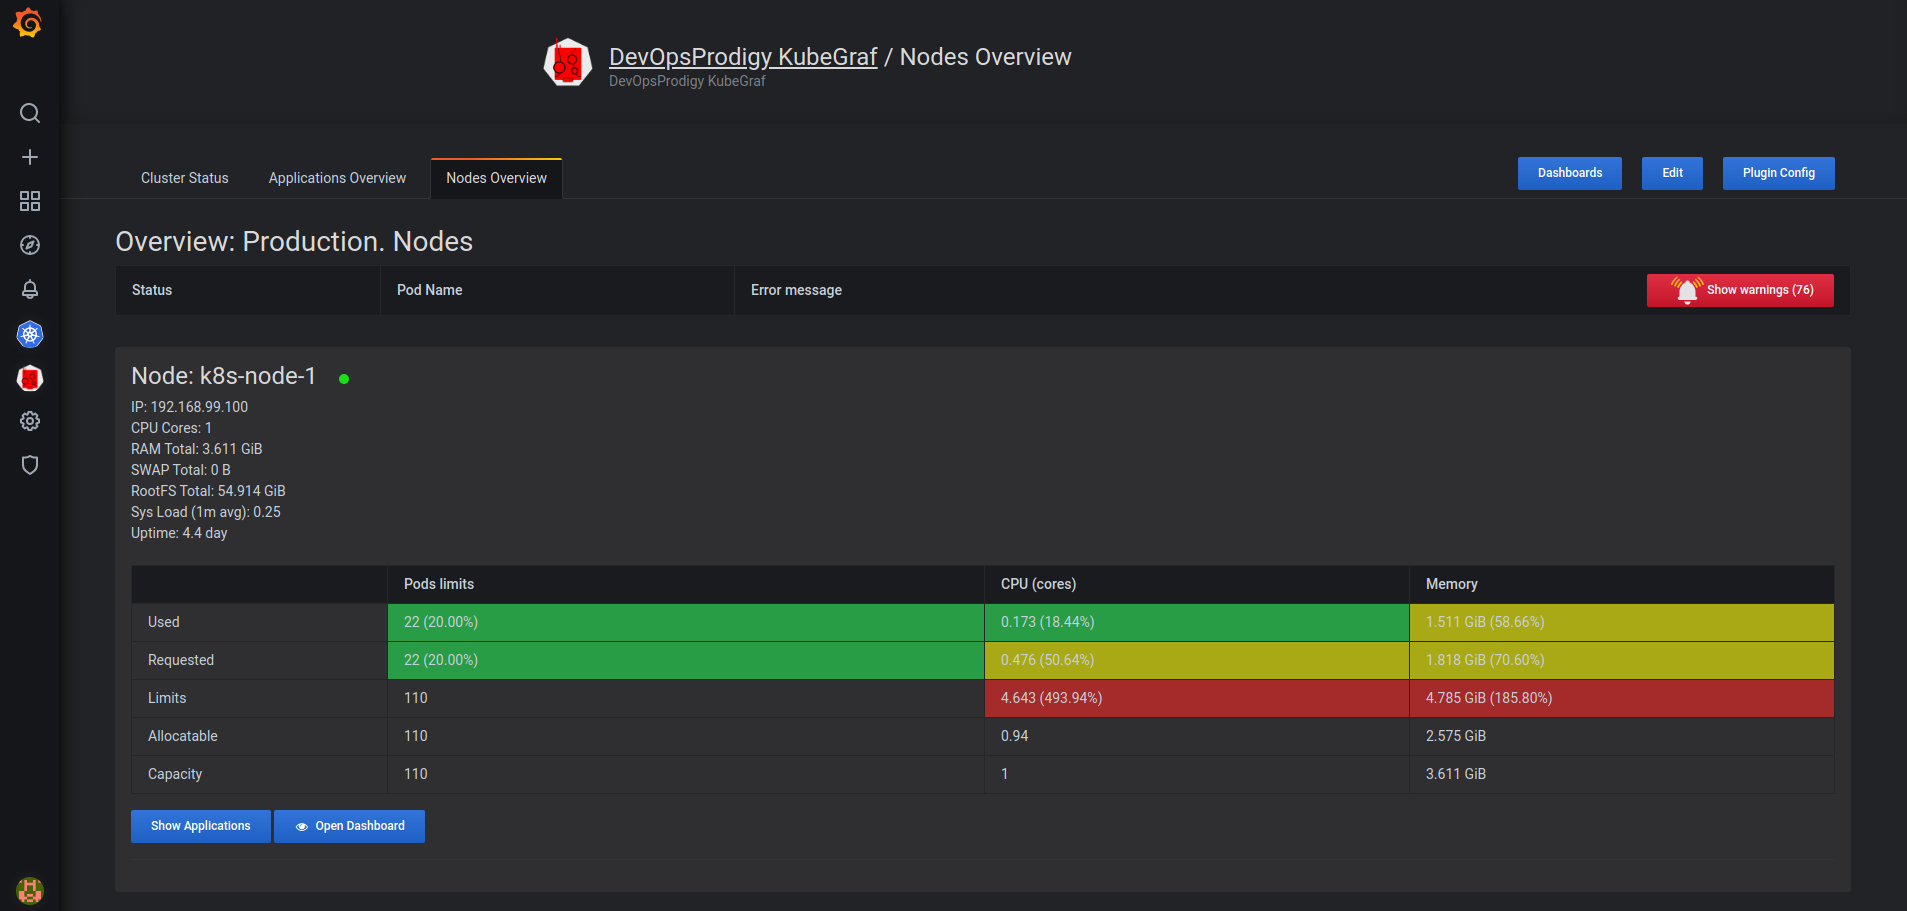
Pic. 3: Nodes overview
Besides providing general information on the main pages, the plugin allows you to track a cluster’s performance in graphs, which are located on five dashboards.
- node dashboard
This is a dashboard with node metrics. It displays the employment of resources like CPU utilization, memory consumption, percentage of CPU time in idle / iowait modes, and disk and network status.
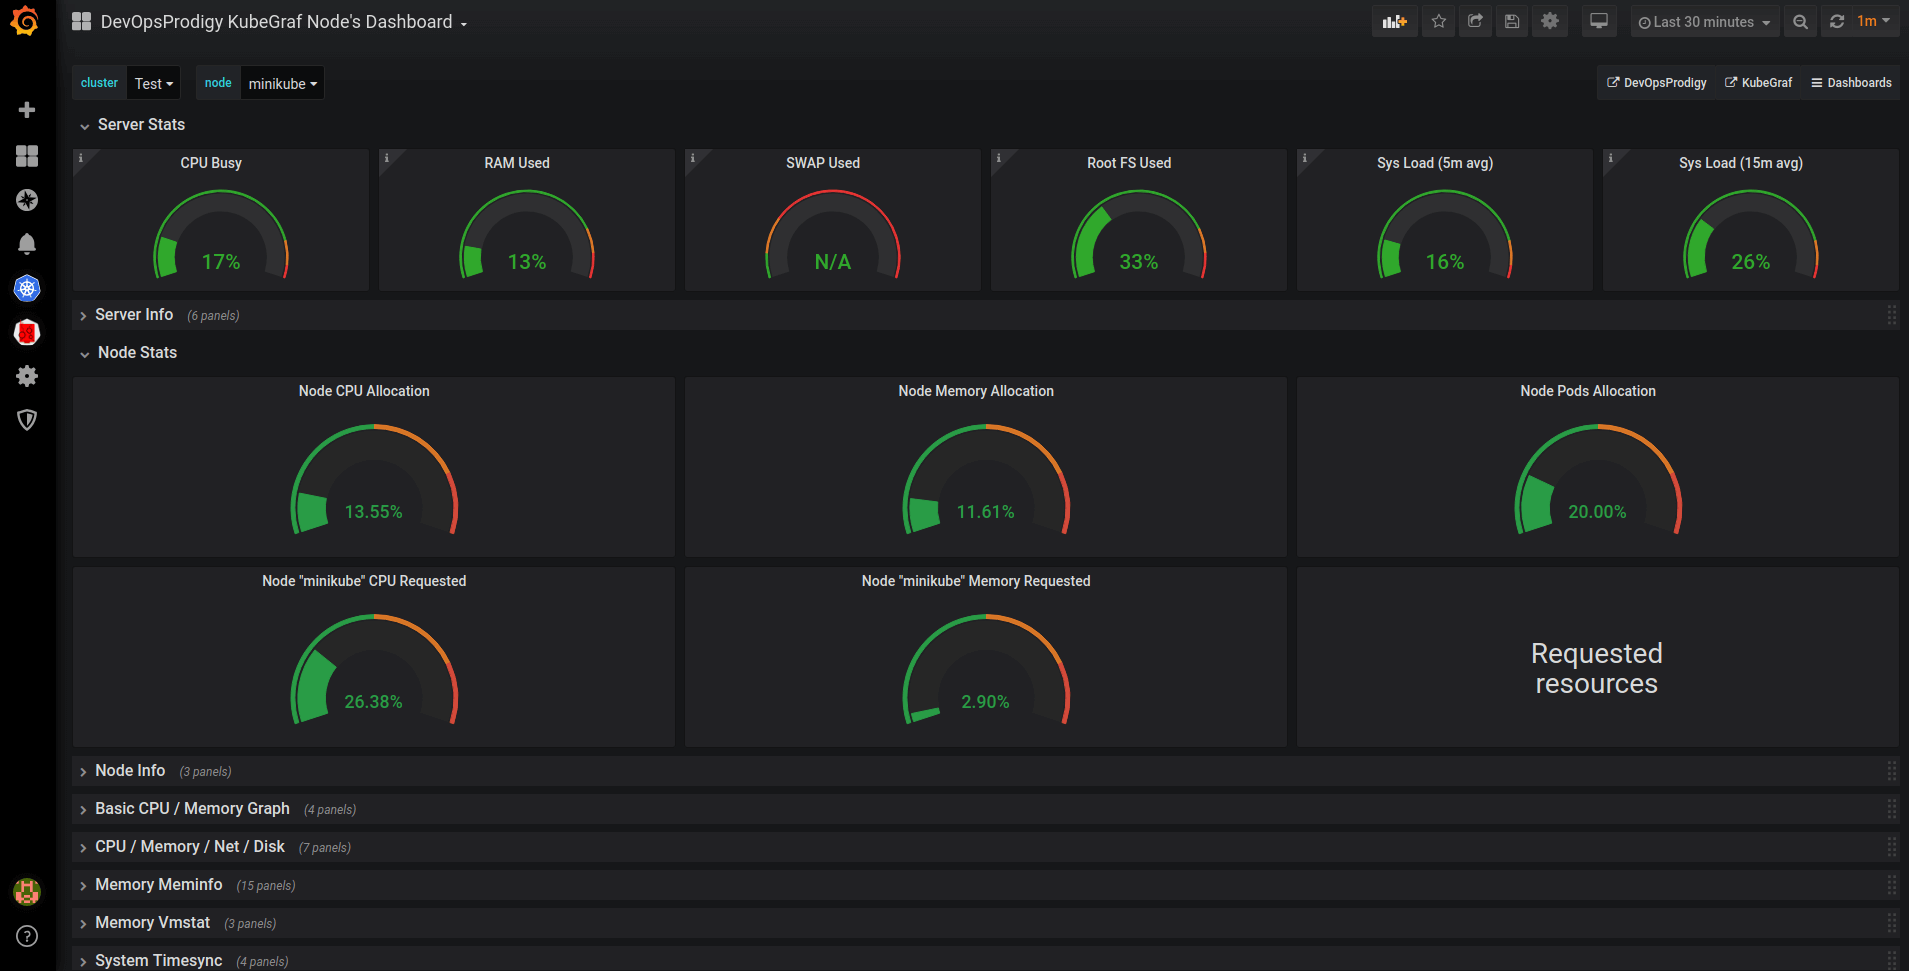
Pic. 4: Node dashboard
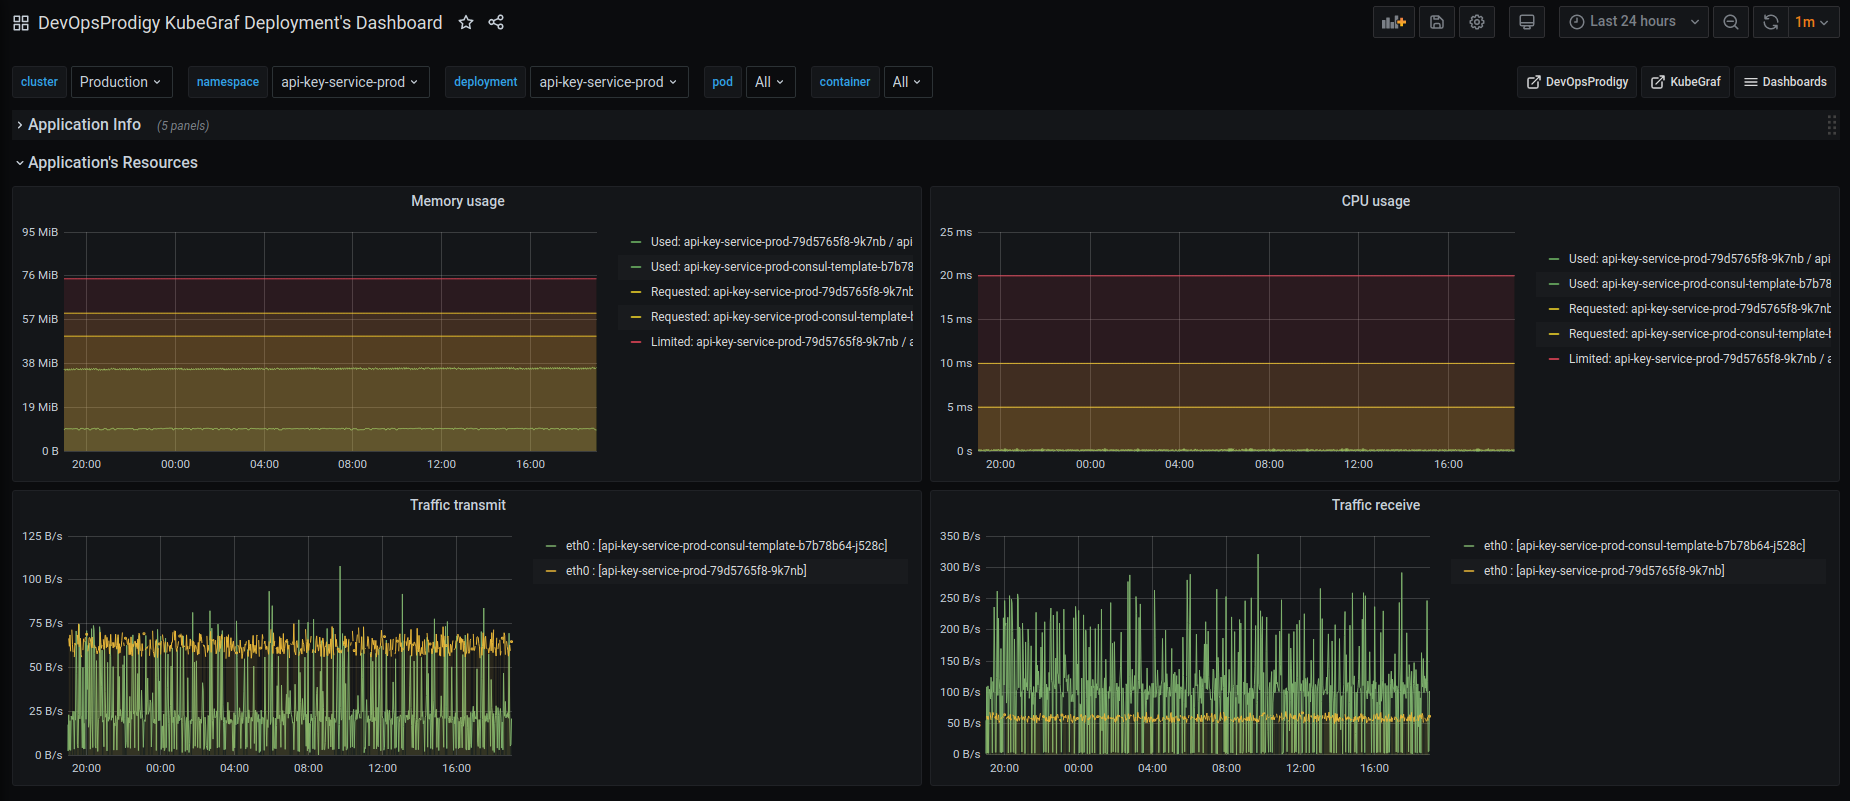
- pod resources
Displays how much of the resources the selected pod has used.
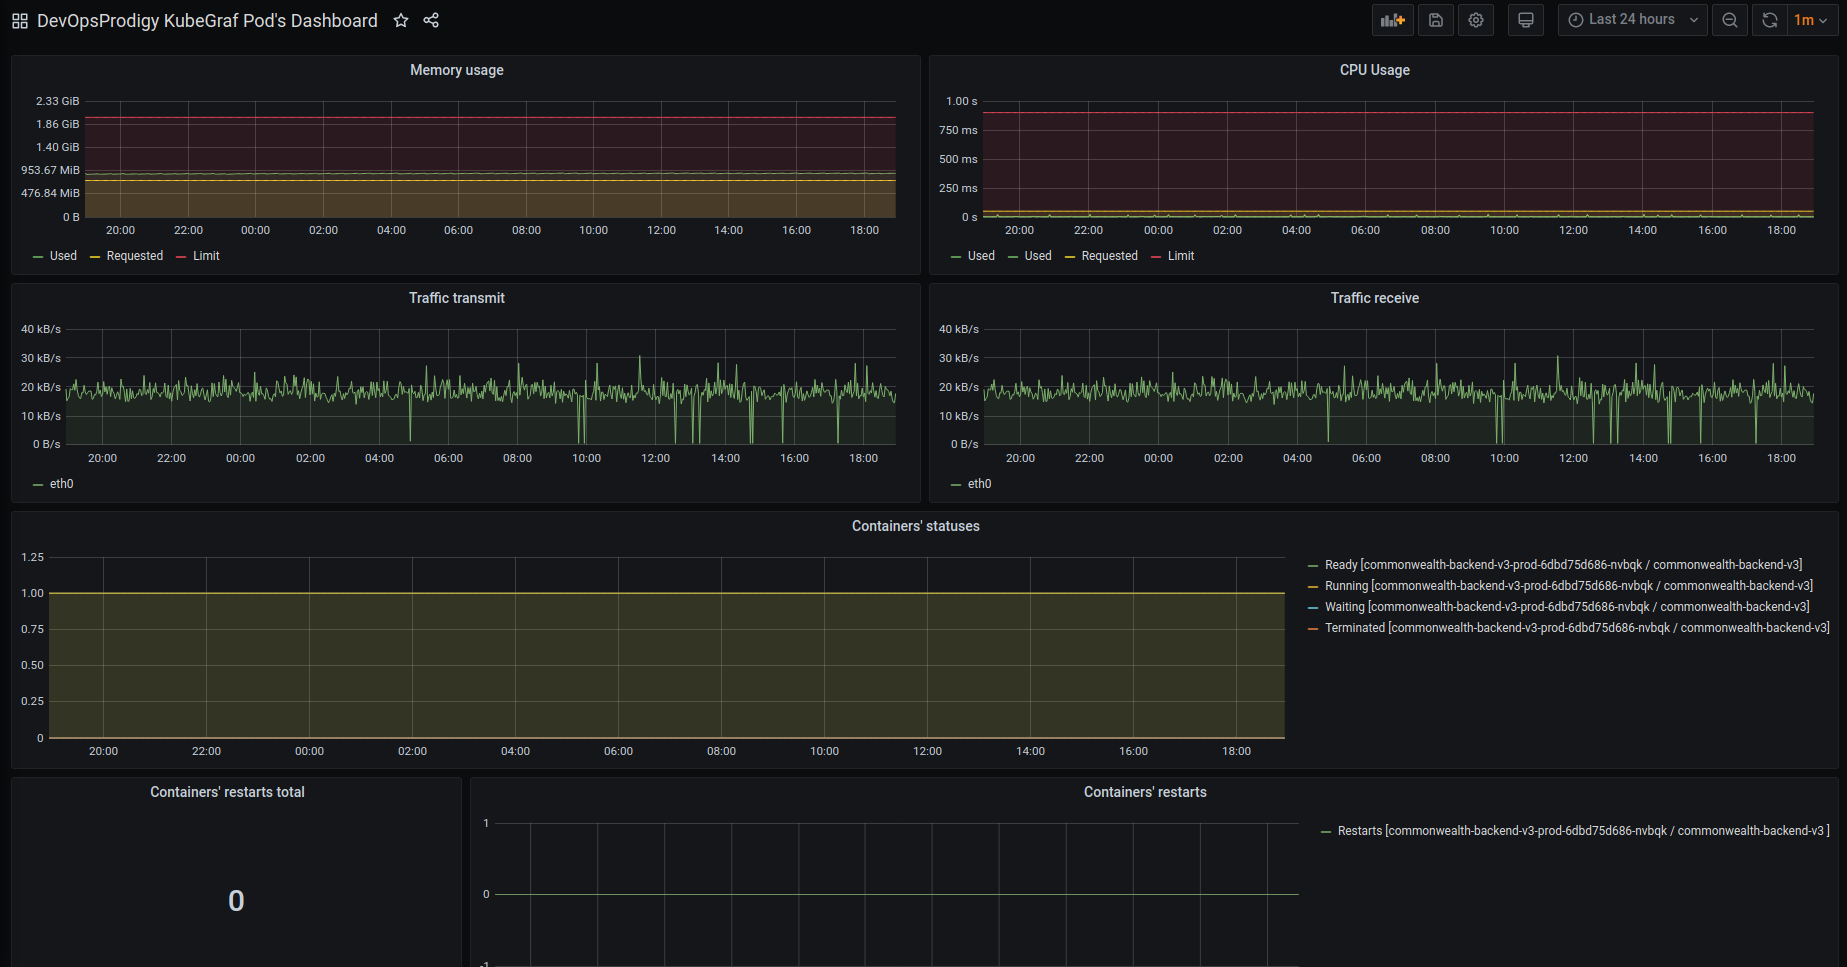
Pic. 5: Pod resources
- deployment dashboard
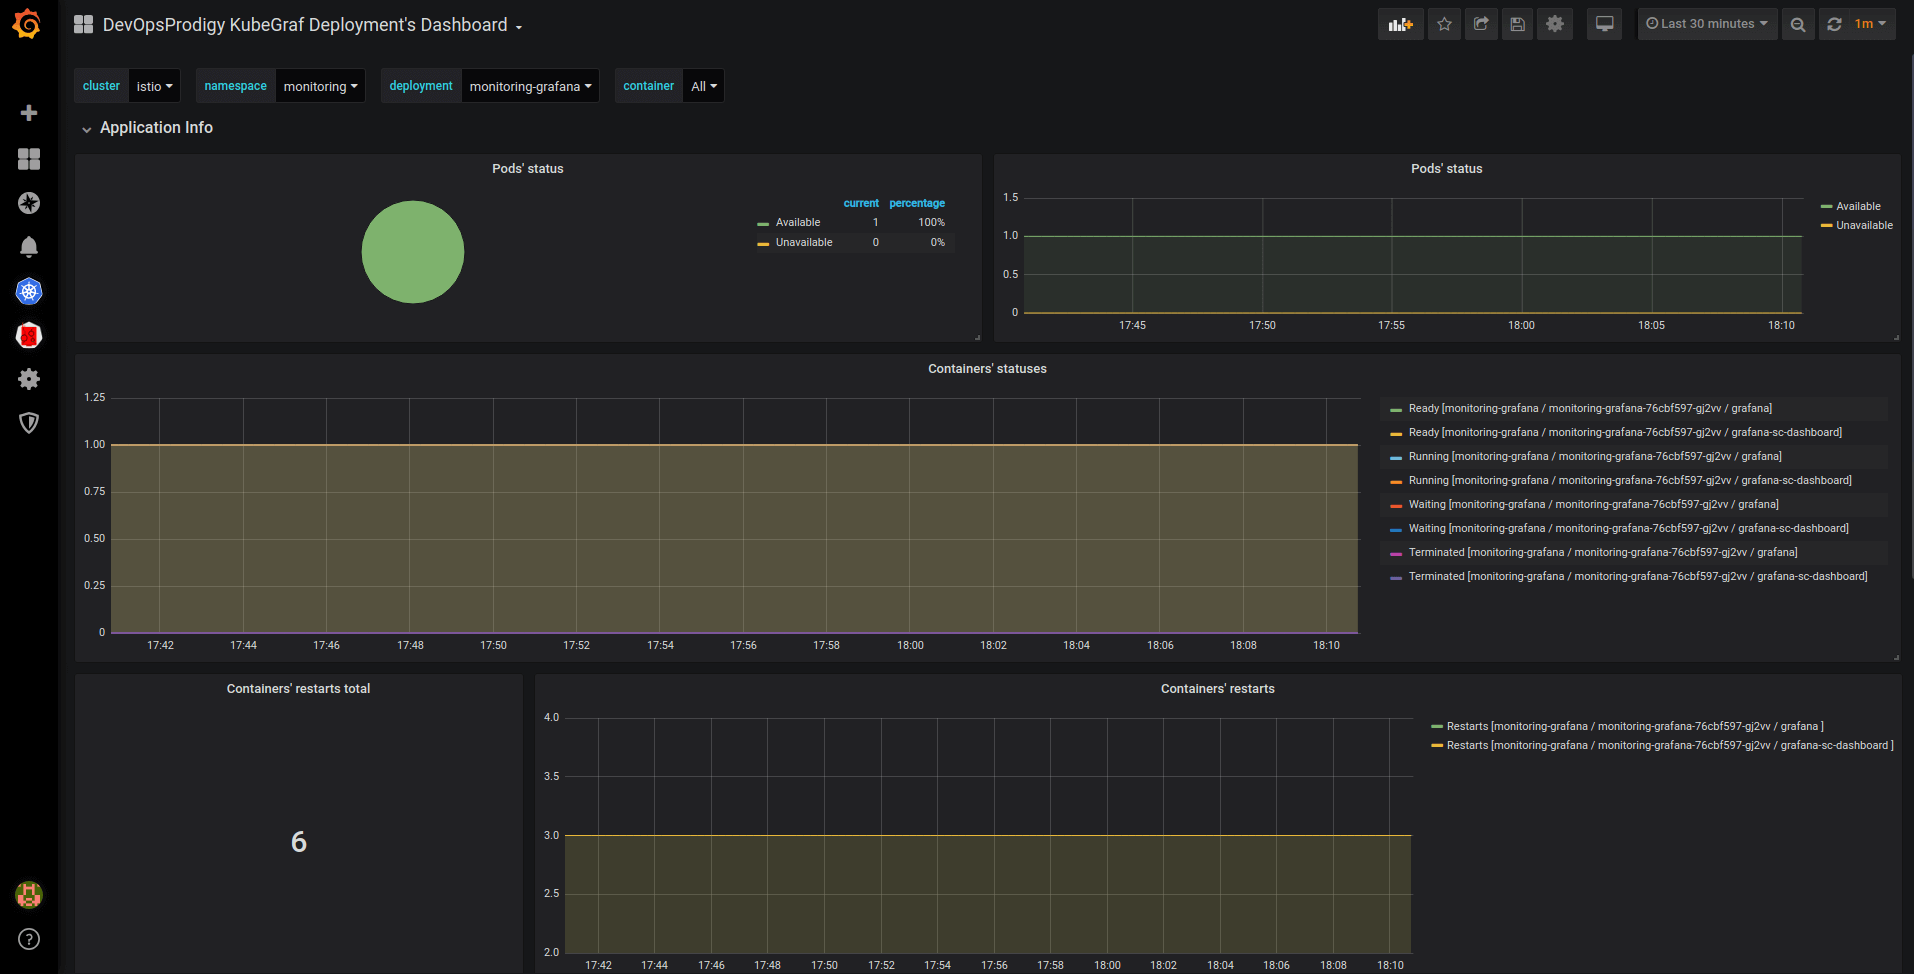
Pic. 6: Deployment dashboard
Pic. 7: Deployment dashboard
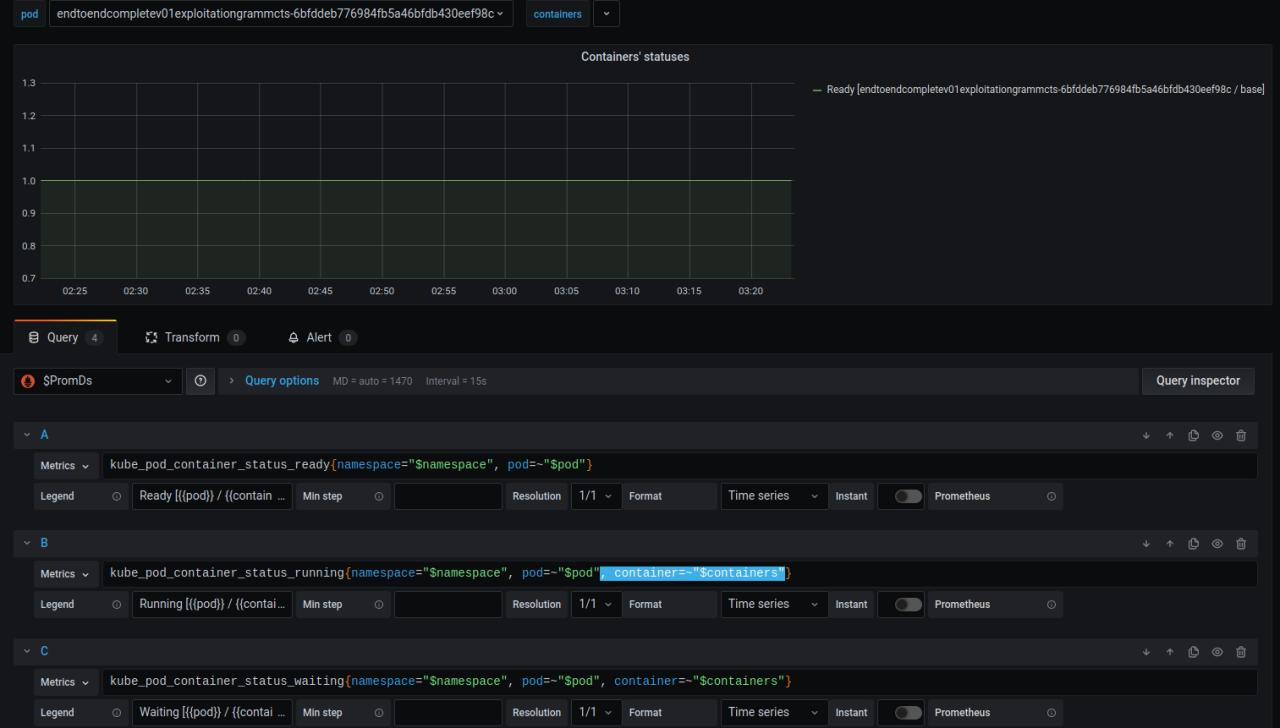
- statefulsets dashboard
- daemonsets dashboard
The above three dashboards show the number of available / unavailable application replicas and the status of containers in the pods of these applications, and trace containers’ restarts.
-
Go to the plugins directory in Grafana:
cd $GRAFANA_PATH/data/plugins -
Copy the repository:
git clone https://github.com/devopsprodigy/kubegraf /var/lib/grafana/plugins/devopsprodigy-kubegraf-appand restart grafana-serveror
grafana-cli plugins install devopsprodigy-kubegraf-appand restart grafana-server. -
Create namespace "kubegraf" and apply Kubernetes manifests from kubernetes/ directory to give required permissions to the user
grafana-kubegraf:kubectl create ns kubegraf kubectl apply -f https://raw.githubusercontent.com/devopsprodigy/kubegraf/master/kubernetes/serviceaccount.yaml kubectl apply -f https://raw.githubusercontent.com/devopsprodigy/kubegraf/master/kubernetes/clusterrole.yaml kubectl apply -f https://raw.githubusercontent.com/devopsprodigy/kubegraf/master/kubernetes/clusterrolebinding.yaml kubectl apply -f https://raw.githubusercontent.com/devopsprodigy/kubegraf/master/kubernetes/secret.yaml -
Create a
grafana-kubegrafuser private key and certificate on one of the master nodes:openssl genrsa -out ~/grafana-kubegraf.key 2048 openssl req -new -key ~/grafana-kubegraf.key -out ~/grafana-kubegraf.csr -subj "/CN=grafana-kubegraf/O=monitoring" openssl x509 -req -in ~/grafana-kubegraf.csr -CA /etc/kubernetes/pki/ca.crt -CAkey /etc/kubernetes/pki/ca.key -out /etc/kubernetes/pki/grafana-kubegraf.crt -CAcreateserialCopy /etc/kubernetes/pki/grafana-kubegraf.crt to all other master nodes.
or
Get the token
kubectl get secret grafana-kubegraf-secret -o jsonpath={.data.token} -n kubegraf | base64 -d -
Go to /configuration-plugins in Grafana and click on the plugin. Then click “enable”.
-
Go to the plugin and select “create cluster”.
-
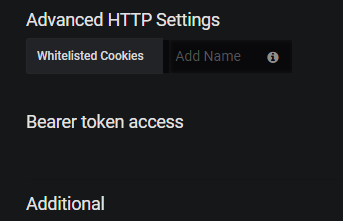
Enter the settings of http-access to the Kubernetes api server:
- Kubernetes master's url from
kubectl cluster-info - Enter the certificate and key from step #4 "TLS Client Auth" section Or The token from step #4 in "Bearer token access" section
- Kubernetes master's url from
-
Open the “additional datasources” drop-down list and select the prometheus that is used in this cluster.