devopsprodigy / kubegraf Goto Github PK
View Code? Open in Web Editor NEWGrafana-plugin for k8s' monitoring
License: MIT License
Grafana-plugin for k8s' monitoring
License: MIT License
v1.1.1 plugin
Grafana 6.4.3
Connected via token to the cluster, we do get statistics, just not the above-mentioned; also connected to Prometheus backend data source.
Hello,
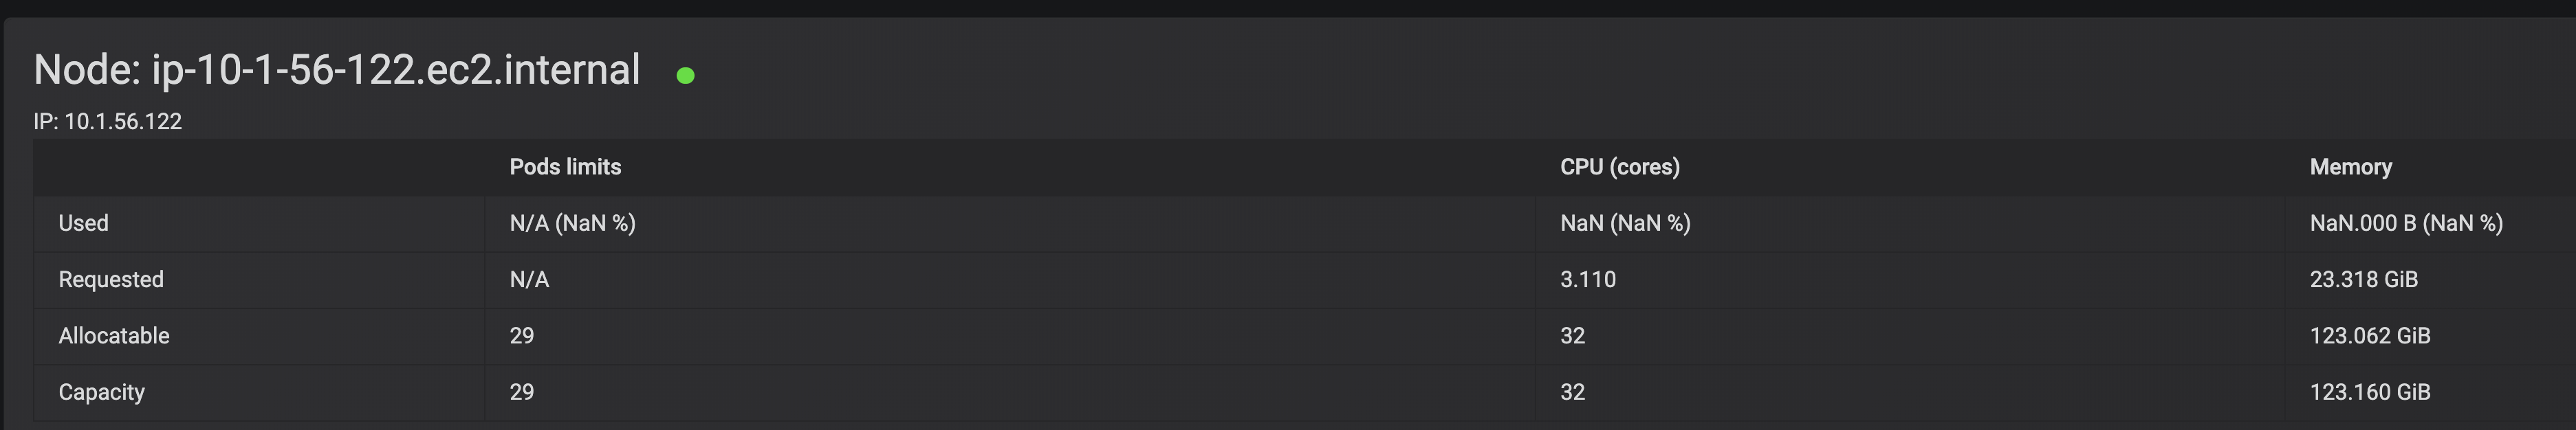
Any idea why the gauges and the underlying values below aren't being populated for each node (See the NaN%s).
Great plugin, and thanks in advance for your help!
Please add the ability to authenticate to the cluster using bearer token auth. This will allow to simply create a ServiceAccount with required permissions using manifests and use it's token to authenticate KubeGraf to the cluster. For now it's required to create a user or sign a certificate which requires root access to the master nodes.
Kubegraf 1.1.1
Grafana 6.3.5
Kubernetes 1.15.3
Prometheus 2.12.0
Kube-state-metrics: 1.8.0
There are some issue in plugin query in the cluster overview tab (see screen below)

Hello !
Please, tell me - are you planning to create a dashboard for cronjobs and the cluster state overview?
Hi @SergeiSporyshev on the Node Overview page, the Used and Requested Pod Limits, CPU and Memory shows double the count as on the cluster.
Below are the screenshots for referrence:
kubectl describe node


Node Overview page

If you see the images..the pod count from describing the node is 15 and on the overview page it shows 30.
Likewise for CPU and Memory.
Can you please look in to the issue and let me know why is it so?
I don't see any possibility connect to my GKE cluster to kubegraf
I'm trying to use current configuration:

However, during tests connection, in grafana logs I've just see:
status=403
Firefox: 70.0
Grafana 6.3.5
Kubernetes 1.15
Kube-state-metrics: 1.8.0
Kubegraf 1.1.1
The image below will say more than a thousand words :)

Hi , I have installed this plugin and configured it with my Kubernetes cluster details.
I am able to see data in all other dashboards other than the nodes dashboard.

Can anyone help me with this?
Please, add detailed instructions on how to add k8s cluster. It's not obvious
Thank you!
Hi Guys,
If use the latest version of Kube Graf and Grafana (v6.6.0) , fails the when access to cluster list , not appear .
Thanks
Anyone is able to fix this?

Hi!
Facing a strange issue: some of node's metrics (pod limits usage percent, for example) are missing on the tab Nodes overview (N/A NaN%). On the other hand, all these metrics are available in prometheus.
Could you please check and investigate? All screenshots are attached.
Kubernetes v1.15.3 (on-premise, kubespray)
Prometheus from helm chart stable/prometheus (9.1.1), node-exporter image prom/node-exporter:v0.18.0


I installed the plugin and add AKS cluster with token auth. As the result nodes, podes, namespaces and etc are detected but no date are available.


Is there a file I can drop somewhere to have this plugin enabled and configured on deploy?
I can (hopefully) easily write a k8s configmap to include the config file in my Kustomization for deployment.
The Clusters page, that lists all configured clusters, does not work properly in Grafana 7.0.4 and later versions. The layout and styling seems to be broken.
Is there a way to configure authentication for k8s cluster on GKE?
thanks
Why did you remove the monitoring of the Pod Disk IO from the original app ?
is there an issue with measuring the POD Disk IO ? Are the metrics returned by CAdviser not reliable ?
If not could add them back ?

This is from the DaemonSets dashboard. We run a daemonset on 36 nodes, and due to the "Area Fill" setting being '1' by default, the graph is fairly illegible when being used on larger workflows. This is because each pod in the daemon set has two lines in this case, one for its usage and one for its request.
With Area fill on; the requests, which in this case are higher than our average usage, completely block off the dashboard.
The pie chart isn't displaying the current Pod status. If the Prometheus data source is set to "Instant" it updates instantly.
The scale on the container/pods status graphs don't need .5 on the scale so you could set the scale to not have a decimal place.

Hello,
I'm trying to ad an k3s cluster following the instructions provided.
url: https://192.168.0.200:6443 with bearer token access.
When adding the cluster in grafana I receive 502 bad gateway error.
Is k3s supported by this plugin?
Regards,
Ronald
Hi @SergeiSporyshev I have upgraded my grafana version to 7.3.3 i am able to see the plugin configured but on the nodes overview page data is not visible.

Although I am able to see data on Application overview page
Is there any compatibility issue?
Because when I upgraded grafana to 7.2 all the data is visible.
Also I am using devopsprodigy-kubegraf-app plugin version 1.4.2
kubelet_running_pod_count, container_cpu_usage_seconds_total and container_memory_usage_bytes have no label node
Example:
kubelet_running_pod_count{beta_kubernetes_io_arch="amd64",beta_kubernetes_io_instance_type="m5a.large",beta_kubernetes_io_os="linux",failure_domain_beta_kubernetes_io_region="eu-central-1",failure_domain_beta_kubernetes_io_zone="eu-central-1a",instance="ip-10-102-36-19.eu-central-1.compute.internal",job="kubernetes-nodes",kops_k8s_io_instancegroup="nodes",kubernetes_io_hostname="ip-10-102-36-19.eu-central-1.compute.internal",kubernetes_io_role="node"}
Grafana v7.0.3
Kubegraf v1.4.0
Kubernetes v1.17.3
Prometheus Operator 8.13.7
Dashboard: DevOpsProdigy KubeGraf Pod's Dashboard
I want to view info about pod's that deleted. Label named "containers" block it
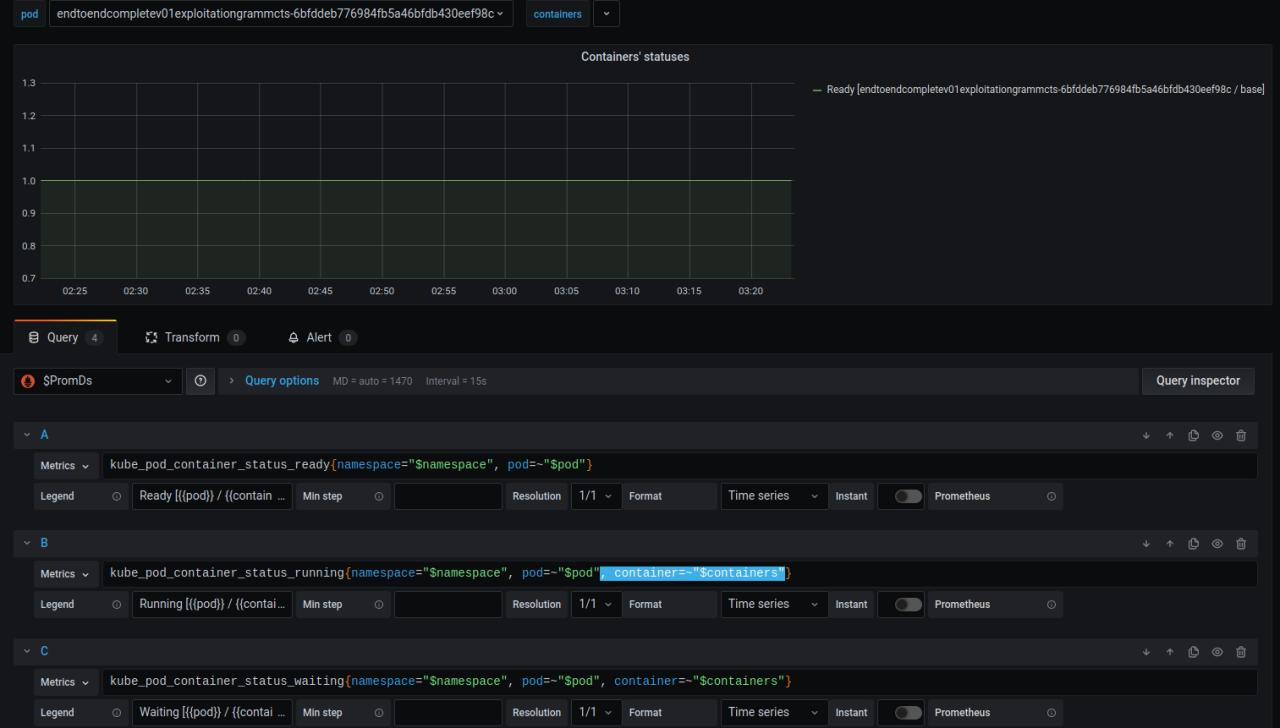
I mean that issue blocks all graphs besides IOPS graph
Hi,
do you have recommended configuration for Prometheus?
We have our own configuration and some graphs doesn't work in your dashboards. Probably because of missing metrics, labels..
Thank You.
Hello. There is not any instruction how to install prometheus for kubegraf.
I tried to install kube-prometheus-stack, but it doesn't work. Maybe because it in not suitable for kubegraf, maybe because there is no kube-proxy data (as I understand, this data is not available because of our kubernetes cloud provider, we can't change this parameter: https://github.com/prometheus-community/helm-charts/tree/main/charts/kube-prometheus-stack#kubeproxy)
Not all people are so familiar with Prometheus,
Sometimes we need to quickly figure out the health of the entire cluster, and that dashboard may be useful. What it should consist of (for example):
Some inspirations:

I've just created a k3d cluster with 1 master and two worker like this:
k3d create --name k3s --workers 2 --enable-registry --publish "80:80" --publish "443:443"
So,
$ kubectl cluster-info
Kubernetes master is running at https://localhost:6443
CoreDNS is running at https://localhost:6443/api/v1/namespaces/kube-system/services/kube-dns:dns/proxy
Metrics-server is running at https://localhost:6443/api/v1/namespaces/kube-system/services/https:metrics-server:/proxy)
and:
$ kubectl get nodes -o wide
NAME               STATUS   ROLES    AGE   VERSION         INTERNAL-IP   EXTERNAL-IP   OS-IMAGE   KERNEL-VERSION     CONTAINER-RUNTIME
k3d-k3s-server     Ready    master   19h   v1.17.0+k3s.1   172.18.0.2    <none>        Unknown    5.3.0-28-generic   containerd://1.3.0-k3s.5
k3d-k3s-worker-1   Ready    <none>   19h   v1.17.0+k3s.1   172.18.0.3    <none>        Unknown    5.3.0-28-generic   containerd://1.3.0-k3s.5
k3d-k3s-worker-0   Ready    <none>   19h   v1.17.0+k3s.1   172.18.0.4    <none>        Unknown    5.3.0-28-generic   containerd://1.3.0-k3s.5
I''ve installed prometheus,prometheus-node-exporter, kube-state-metrics and finally grafana INSIDE this cluster:
$ kubectl get pods -o wide
NAME                                                        READY   STATUS    RESTARTS   AGE   IP           NODE               NOMINATED NODE   READINESS GATES
prometheus-1581525036-node-exporter-v6s9q                   1/1     Running   1          17h   172.18.0.4   k3d-k3s-worker-0   <none>           <none>
prometheus-1581525036-alertmanager-565b88f495-jbdmr         2/2     Running   2          17h   10.42.1.13   k3d-k3s-worker-0   <none>           <none>
prometheus-1581525036-server-8665456fc5-9dg9j               2/2     Running   2          17h   10.42.2.13   k3d-k3s-worker-1   <none>           <none>
kube-state-metrics-1581525391-679784cd78-pphfr              1/1     Running   1          17h   10.42.0.15   k3d-k3s-server     <none>           <none>
prometheus-1581525036-node-exporter-nv9r2                   1/1     Running   1          17h   172.18.0.5   k3d-k3s-worker-1   <none>           <none>
prometheus-1581525036-node-exporter-jr6q6                   1/1     Running   1          17h   172.18.0.3   k3d-k3s-server     <none>           <none>
prometheus-1581525036-pushgateway-5d6f976d8-7rdpm           1/1     Running   1          17h   10.42.0.14   k3d-k3s-server     <none>           <none>
prometheus-1581525036-kube-state-metrics-697b6d548d-rszjg   1/1     Running   1          17h   10.42.2.12   k3d-k3s-worker-1   <none>           <none>
grafana-1581527163-95f5766d8-czn9h                          1/1     Running   2          16h   10.42.0.13   k3d-k3s-server     <none>           <none>
As you can see here, all my targets are healthy:

I've also confugred plugin setting:

However, I'm not able to get information. the logs are:
2020/02/13 10:45:16 http: proxy error: dial tcp 172.18.0.2:8443: connect: connection refused
t=2020-02-13T10:45:16+0000 lvl=info msg="Request Completed" logger=context userId=1 orgId=1 uname=admin method=GET path=/api/datasources/proxy/3/__proxy/api/v1/componentstatuses status=502 remote_addr=10.42.0.10 time_ms=29 size=0 referer="http://grafana.localhost/plugins/devopsprodigy-kubegraf-app/page/cluster-status?clusterName=k3d"
t=2020-02-13T10:45:16+0000 lvl=info msg="Request Completed" logger=context userId=1 orgId=1 uname=admin method=GET path=/api/datasources/proxy/3/__proxy/api/v1/nodes status=502 remote_addr=10.42.0.10 time_ms=28 size=0 referer="http://grafana.localhost/plugins/devopsprodigy-kubegraf-app/page/cluster-status?clusterName=k3d"
2020/02/13 10:45:16 http: proxy error: dial tcp: lookup prometheus-1581525036-server.monitoring.svc.cluster.local: no such host
2020/02/13 10:45:16 http: proxy error: dial tcp: lookup prometheus-1581525036-server.monitoring.svc.cluster.local: no such host
t=2020-02-13T10:45:16+0000 lvl=info msg="Request Completed" logger=context userId=1 orgId=1 uname=admin method=GET path=/api/datasources/proxy/1/api/v1/query_range status=502 remote_addr=10.42.0.10 time_ms=1 size=0 referer="http://grafana.localhost/plugins/devopsprodigy-kubegraf-app/page/cluster-status?clusterName=k3d"
t=2020-02-13T10:45:16+0000 lvl=info msg="Request Completed" logger=context userId=1 orgId=1 uname=admin method=GET path=/api/datasources/proxy/1/api/v1/query_range status=502 remote_addr=10.42.0.10 time_ms=1 size=0 referer="http://grafana.localhost/plugins/devopsprodigy-kubegraf-app/page/cluster-status?clusterName=k3d"
2020/02/13 10:45:16 http: proxy error: dial tcp: lookup prometheus-1581525036-server.monitoring.svc.cluster.local: no such host
2020/02/13 10:45:16 http: proxy error: dial tcp: lookup prometheus-1581525036-server.monitoring.svc.cluster.local: no such host
t=2020-02-13T10:45:16+0000 lvl=info msg="Request Completed" logger=context userId=1 orgId=1 uname=admin method=GET path=/api/datasources/proxy/1/api/v1/query_range status=502 remote_addr=10.42.0.10 time_ms=0 size=0 referer="http://grafana.localhost/plugins/devopsprodigy-kubegraf-app/page/cluster-status?clusterName=k3d"
t=2020-02-13T10:45:16+0000 lvl=info msg="Request Completed" logger=context userId=1 orgId=1 uname=admin method=GET path=/api/datasources/proxy/1/api/v1/query_range status=502 remote_addr=10.42.0.10 time_ms=1 size=0 referer="http://grafana.localhost/plugins/devopsprodigy-kubegraf-app/page/cluster-status?clusterName=k3d"
2020/02/13 10:45:16 http: proxy error: dial tcp: lookup prometheus-1581525036-server.monitoring.svc.cluster.local: no such host
t=2020-02-13T10:45:16+0000 lvl=info msg="Request Completed" logger=context userId=1 orgId=1 uname=admin method=GET path=/api/datasources/proxy/1/api/v1/query_range status=502 remote_addr=10.42.0.10 time_ms=0 size=0 referer="http://grafana.localhost/plugins/devopsprodigy-kubegraf-app/page/cluster-status?clusterName=k3d"
t=2020-02-13T10:46:16+0000 lvl=info msg=Requesting logger=data-proxy-log url=https://172.18.0.2:8443/api/v1/pods
2020/02/13 10:46:16 http: proxy error: dial tcp 172.18.0.2:8443: connect: connection refused
t=2020-02-13T10:46:16+0000 lvl=info msg="Request Completed" logger=context userId=1 orgId=1 uname=admin method=GET path=/api/datasources/proxy/3/__proxy/api/v1/pods status=502 remote_addr=10.42.0.10 time_ms=13 size=0 referer="http://grafana.localhost/plugins/devopsprodigy-kubegraf-app/page/cluster-config?clusterId=3"
t=2020-02-13T10:46:16+0000 lvl=info msg=Requesting logger=data-proxy-log url=https://172.18.0.2:8443/api/v1/componentstatuses
2020/02/13 10:46:16 http: proxy error: dial tcp 172.18.0.2:8443: connect: connection refused
t=2020-02-13T10:46:16+0000 lvl=info msg="Request Completed" logger=context userId=1 orgId=1 uname=admin method=GET path=/api/datasources/proxy/3/__proxy/api/v1/componentstatuses status=502 remote_addr=10.42.0.10 time_ms=10 size=0 referer="http://grafana.localhost/plugins/devopsprodigy-kubegraf-app/page/cluster-config?clusterId=3"
t=2020-02-13T10:46:16+0000 lvl=info msg=Requesting logger=data-proxy-log url=https://172.18.0.2:8443/api/v1/nodes
2020/02/13 10:46:16 http: proxy error: dial tcp 172.18.0.2:8443: connect: connection refused
t=2020-02-13T10:46:16+0000 lvl=info msg="Request Completed" logger=context userId=1 orgId=1 uname=admin method=GET path=/api/datasources/proxy/3/__proxy/api/v1/nodes status=502 remote_addr=10.42.0.10 time_ms=18 size=0 referer="http://grafana.localhost/plugins/devopsprodigy-kubegraf-app/page/cluster-config?clusterId=3"
t=2020-02-13T10:46:20+0000 lvl=info msg=Requesting logger=data-proxy-log url=https://172.18.0.2:8443/api/v1/pods
2020/02/13 10:46:20 http: proxy error: dial tcp 172.18.0.2:8443: connect: connection refused
t=2020-02-13T10:46:20+0000 lvl=info msg="Request Completed" logger=context userId=1 orgId=1 uname=admin method=GET path=/api/datasources/proxy/3/__proxy/api/v1/pods status=502 remote_addr=10.42.0.10 time_ms=16 size=0 referer="http://grafana.localhost/plugins/devopsprodigy-kubegraf-app/page/cluster-status?clusterName=k3d"
t=2020-02-13T10:46:20+0000 lvl=info msg=Requesting logger=data-proxy-log url=https://172.18.0.2:8443/api/v1/componentstatuses
2020/02/13 10:46:20 http: proxy error: dial tcp 172.18.0.2:8443: connect: connection refused
t=2020-02-13T10:46:20+0000 lvl=info msg="Request Completed" logger=context userId=1 orgId=1 uname=admin method=GET path=/api/datasources/proxy/3/__proxy/api/v1/componentstatuses status=502 remote_addr=10.42.0.10 time_ms=19 size=0 referer="http://grafana.localhost/plugins/devopsprodigy-kubegraf-app/page/cluster-status?clusterName=k3d"
t=2020-02-13T10:46:20+0000 lvl=info msg=Requesting logger=data-proxy-log url=https://172.18.0.2:8443/api/v1/nodes
2020/02/13 10:46:20 http: proxy error: dial tcp 172.18.0.2:8443: connect: connection refused
t=2020-02-13T10:46:20+0000 lvl=info msg="Request Completed" logger=context userId=1 orgId=1 uname=admin method=GET path=/api/datasources/proxy/3/__proxy/api/v1/nodes status=502 remote_addr=10.42.0.10 time_ms=19 size=0 referer="http://grafana.localhost/plugins/devopsprodigy-kubegraf-app/page/cluster-status?clusterName=k3d"
2020/02/13 10:46:20 http: proxy error: dial tcp: lookup prometheus-1581525036-server.monitoring.svc.cluster.local: no such host
2020/02/13 10:46:20 http: proxy error: dial tcp: lookup prometheus-1581525036-server.monitoring.svc.cluster.local: no such host
t=2020-02-13T10:46:20+0000 lvl=info msg="Request Completed" logger=context userId=1 orgId=1 uname=admin method=GET path=/api/datasources/proxy/1/api/v1/query_range status=502 remote_addr=10.42.0.10 time_ms=1 size=0 referer="http://grafana.localhost/plugins/devopsprodigy-kubegraf-app/page/cluster-status?clusterName=k3d"
t=2020-02-13T10:46:20+0000 lvl=info msg="Request Completed" logger=context userId=1 orgId=1 uname=admin method=GET path=/api/datasources/proxy/1/api/v1/query_range status=502 remote_addr=10.42.0.10 time_ms=1 size=0 referer="http://grafana.localhost/plugins/devopsprodigy-kubegraf-app/page/cluster-status?clusterName=k3d"
2020/02/13 10:46:20 http: proxy error: dial tcp: lookup prometheus-1581525036-server.monitoring.svc.cluster.local: no such host
t=2020-02-13T10:46:20+0000 lvl=info msg="Request Completed" logger=context userId=1 orgId=1 uname=admin method=GET path=/api/datasources/proxy/1/api/v1/query_range status=502 remote_addr=10.42.0.10 time_ms=1 size=0 referer="http://grafana.localhost/plugins/devopsprodigy-kubegraf-app/page/cluster-status?clusterName=k3d"
2020/02/13 10:46:20 http: proxy error: dial tcp: lookup prometheus-1581525036-server.monitoring.svc.cluster.local: no such host
2020/02/13 10:46:20 http: proxy error: dial tcp: lookup prometheus-1581525036-server.monitoring.svc.cluster.local: no such host
t=2020-02-13T10:46:20+0000 lvl=info msg="Request Completed" logger=context userId=1 orgId=1 uname=admin method=GET path=/api/datasources/proxy/1/api/v1/query_range status=502 remote_addr=10.42.0.10 time_ms=1 size=0 referer="http://grafana.localhost/plugins/devopsprodigy-kubegraf-app/page/cluster-status?clusterName=k3d"
t=2020-02-13T10:46:20+0000 lvl=info msg="Request Completed" logger=context userId=1 orgId=1 uname=admin method=GET path=/api/datasources/proxy/1/api/v1/query_range status=502 remote_addr=10.42.0.10 time_ms=1 size=0 referer="http://grafana.localhost/plugins/devopsprodigy-kubegraf-app/page/cluster-status?clusterName=k3d"
t=2020-02-13T10:47:20+0000 lvl=info msg=Requesting logger=data-proxy-log url=https://172.18.0.2:8443/api/v1/pods
2020/02/13 10:47:20 http: proxy error: dial tcp 172.18.0.2:8443: connect: connection refused
t=2020-02-13T10:47:20+0000 lvl=info msg="Request Completed" logger=context userId=1 orgId=1 uname=admin method=GET path=/api/datasources/proxy/3/__proxy/api/v1/pods status=502 remote_addr=10.42.0.10 time_ms=21 size=0 referer="http://grafana.localhost/plugins/devopsprodigy-kubegraf-app/page/cluster-config?clusterId=3"
t=2020-02-13T10:47:21+0000 lvl=info msg=Requesting logger=data-proxy-log url=https://172.18.0.2:8443/api/v1/componentstatuses
2020/02/13 10:47:21 http: proxy error: dial tcp 172.18.0.2:8443: connect: connection refused
t=2020-02-13T10:47:21+0000 lvl=info msg="Request Completed" logger=context userId=1 orgId=1 uname=admin method=GET path=/api/datasources/proxy/3/__proxy/api/v1/componentstatuses status=502 remote_addr=10.42.0.10 time_ms=10 size=0 referer="http://grafana.localhost/plugins/devopsprodigy-kubegraf-app/page/cluster-config?clusterId=3"
t=2020-02-13T10:47:22+0000 lvl=info msg=Requesting logger=data-proxy-log url=https://172.18.0.2:8443/api/v1/nodes
2020/02/13 10:47:22 http: proxy error: dial tcp 172.18.0.2:8443: connect: connection refused
t=2020-02-13T10:47:22+0000 lvl=info msg="Request Completed" logger=context userId=1 orgId=1 uname=admin method=GET path=/api/datasources/proxy/3/__proxy/api/v1/nodes status=502 remote_addr=10.42.0.10 time_ms=12 size=0 referer="http://grafana.localhost/plugins/devopsprodigy-kubegraf-app/page/cluster-config?clusterId=3"
Hi,
I'm using Grafana v5.0.4 (commit: 7dc36ae) and kubegraf 1.1.0
When defining my cluster, I see the new "Bearer token access" label but ... nothing more (no checkbox):
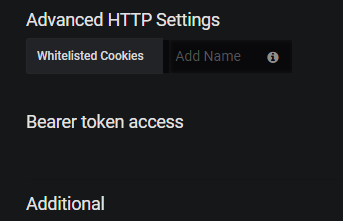

Is there anything special to fill and/or configure to make the "Access via token" checkbox accessible? Feeling that I'm missing something obvious...
Thanks a lot!
JYC
The manifests for ServiceAccount and Secret do not have a namespace defined, making the install instructions incomplete
Since the ClusterRoleBinding binds to the ServceAccount grafana-kubegraf in Namespace default, this namespace should be set in the ServiceAccount resource, probably the same for the Secret resource
My kubeconfig is set to use the kube-system namespace by default
CPU usage by pod panel has the following query:
sum(rate(container_cpu_usage_seconds_total{namespace="$namespace", pod_name=~"$pod"}[1m])) by (pod_name)
When I test the query in the prometheus ui:
(sum by(pod_name) (rate(container_cpu_usage_seconds_total{pod_name="TEST_POD",image!=""}[5m])) * 100)
get result:
{pod_name="TEST_POD"} 43.88829601597685
the same query without sum:
rate(container_cpu_usage_seconds_total{ pod_name="TEST_POD"}[5m])
container_cpu_usage_seconds_total{container="POD",container_name="POD",cpu="total",endpoint="https-metrics",id="/kubepods/burstable/pod937131a1-436b-11ea-9b9c-0ad04b43bf50/6865ecb90d75a7ae9316e9a131c5a9447714cff5333994c512773d4a64621fe9",image="602401143452.dkr.ecr.ap-southeast-2.amazonaws.com/eks/pause-amd64:3.1",instance="10.50.50.63:10250",job="kubelet",name="k8s_POD_TEST_POD_default_937131a1-436b-11ea-9b9c-0ad04b43bf50_0",namespace="default",node="ip-10-50-50-63.ap-southeast-2.compute.internal",pod="TEST_POD",pod_name="TEST_POD",service="prometheus-operator-kubelet"}	0.01538971

container_cpu_usage_seconds_total{container="couchbase-server",container_name="couchbase-server",cpu="total",endpoint="https-metrics",id="/kubepods/burstable/pod937131a1-436b-11ea-9b9c-0ad04b43bf50/fa9326b7237f447ab499b1d7363b537aa06c97174eb874643d5bb236a1e9c41f",image="sha256:fbaae96e8d377ee42762082d5ed9113afef0177f8b848b29b161c699d8447bfc",instance="10.50.50.63:10250",job="kubelet",name="k8s_couchbase-server_TEST_POD_default_937131a1-436b-11ea-9b9c-0ad04b43bf50_0",namespace="default",node="ip-10-50-50-63.ap-southeast-2.compute.internal",pod="TEST_POD",pod_name="TEST_POD",service="prometheus-operator-kubelet"}	255391.764905599

container_cpu_usage_seconds_total{cpu="total",endpoint="https-metrics",id="/kubepods/burstable/pod937131a1-436b-11ea-9b9c-0ad04b43bf50",instance="10.50.50.63:10250",job="kubelet",namespace="default",node="ip-10-50-50-63.ap-southeast-2.compute.internal",pod="TEST_POD",pod_name="TEST_POD",service="prometheus-operator-kubelet"}  255394.456398121
Not sure what does the last line container_cpu_usage_seconds_total{cpu="total"... mean, but looks like the query should be changed similar to mem usage:
sum(rate(container_cpu_usage_seconds_total{namespace="$namespace", pod_name=~"$pod",container_name!="", container_name!="POD"}[1m])) by (pod_name)
P.S. the same for the CPU node usage
After upgrade from v1.4.2 to v1.5.0.4 only users with role Admin see the Clusters list.
In 1.4.2 also users with Editor and Viewer see the Clusters list.
It would be nice to bring back the possibility to view Clusters list for regular users.
Kubegraf: 1.5.0.4
Grafana: 6.5.3

Please add the ability to use not only prometheus on target clusters as a data source, but also prometheus federation
Kubegraf 1.5.1 is currently referencing metrics which kube-state-metrics has removed. This breaks the Node Dashboard's graph.
Here is a link showing the depreciated metrics:
https://github.com/kubernetes/kube-state-metrics/blob/master/CHANGELOG.md
These metrics are no longer valid after kube-state-metrics v2.0.0-alpha
kube_node_status_capacity_pods
kube_node_status_capacity_cpu_cores
kube_node_status_capacity_memory_bytes
kube_node_status_allocatable_pods
kube_node_status_allocatable_cpu_cores
kube_node_status_allocatable_memory_bytes
kube_pod_container_resource_requests_cpu_cores
kube_pod_container_resource_limits_cpu_cores
kube_pod_container_resource_requests_memory_bytes
kube_pod_container_resource_limits_memory_bytes
Here are some screenshots for a visual:
Node Dashboard:

Grafana query for the Node Dashboard:

List of removed kube-state-metrics, metrics:

How do I build this project?
I cloned and did "yarn install", then "npm run dev", I get:
Running "typescript:build" (typescript) task
>> dist/components/k8s-page.ts(979,44): error TS1005: '=' expected.
>> dist/components/k8s-page.ts(979,66): error TS1005: ',' expected.
>> dist/components/k8s-page.ts(979,68): error TS1138: Parameter declaration expected.
>> dist/components/k8s-page.ts(979,79): error TS1005: ';' expected.
>> dist/components/k8s-page.ts(979,80): error TS1068: Unexpected token. A constructor, method, accessor, or property was expected.
>> dist/components/k8s-page.ts(983,34): error TS1005: ',' expected.
>> dist/components/k8s-page.ts(983,75): error TS1005: ',' expected.
>> dist/components/k8s-page.ts(983,92): error TS1005: ';' expected.
>> dist/components/k8s-page.ts(987,32): error TS1005: ',' expected.
>> dist/components/k8s-page.ts(987,62): error TS1005: ';' expected.
>> dist/components/k8s-page.ts(991,26): error TS1005: ';' expected.
>> dist/components/k8s-page.ts(995,17): error TS1005: ';' expected.
>> dist/components/k8s-page.ts(1005,21): error TS1005: ',' expected.
>> dist/components/k8s-page.ts(1005,28): error TS1005: ';' expected.
>> dist/components/k8s-page.ts(1009,18): error TS1005: ';' expected.
>> dist/components/k8s-page.ts(1012,1): error TS1128: Declaration or statement expected.
Warning: Task "typescript:build" failed. Use --force to continue.
here:
    getAlertsNodesByCPU(status: 'cpuStatus'|'cpuStatusRequested' = 'cpuStatus'){
        return this.nodesMap.filter(item => item[status] === WARNING || item[status] === ERROR);
    }
I don't know what this type declaration means, so I substitute the type to string, then I get this:
Running "typescript:build" (typescript) task
>> dist/common/helpers.ts(4,17): error TS2307: Cannot find module 'grafana/app/core/utils/kbn'.
>> dist/components/cluster-config/cluster-config.ts(2,23): error TS2307: Cannot find module 'grafana/app/core/app_events'.
>> dist/components/cluster-config/cluster-config.ts(22,27): error TS2339: Property 'finally' does not exist on type 'Promise<void>'.
>> dist/components/cluster-config/cluster-config.ts(28,5): error TS1311: Async functions are only available when targeting ECMAScript 6 and higher.
>> dist/components/cluster-config/cluster-config.ts(28,5): error TS1236: Experimental support for async functions is a feature that is subject
to change in a future release. Specify '--experimentalAsyncFunctions' to remove this warning.
>> dist/components/clusters-list/clusters-list.ts(2,23): error TS2307: Cannot find module 'grafana/app/core/app_events'.
>> dist/components/k8s-page.ts(2,23): error TS2307: Cannot find module 'grafana/app/core/app_events'.
>> dist/components/k8s-page.ts(91,5): error TS1311: Async functions are only available when targeting ECMAScript 6 and higher.
>> dist/components/k8s-page.ts(91,5): error TS1236: Experimental support for async functions is a feature that is subject to change in a future release. Specify '--experimentalAsyncFunctions' to remove this warning.
>> dist/components/nodes-overview/nodes-overview.ts(45,9): error TS4091: Loop contains block-scoped variable 'node' referenced by a function in the loop. This is only supported in ECMAScript 6 or higher.
>> dist/datasource/datasource.ts(2,23): error TS2307: Cannot find module 'grafana/app/core/app_events'.
>> dist/module.ts(9,29): error TS2307: Cannot find module 'grafana/app/plugins/sdk'.
Warning: Task "typescript:build" failed. Use --force to continue.
How do I build it?
Hi @SergeiSporyshev
How can we restrict plugin access for viewer role?
Only Admin should be able to see the plugin data.
If you follow your instructions and do:
grafana-cli plugins install devopsprodigy-kubegraf-app
You end up with v1.1.1 of the plugin, which is the latest version hosted on grafana.com. Are there any plans to keep that repo up to date with your latest releases?
I actually use the Grafana Helm chart method, where you can just do this
plugins:
  - devopsprodigy-kubegraf-app
but this has the same effect and only installs the latest version hosted in https://grafana.com/api/plugins/devopsprodigy-kubegraf-app/versions
Hello, I got a permission error after adding the cluster. What should I do?

Hi,
we're using kubegraf version 1.4.2. It was working fine but since we've upgraded Kubernetes to version 1.18.X, the Applications Overview page is partly broken. The controller-manager and scheduler are marked as down but both are running fine. The error messages are Get http://127.0.0.1:10251/healthz: dial tcp 127.0.0.1:10251: connect: connection refused/Get http://127.0.0.1:10252/healthz: dial tcp 127.0.0.1:10252: connect: connection refused
The reason for that is that the componentstatus view is deprecated (as described here) and the urls for the mentioned components have changed to secure ports.
controller-manager (see here):
scheduler (see here):
Would be great if this could be fixed.
Thank you.
Hi,
not sure if this was already reported - I searched the issues but couldn't find anything.
with kube-state-metrics v2.0.0 it seems they changed how resource limits and requests values are queried.
The following metrics were removed if I saw that correctly:
kube_pod_container_resource_limits/requests_cpu_corekube_pod_container_resource_limits/requests_memory_bytesInstead they now have
kube_pod_container_resource_limits/requestswhere you can query the values via labels e.g. ...{resource="memory"}
The panels "Memory Usage" and "CPU usage" have to be updated. I tried with following for example for the "Memory Usage"-panel on the "Deployment's Dashboard"
sum (kube_pod_container_resource_requests_memory_bytes{ namespace="$namespace", pod=~"$pod", container=~"$container"}) by (pod, container) or sum (kube_pod_container_resource_requests{ namespace="$namespace", pod=~"$pod", container=~"$container", resource="memory"}) by (pod, container)
The ca/bearer token works for EKS, however, I'm not sure what minimum permissions to assign to the service account that corresponds to the bearer token. the service account assigned to my grafana pod has the following permissions:
rules:
  - verbs:
      - use
    apiGroups:
      - extensions
    resources:
      - podsecuritypolicies
    resourceNames:
      - grafana
Currently there is a new ServiceAccount and a Secret deployed. Kubernetes creates a Secret automatically for ServiceAccounts so the additional secret isn't required.
I suspect the secret is added to have a defined name, making install instructions easier. I propose to delete the additional secret and use this command to get the token:
kubectl get secret $(kubectl get sa grafana-kubegraf -o go-template='{{ (index .secrets 0).name }}') -o go-template='{{ .data.token | base64decode }}'
This retrieves the name of the first (and then only) secret for the serviceaccount and then retrieves and decoded the token from the secret
The token in it also does not seem to work in my cluster, not sure why but happy to help with debugging
Hi,
I saw today that there is a new release and immediately tried it - thanks for the quick fix btw. I removed the old plugin-folder (v1.4.2) and added the new one. Dashboards working fine, but still it seems that something is broken.
If I click (while logged in with my grafana-account) on the Plugin-Icon and choose "Clusters" I see our configured clusters and can go through all the dashboards*. But if I choose "Plugin Config" - there seems that no clusters are configured. Also if I recreate a cluster-config with a new name it won't show up in there - shouldn't it?
*I had to change the regex of the pod-variable in dashboards where it is used, from /pod(?:_name)?=\"(.+?)\"/ to /pod?=\"(.+?)\"/
Should be great add metrics about volumes used by pods, in particular on statefulsets dashboard (volume name, size, %used, I/O, etc)
I have configured kube-metric-exporter, thoough the metrics are seems to be empty from prometheus.

Hi,
we had a case where kubegraf panels that show pod/container memory usage should have triggered the autoscale or OOMKILL. None of them happened. We looked to the docker container memory usage and it was like 2 times lower, the we also looked kubectl data about the same and this was pretty similar to docker values ( it all depends what is the period and samples in period that are "compressed" to one sample max, min,, avg, current ).
Since we , and many others we have asked , were thinking that the memory usage on memory panel is showing the so called real time current usage then actually after doing some digging and deep dive to different metrics that prom is using and by what
kubernetes triggers the killing and scaling are different.
The one , that is used in KubeGraf is the "all-in-one" memory usage that also contains cached data which is not the current usage.
So my suggestion is that to have more accurate data with kubernetes container lifecycle we should change the container_memory_usage_bytes :
a) calculation method from sum to avg/max
b) use metric container_memory_working_set_bytes instead of container_memory_usage_bytes which is more accurate to indicate current usage without cache
c) add another measurement to the panel that shows also the all-in-one value as Usage+cache
Dashboards that are related:
Pods dashboard memory panel
Deployments Dashboard memory panel
Daemonsets Dashboard memory panel
StatefulSets Dashboard memory panel
Node dashboard has way better explanation about the measurement and is more clear what is what.
Nodes Overview has a correct data. But there is problem withnode Pods count - 2 times bigger then reality.
more detailed explanation can be found from here :
https://blog.freshtracks.io/a-deep-dive-into-kubernetes-metrics-part-3-container-resource-metrics-361c5ee46e66
We were just really struggling to understand why it is not triggering OOMkill cause by panel stats it should.
When our expectations about memory usage on the panel were wrong compared to the common understating and expectations on memory usage then we were just wrong.
Hello,
I deployed Prometheus + node-exporter + kube-state-metrics and followed the instructions but dashboards are not populating. I can see some metrics in the plugin itself like cluster status, node and applications overview.
Is there some additional configuration I need to do to point prometheus to node-exporter / kube-state-metrics?
Regards,
Ronald
In the Kubernetes 1.16 were removed cadvisor metric labels pod_name and container_name to match instrumentation guidelines. Instead of these removed labels should be used labels pod and container in Prometheus queries.
Kubernetes changelog for 1.16: https://github.com/kubernetes/kubernetes/blob/master/CHANGELOG-1.16.md#removed-metrics
All dashboards are affected (except DevOpsProdigy KubeGraf Node's Dashboard) because many graphs uses old metric labels (which doesn't exist in Kubernetes 1.16 anymore).
Old metric labels are also used in dashboard's variables (dashboard settings -> variables). It's case of daemonset's, deployment's and statefulset's dashboards.
One example for graph and on for dashboard's variable.
in DevOpsProdigy KubeGraf Pod's Dashboard in Memory usage graph:
sum (container_memory_usage_bytes{namespace="$namespace", pod_name="$pod", container_name!="", container_name!="POD", container_name=~"$containers"})
above query doesn't work in Kubernetes 1.16 and it should be changed to:
sum (container_memory_usage_bytes{namespace="$namespace", pod="$pod", container!="", container!="POD", container=~"$containers"})
in DevOpsProdigy KubeGraf Deployment's Dashboard there is variable container defined by this query:
label_values(container_memory_usage_bytes{namespace="$namespace", pod_name=~"$deployment-.*", container_name!="", container_name!="POD"}, container_name)
for Kubernetes 1.16, it should be:
label_values(container_memory_usage_bytes{namespace="$namespace", pod=~"$deployment-.*", container!="", container!="POD"}, container)
As far as I know metrics in Kubernetes 1.15 contains both labels - old with _name suffix and new without it.
e. g. container_memory_usage_bytes from Kubernetes 1.15
container_memory_usage_bytes{beta_kubernetes_io_arch="amd64",beta_kubernetes_io_os="linux",container="k8s-debug",container_name="k8s-debug",id="redacted",image="redacted",instance="kubetest1n1",job="kubernetes-nodes-cadvisor",kubernetes_io_arch="amd64",kubernetes_io_hostname="kubetest1n1",kubernetes_io_os="linux",name="k8s_k8s-debug_k8s-debug-569c558c57-vzrwc_k8s-debug_51ab9c13-4a3a-499c-a84b-dbec19dfd6ae_0",namespace="k8s-debug",node="kubetest1n1",pod="k8s-debug-569c558c57-vzrwc",pod_name="k8s-debug-569c558c57-vzrwc"}
It should be possible easily change label names in Prometheus queries and Dashboards should work for both Kubernetes versions 1.15. and 1.16. I didn't test other versions, but it should also works for newer versions.
Any plans to add yaml and docs about how to deploy it to kubernetes?
Hi,
Can i just grab the dashboard rather than the all plugin ? What do i gain in getting the plugin over simply the dashboard ?
A declarative, efficient, and flexible JavaScript library for building user interfaces.
🖖 Vue.js is a progressive, incrementally-adoptable JavaScript framework for building UI on the web.
TypeScript is a superset of JavaScript that compiles to clean JavaScript output.
An Open Source Machine Learning Framework for Everyone
The Web framework for perfectionists with deadlines.
A PHP framework for web artisans
Bring data to life with SVG, Canvas and HTML. 📊📈🎉
JavaScript (JS) is a lightweight interpreted programming language with first-class functions.
Some thing interesting about web. New door for the world.
A server is a program made to process requests and deliver data to clients.
Machine learning is a way of modeling and interpreting data that allows a piece of software to respond intelligently.
Some thing interesting about visualization, use data art
Some thing interesting about game, make everyone happy.
We are working to build community through open source technology. NB: members must have two-factor auth.
Open source projects and samples from Microsoft.
Google ❤️ Open Source for everyone.
Alibaba Open Source for everyone
Data-Driven Documents codes.
China tencent open source team.
