flant / grafana-statusmap Goto Github PK
View Code? Open in Web Editor NEWGrafana panel plugin to visualize status of multiple objects over time
License: MIT License
Grafana panel plugin to visualize status of multiple objects over time
License: MIT License


![dependabot[bot] avatar](https://avatars.githubusercontent.com/in/29110?v=4 "dependabot[bot]")


Newly added rows only displayed on the panel after reload.
Problem:
Prometheus returns good data for queries similar to that described in README. Data has timestamps for each interval and timestamps are equal.
Other sources or different Prometheus queries can contain holes or inconsistent timestamps. Plugin is not render this data correctly.

Related problem: #33 (comment)
Hi,
Our influxdb response has about 500k of response data, see attached influxdb-response_02.json.
influxdb-response_02.zip
The majority of the influx response is nulls, but I don't have a clue how to make this work without them. Any suggestions? There are about 130 rows in my status map.
I tried this in both chrome (v74 / windows) and IE (11.1087.16299.0CO ) and the results are about the same.
The retrieval of the influx response is sub second -- certainly acceptable.
but
Attached is a saved chrome profile session
Profile-20190513T141245_b.zip
--Erik
Initial state of the panel:
Panel after 1 hour:

It would be amazing if we could click the cells and redirect to any URL, basically support drill-down.
Use case: I have some cells with different colors and would like to see more details about a red cell.
Are there any plans to include this?
Thanks for the plugin.
Завезти возможность выбора цветов для legend format
Just updated after this issue #40, PR #48
Error actual only for IE 11.
TypeError: Unable to get property 'removeChild' of undefined or null reference
at Anonymous function (eval code:90:7)
at nt.prototype.each (http://stats.afm.renault.ru/public/build/vendor.469095018b321ef1da7c.js:35:151122)
at drawDiscreteColorLegend (eval code:85:5)
at render (eval code:403:19)
at Anonymous function (eval code:384:15)
at s.prototype.emit (http://stats.afm.renault.ru/public/build/vendor.469095018b321ef1da7c.js:86:11785)
at t.prototype.emit (http://stats.afm.renault.ru/public/build/app.469095018b321ef1da7c.js:1:181430)
at t.prototype.render (http://stats.afm.renault.ru/public/build/app.469095018b321ef1da7c.js:22:477825)
at _this.onDataReceived (eval code:176:13)
at s.prototype.emit (http://stats.afm.renault.ru/public/build/vendor.469095018b321ef1da7c.js:86:11348)

Bug in spectrum and discrete modes. Nulls should be displayed with color for 0, not with black.

The tooltip sometimes does not display the correct value for series name. For example, the status map below just shows count of data per hour from a table for three separate series (V002, V006 and V009). The tooltip displays "V009" for data from V006:
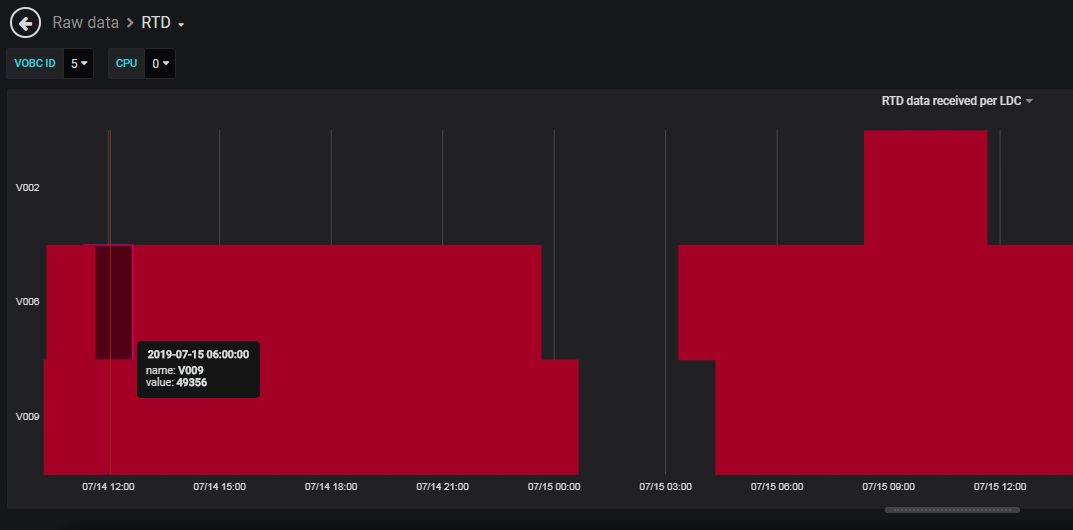
For some of the V009 series, no tooltip is displayed at all:

Statusmap version: 0.1.1
Grafana version: 6.2.0
Data source: Clickhouse
Query:

Hey
Just discovered this plugin and it looks really promising. I've played about with the panel and got it working fine but I was wondering if there was a way to enchance the tooltip to show more information for each value.
Specifically I'm wondering if there's a way to use a label value in each tooltip like Grafana allows with labels. So if I set the tooltip to {{server}} up it would show each value for the server label in the tooltip.
Is something like this possible?
Cheers,
R.
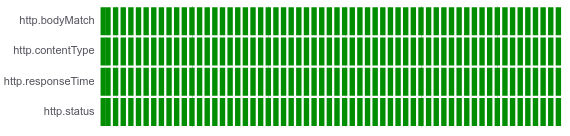
This is how I am looking to show in statusmap, but logical operator is not working.

We really like the statusmap panel to display various states over time but we miss the ability to display Grafana annotations, e.g. to visualize when deployments happened.
Many thanks for the plugin.
Getting this error in IE 11.
Same graph
IE 11:
Chrome:
TypeError: Object doesn't support property or method 'remove'
at Anonymous function (eval code:90:7)
at nt.prototype.each (http://stats.afm.renault.ru/public/build/vendor.469095018b321ef1da7c.js:35:151122)
at drawDiscreteColorLegend (eval code:85:5)
at render (eval code:403:19)
at Anonymous function (eval code:384:15)
at s.prototype.emit (http://stats.afm.renault.ru/public/build/vendor.469095018b321ef1da7c.js:86:11785)
at t.prototype.emit (http://stats.afm.renault.ru/public/build/app.469095018b321ef1da7c.js:1:181430)
at t.prototype.render (http://stats.afm.renault.ru/public/build/app.469095018b321ef1da7c.js:22:477825)
at _this.onDataReceived (eval code:176:13)
at s.prototype.emit (http://stats.afm.renault.ru/public/build/vendor.469095018b321ef1da7c.js:86:11348)
H spacing = 0 not displayed as one solid line. There is 0.5px spacing or something like that because of float calculations.
Fixed width of Y-legend for better readability of multiple graphs. Currently width of Y-legend is depended on labels length and so can vary between graphs.
At the moment colors for legend and buckets are spread over continuous range from min to max for opacity and gradient modes but discrete mode is "one value one color" mapping. Plugin should spread opacity or gradient colors over discrete range from 1 to count of unique values (spread by index). User should be able to copy these calculated colors into discrete mode mapping for further tweaking.
Old behavior can be enabled with a dropdown ["spread by value (as heatmap)", "spread by index (statusmap)"].
Example:
User enters some queries on metrics tab.

The data has these unique values: 3, 5, 10, 21 and 45. Spectrum mode with GnYlRd theme should calculate 5 colors: red for 3, orange for 5, yellow for 10, bright green for 21 and green for 45.

Spread by value calculates almost identical reds for 3 and 5:

Due to a lack of time and workforce, there are no strict dates for milestones. The development will be done in short sprints (each is 3-4 months long).
Please feel free to comment issues, PRs are also very welcome!
Milestone: https://github.com/flant/grafana-statusmap/milestone/5
Milestone: https://github.com/flant/grafana-statusmap/milestone/6
Milestone: https://github.com/flant/grafana-statusmap/milestone/7
Is anyone successfully using this with grafana 5.4.2 or later ?

angular.js:14700 TypeError: Cannot read property 'color' of null
    at ColorModeDiscrete.getBucketColor (color_mode_discrete.js:70)
    at SVGRectElement.getCardColor (rendering.js:432)
    at SVGRectElement.<anonymous> (style.js:17)
    at tt.each (each.js:5)
    at tt.style (style.js:25)
    at addHeatmap (rendering.js:295)
    at render (rendering.js:619)
    at s.eval (rendering.js:53)
    at s.emit (index.js:150)
    at t.emit (app.518c6d1c99cd647e899f.js:1) "Possibly unhandled rejection: {}"
Steps to reproduce:
I tried using it against SQL Server data source but not sure how it would render the columns. it would be great to add SQL Server as one of the data source and also please include an example on how to use it with SQL Server.
This would be a great panel to track SQL jobs with multiple servers. thanks
It would be great to have a color scheme that makes fonts more readable with the dark theme.
Two places in particular: the legend and when hovering tiles.

query_range?query=... returns
{"status":"success","data":{"resultType":"matrix","result":[]}}
Graph shows No data points and errors are stacked in js Console on hovering:
Error: <g> attribute transform: Expected number, "translate(NaN,0)".
Do you consider to add some kind of sorting for labels for buckets in the Y axe?
Prometheus is not going to implement any kind of sort_by_lable function looks like - prometheus/prometheus#414
also maybe related in grafana - grafana/grafana#13325
We have this picture currently:

Thank you for this panel! - it helps a lot in cases even not related with statuses because of its ability to show concrete value in the predefined bucket.
And of course this panel is must have for statuses over time - for example statuses of cisco interfaces. (our widely used case)
grafana-statusmap version 0.1.1
Grafana v6.1.6 (commit: cf9cb45)
Datasource: Zabbix API 4.2.1

4 hosts
4 boolean metrics
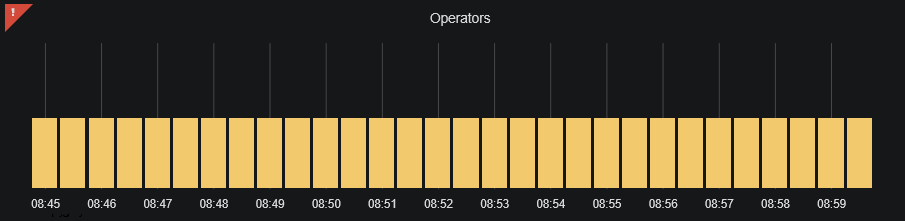
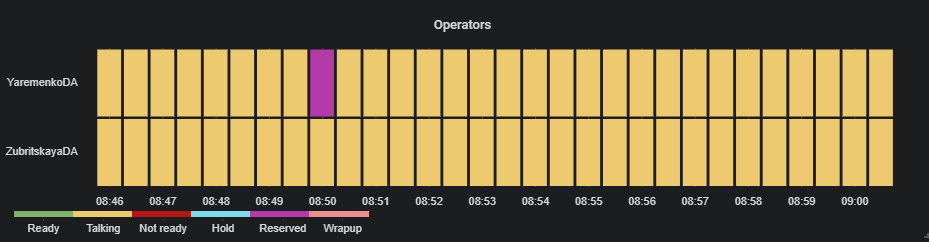
Tooltip is okay if there is enough data in the range

But if I select the range with nodata period, it brokes:
(value should be 1)

(no tooltip at all)

Settings

Shared crosshair is supported, but shared tooltip is displayed only for current graph.
Hey, I tried to build the plugin but got the following warning
Running "babel:dist" (babel) task Warning: Requires Babel "^7.0.0-0", but was loaded with "6.26.3". I already replaced "babel": "6.23.0", with "@babel/core": "^7.4.5", on package.json but no success.
Perhaps you know how to make it work again?
Hello.
After upgrading to grafana 6.2.3 graph stopped updating on autorefresh. Tested on versions of panel versions 0.0.3 and 0.1.1.

Сделать отдельный спейсинг по вертикали и горизонтали.
Чтобы при желании можно было превратить квадратики в полосы но между полосами было расстояние :)
Thanks for the interesting plugin.
I would also like to use it, but as datasource i have influxdb.
Is there a chance that influxdb will be supported?
Hi,
I'm sure this isn't a bug, thanks in advance for any help.
First of all, statusmap is very cool -- I'm most of the way to displaying a very nice timeline for our batch process using status map. One of the main goals is to show where parallel processing is/isn't used. This is the only grafana plugin I've found that can do that.
However, there there are some extra "features" showing up on my statusmap that I'd like to remove. Suggestions for how to 'remove' these things?
dump of all data, about 5k, from influx
Here is an example of one data point I'm sending to influx:
batch_times,batchEnv=FOO_DEV,step=S_04_SERIAL_B_@BATCH,batchEndDate=2019-02-10,S_04_SERIAL_B_@BATCH=400 value=400 1556741570000000000

What is wrong?
What to do?
Grafana v5.4.2 (d812109)
Statusmap v0.0.4
Datasource: InfluxDB v1.7.2
Measurement: win_system (from telegraf plugin - win_perf_counters)
Field: System_Up_Time
SELECT mean("System_Up_Time") FROM "10seconds"."win_system" WHERE $timeFilter GROUP BY time(1m), "host" fill(null)
{
  "type": "flant-statusmap-panel",
  "title": "Panel Title",
  "gridPos": {
    "x": 0,
    "y": 0,
    "w": 12,
    "h": 9
  },
  "id": 2,
  "datasource": "InfluxDB",
  "targets": [
    {
      "policy": "10seconds",
      "resultFormat": "time_series",
      "orderByTime": "ASC",
      "tags": [],
      "groupBy": [
        {
          "type": "time",
          "params": [
            "1m"
          ]
        },
        {
          "type": "tag",
          "params": [
            "host"
          ]
        },
        {
          "type": "fill",
          "params": [
            "null"
          ]
        }
      ],
      "select": [
        [
          {
            "type": "field",
            "params": [
              "System_Up_Time"
            ]
          },
          {
            "type": "mean",
            "params": []
          }
        ]
      ],
      "refId": "A",
      "measurement": "win_system",
      "alias": "$tag_host",
      "query": "SELECT mean(\"System_Up_Time\") FROM \"10seconds\".\"win_system\" WHERE $timeFilter GROUP BY time(1m), \"host\" fill(null)",
      "rawQuery": false
    }
  ],
  "color": {
    "mode": "spectrum",
    "cardColor": "#b4ff00",
    "colorScale": "sqrt",
    "exponent": 0.5,
    "colorScheme": "interpolateGnYlRd",
    "defaultColor": "#757575",
    "thresholds": []
  },
  "cards": {
    "cardMinWidth": 5,
    "cardVSpacing": 2,
    "cardHSpacing": 2,
    "cardRound": null
  },
  "xAxis": {
    "show": true,
    "showWeekends": true,
    "minBucketWidthToShowWeekends": 4,
    "showCrosshair": true,
    "labelFormat": "%a %m/%d"
  },
  "yAxis": {
    "show": true,
    "showCrosshair": false
  },
  "tooltip": {
    "show": true
  },
  "legend": {
    "show": true
  },
  "data": {
    "unitFormat": "short",
    "decimals": null
  },
  "nullPointMode": "as empty",
  "yAxisSort": "metrics",
  "highlightCards": true,
  "useMax": true
}
Hey boys, i am trying to use this beatiful plugin with my custom datasource, but i am getting this error :
TypeError : cannot read property 'then' of undefined,
status_heatmap_ctrl.js:211:60, function issueQueries.
Is there a way to avoid that? all other plugins perfectrly working with this datasource :C Should i implement something in it?
I am using grafana 5.3.0. Also i was tring to implement annotation methods in datasource and settting annotations to true in plugin.json of datasource, but that doesn't change anything :/
Continue of #35.
alert: true/) to split target name into hierarchy levelsAssume there are metrics with these names:
Hierarchical list should displayed like this:
main_office...| [] [] []
    core......| [] [] []
        br0...| [] [] []
        eth0..| [] [] []
        eth1..| [] [] []
    wan.......| [] [] []
        eth0..| [] [] []
remote_alfa...| [] [] []
    eth0......| [] [] []
remote_bravo..| [] [] []
    eth0......| [] [] []
              +-----------
                12:30 13:00
Is it possible to integrate alerting into the dashboard. This dashboard is extensively used by us and is great for visualization but if alerting is also included, it would be even more better or is there a way to do it which I am missing?
Reproduce:
INFO[10-12|09:06:19] Rendering                                logger=png-renderer path="d/6PJB0E1ik/new-dashboard-copy?orgId=1"
EROR[10-12|09:07:19] Timeout error. You can set timeout in seconds with &timeout url parameter logger=context userId=1 orgId=1 uname=admin error="Timeout error. You can set timeout in seconds with &timeout url parameter"
EROR[10-12|09:07:19] Request Completed                        logger=context userId=1 orgId=1 uname=admin method=GET path=/render/d/6PJB0E1ik/new-dashboard-copy status=500 remote_addr=172.17.0.1 time_ms=60042 size=1763 referer=
Thanks korki!
Plugins from https://grafana.com/plugins can be installed at start with GF_INSTALL_PLUGINS="..."
grafana/grafana-plugin-repository#341
Waiting...

I was trying docker input plugin of telegraf.
in which the status code gives 0 if the container is alive and gives null value for dead containers.
currently, the dead containers are displayed empty/invisible on the graph
is there any way to mark them as red colours?
A declarative, efficient, and flexible JavaScript library for building user interfaces.
🖖 Vue.js is a progressive, incrementally-adoptable JavaScript framework for building UI on the web.
TypeScript is a superset of JavaScript that compiles to clean JavaScript output.
An Open Source Machine Learning Framework for Everyone
The Web framework for perfectionists with deadlines.
A PHP framework for web artisans
Bring data to life with SVG, Canvas and HTML. 📊📈🎉
JavaScript (JS) is a lightweight interpreted programming language with first-class functions.
Some thing interesting about web. New door for the world.
A server is a program made to process requests and deliver data to clients.
Machine learning is a way of modeling and interpreting data that allows a piece of software to respond intelligently.
Some thing interesting about visualization, use data art
Some thing interesting about game, make everyone happy.
We are working to build community through open source technology. NB: members must have two-factor auth.
Open source projects and samples from Microsoft.
Google ❤️ Open Source for everyone.
Alibaba Open Source for everyone
Data-Driven Documents codes.
China tencent open source team.