Giter VIP home page Giter VIP logo

hvplot's Introduction


HoloViz: High-level tools to simplify visualization in Python

Test suite status Status
Site/Content version Github tag
Docs gh-pages site dev-site
Status Dashboard
Binder Binder
Code of Conduct Based on Contributor Covenant
Fiscal Sponsor Powered by NumFOCUS

What is HoloViz?

HoloViz provides high-level Python tools that are designed to work together to solve the entire problem of visualization, from conducting exploratory data analysis to deploying complex dashboards.

The core HoloViz projects are:

  • Panel: Create interactive dashboards in Jupyter notebooks or standalone apps
  • hvPlot: Quickly and interactively explore data with a familiar API
  • HoloViews: Visualize while you analyze by declaring data properties
  • GeoViews: Extend HoloViews for geographic data
  • Datashader: Render big data images in a browser
  • Lumen: Construct no-code dashboards from simple YAML specifications
  • Colorcet: Plot with perceptually based colormaps
  • Param: Declaratively code in Python
Panel Logo hvPlot Logo HoloViews Logo GeoViews Logo
Datashader Logo Lumen Logo Colorcet Logo Param Logo

All HoloViz projects are freely available for commercial or non-commercial use according to a permissive open-source license as described in each project's website.

HoloViz uses a custom open governance model and is fiscally sponsored by NumFOCUS. Consider making a tax-deductible donation to help the project pay for developer time, professional services, travel, workshops, and a variety of other needs.

NumFOCUS donation details

NumFOCUS is a 501(c)(3) non-profit charity in the United States; as such, donations to NumFOCUS are tax-deductible as allowed by law. As with any donation, you should consult with your personal tax adviser or the IRS about your particular tax situation.


What is the purpose of this specific repository?

This repository provides an entry point for the HoloViz ecosystem. The best way to experience this repository is on HoloViz.org.

This website provides:

  1. Introduction to the HoloViz organization and its projects
  2. Guidance for which HoloViz tools to start with given different use cases
  3. Demonstrations of using multiple HoloViz tools in a single workflow
  4. Communication channels and FAQ for HoloViz community members
  5. Governance, roadmap, and contributing guide for HoloViz developers

Getting Started

We recommend starting with holoviz.org/tutorial. If you already have a problem to solve that involves a particular data type, check out holoviz.org/background for guidance on which HoloViz tools to focus on.

hvplot's People

Contributors

ahuang11 avatar bikegeek avatar ceball avatar dogbunny avatar droumis avatar hoxbro avatar iuryt avatar jbednar avatar jlstevens avatar jordansamuels avatar jsignell avatar kebowen730 avatar kthyng avatar loicduffar avatar marcogorelli avatar marcskovmadsen avatar maximlt avatar michaelaye avatar mriduls avatar philippjfr avatar ppwadhwa avatar raybellwaves avatar sandervandenoord avatar slamer59 avatar sophiamyang avatar stefanbrand avatar timothy-w-hilton avatar toddrjen avatar toddrme2178 avatar tonyfast avatar

Stargazers

 avatar  avatar  avatar  avatar  avatar  avatar  avatar  avatar  avatar  avatar  avatar  avatar  avatar  avatar  avatar  avatar  avatar  avatar  avatar  avatar  avatar  avatar  avatar  avatar  avatar  avatar  avatar  avatar  avatar  avatar  avatar  avatar  avatar  avatar  avatar  avatar  avatar  avatar  avatar  avatar  avatar  avatar  avatar  avatar  avatar  avatar  avatar  avatar  avatar  avatar  avatar  avatar  avatar  avatar  avatar  avatar  avatar  avatar  avatar  avatar  avatar  avatar  avatar  avatar  avatar  avatar  avatar  avatar  avatar  avatar  avatar  avatar  avatar  avatar  avatar  avatar  avatar  avatar  avatar  avatar  avatar  avatar  avatar  avatar  avatar  avatar  avatar  avatar  avatar  avatar  avatar  avatar  avatar  avatar  avatar  avatar  avatar  avatar  avatar  avatar

Watchers

 avatar  avatar  avatar  avatar  avatar  avatar  avatar  avatar  avatar  avatar  avatar  avatar  avatar  avatar  avatar  avatar  avatar  avatar  avatar  avatar  avatar  avatar  avatar  avatar

hvplot's Issues

Bokeh window floating over jupyterlab window

Hi I am just starting with hvplot and it looks phenomenal.

I am however encountering a weird error:

When running it on jupyterlab the bokeh window 'floats' over the interface

(I am not sure how to add a screenshot of the issue...)

here is the code I use

import xarray as xr
import numpy as np
import hvplot.dask
import hvplot.xarray
import holoviews as hv

oxygen.o2.isel(time=10, st_ocean=10).hvplot()

where oxygen is this dataset:

<xarray.DataArray 'o2' (time: 36, st_ocean: 50, yt_ocean: 200, xt_ocean: 360)>
dask.array<shape=(36, 50, 200, 360), dtype=float32, chunksize=(1, 50, 200, 360)>
Coordinates:
    run           <U7 'control'
  * st_ocean      (st_ocean) float64 5.034 15.1 25.22 35.36 45.58 55.85 ...
  * xt_ocean      (xt_ocean) float64 -279.5 -278.5 -277.5 -276.5 -275.5 ...
  * yt_ocean      (yt_ocean) float64 -81.5 -80.5 -79.5 -78.5 -77.5 -76.5 ...
  * time          (time) datetime64[ns] 2181-01-16T12:00:00 2181-02-15 ...
    geolon_t      (yt_ocean, xt_ocean) float64 -279.5 -278.5 -277.5 -276.5 ...
    geolat_t      (yt_ocean, xt_ocean) float64 -81.5 -81.5 -81.5 -81.5 -81.5 ...
    area_t        (yt_ocean, xt_ocean) float64 1.828e+09 1.828e+09 1.828e+09 ...
    dxt           (yt_ocean, xt_ocean) float64 1.644e+04 1.644e+04 1.644e+04 ...
    dyt           (yt_ocean, xt_ocean) float64 1.112e+05 1.112e+05 1.112e+05 ...
    ht            (yt_ocean, xt_ocean) float64 0.0 0.0 0.0 0.0 0.0 0.0 0.0 ...
    kmt           (yt_ocean, xt_ocean) float64 0.0 0.0 0.0 0.0 0.0 0.0 0.0 ...
    wet_t         (yt_ocean, xt_ocean) float64 0.0 0.0 0.0 0.0 0.0 0.0 0.0 ...
    tmask         (yt_ocean, xt_ocean) float64 0.0 0.0 0.0 0.0 0.0 0.0 0.0 ...
    tmask_region  (yt_ocean, xt_ocean) float64 0.0 0.0 0.0 0.0 0.0 0.0 0.0 ...
Attributes:
    long_name:  Oxygen (mini)
    units:      mol/kg
hvplot.__version__

'0.2.1'

cannot perform histogram on time column

results in the following stacktrace

---------------------------------------------------------------------------
TypeError                                 Traceback (most recent call last)
<ipython-input-10-02b67fc4e6b3> in <module>()
----> 1 c.fuzz_udp.plot.hist()

/opt/conda/lib/python3.6/site-packages/holoplot/__init__.py in hist(self, y, by, **kwds)
    300             The HoloViews representation of the plot.
    301         """
--> 302         return self(kind='hist', x=None, y=y, by=by, **kwds)
    303 
    304     def kde(self, y=None, by=None, **kwds):

/opt/conda/lib/python3.6/site-packages/holoplot/__init__.py in __call__(self, x, y, kind, **kwds)
     81             self._data, x, y, kind=kind, **params
     82         )
---> 83         return converter(kind, x, y)
     84 
     85     def line(self, x=None, y=None, **kwds):

/opt/conda/lib/python3.6/site-packages/holoplot/converter.py in __call__(self, kind, x, y)
    520                 obj = DynamicMap(cbcallable, streams=[self.stream])
    521             else:
--> 522                 obj = method(x, y)
    523 
    524         if not (self.datashade or self.rasterize):

/opt/conda/lib/python3.6/site-packages/holoplot/converter.py in hist(self, x, y, data)
    760         hists = []
    761         for col in y:
--> 762             hist = histogram(ds, dimension=col, **hist_opts)
    763             ranges = {hist.kdims[0].name: self._dim_ranges['x'],
    764                       hist.vdims[0].name: self._dim_ranges['y']}

/opt/conda/lib/python3.6/site-packages/param/parameterized.py in __new__(class_, *args, **params)
   1889         inst = class_.instance()
   1890         inst._set_name(class_.__name__)
-> 1891         return inst.__call__(*args,**params)
   1892 
   1893     def __call__(self,*args,**kw):

/opt/conda/lib/python3.6/site-packages/holoviews/core/operation.py in __call__(self, element, **params)
    161                                 operation=self, kwargs=params)
    162         elif isinstance(element, ViewableElement):
--> 163             processed = self._apply(element)
    164         elif isinstance(element, DynamicMap):
    165             if any((not d.values) for d in element.kdims):

/opt/conda/lib/python3.6/site-packages/holoviews/core/operation.py in _apply(self, element, key)
    119         for hook in self._preprocess_hooks:
    120             kwargs.update(hook(self, element))
--> 121         ret = self._process(element, key)
    122         for hook in self._postprocess_hooks:
    123             ret = hook(self, ret, **kwargs)

/opt/conda/lib/python3.6/site-packages/holoviews/operation/element.py in _process(self, view, key)
    549             weights = None
    550 
--> 551         data = data[np.isfinite(data)]
    552         hist_range = self.p.bin_range or view.range(selected_dim)
    553         # Avoids range issues including zero bin range and empty bins

TypeError: ufunc 'isfinite' not supported for the input types, and the inputs could not be safely coerced to any supported types according to the casting rule ''safe'

Changing thickness of Datashaded plots

screen shot 2018-06-25 at 14 24 06

Is there any way to increase the thickness of the line?
When plots are datashaded with holoplot, can I pass in any additional options?
I used to control thickness with dynspread's threshold, can I do something similar with Holoplot?

DateTime indexes get reformatted with datashade and using `by='var'`

import pandas as pd
import numpy as np
import dask.dataframe as dd
import holoplot.dask
import holoplot.pandas

def generate_df(size):
    d = {
        'dates' : pd.date_range('1980-01-01', periods=size, freq='1T'),
        'unique_id' : np.arange(0, size),
        'ints' : np.random.randint(0, size, size=size),
        'floats' : np.random.randn(size),
        'bools' : np.random.choice([0, 1], size=size),
        'int_nans' : np.random.choice([0, 1, np.nan], size=size),
        'float_nans' : np.random.choice([0.0, 1.0, np.nan], size=size),
        'constant' : 1,
        'fake_categorical' : np.random.choice([10, 20, 30, 40, 50], size=size) ,
        'categorical_binary' : np.random.choice(['a', 'b'], size=size),
        'categorical_nans' : np.random.choice(['a', 'b', 'c', 'd', 'e', 'f', 'g'], size=size),
        'signal1' : np.random.normal(0, 0.3, size=size).cumsum() + 50,
        'signal2' : np.random.normal(0, 0.3, size=size).cumsum() + 50
    }

    df = pd.DataFrame(d)
    df['hardbools'] = df['bools'] == 1
    df['categorical_nans'] = df['categorical_nans'].replace('c', np.nan)
    df['categorical_binary'] = df['categorical_binary'].astype('category')
    df['unique_id'] = df['unique_id'].astype(str)

    df.index = df.dates
    df.index.name = 'dates'
    df = df.drop('dates', axis=1)

    return df


def generate_dask_df(size, npartitions=32):
    df = generate_df(size)
    df = dd.from_pandas(df, npartitions=npartitions)
    return df

These work fine:
df.holoplot.line(y='signal1')
df.holoplot.line(y='signal1', by='categorical_binary')
df.holoplot.line(y='signal1', datashade=True)

This is the result for by and datashade :
df.holoplot.line(y='signal1', by='categorical_binary', datashade=True)
screen shot 2018-06-26 at 16 57 52

Errors when contourf/contour/quadmesh & projection, geo, or crs is provided

import os
import xarray as xr
import hvplot.xarray

os.system(
    'wget -nc '
    'ftp://ftp.cdc.noaa.gov/'
    'Datasets/ncep.reanalysis.dailyavgs/'
    'surface/'
    'air.sig995.2018.nc'
)

obs_ds = xr.open_dataset('air.sig995.2018.nc')

# this works
obs_ds.hvplot.contourf(x='lon', y='lat', z='air', groupby='time')

# not this
obs_ds.hvplot.contourf(x='lon', y='lat', z='air', groupby='time', geo=True)

AxisError: axis 1 is out of bounds for array of dimension 1

Missing Point in display

import holoviews as hv
hv.extension('bokeh')
import geoviews

from shapely.geometry import Point
import pandas as pd
import geopandas as gpd
from geopandas import GeoSeries, GeoDataFrame
import hvplot.pandas
from geopandas import GeoSeries, GeoDataFrame
from shapely.geometry import Point

data = {'name': ['House', 'Work', 'Pet Store'],
        'lat': [  45,   46,     47.5],
        'lon': [-120, -121.2, -122.9]}
df = pd.DataFrame(data)
geo = [Point(xy) for xy in zip(data['lon'], data['lat'])]
gdf = GeoDataFrame(df, geometry=geo)

gdf.hvplot().options(size=15,color='green',marker='*')

The plot correctly sizes the axis ranges,
but the third point is not displayed

{'matplotlib': '2.2.2', 'pandas': '0.23.2', 'geopandas': '0.3.0', 'holoviews': '1.11.0a1.post3+g103daf59-dirty'}
hvplot from master v0.2.1 (july 9)

geopandas hvplot groupby fails

world = gpd.read_file(gpd.datasets.get_path('naturalearth_lowres'))
world.hvplot(width=550) + world.hvplot(groupby='continent', width=500)

KeyError: "Dimension 'continent' not found."

Groupby still plots the groupby column

import pandas as pd
import holoviews as hv
import holoplot.pandas
hv.extension('bokeh')

%%opts Curve {-framewise}

df = pd.DataFrame()
df['member'] = [0, 1, 2, 0, 1, 2]
df['data'] = [3, 4, 5, 6, 7, 8]
df.index = [0, 0, 0, 1, 1, 1]
df.plot(groupby='member')

image

Generate generic array if no coordinates are defined for xarray obj

Raise a warning, and also generate a generic linspace in the background for xarray objects that don't have coordinates attached so can quickly visualize the data.

<xarray.DataArray 'Field020' (Field020_dim002: 90, Field020_dim001: 180)>
array([[ 4.219483e-03,  8.433826e-03,  1.263789e-02, ..., -8.432080e-03,
        -4.217734e-03,  1.750679e-06],
       [ 5.359092e-03,  1.071166e-02,  1.605117e-02, ..., -1.070944e-02,
        -5.356870e-03,  2.223507e-06],
       [ 6.492877e-03,  1.297784e-02,  1.944700e-02, ..., -1.297516e-02,
        -6.490185e-03,  2.693918e-06],
       ...,
       [ 5.292206e-03,  1.057796e-02,  1.585083e-02, ..., -1.057577e-02,
        -5.290011e-03,  2.195755e-06],
       [ 4.152293e-03,  8.299527e-03,  1.243665e-02, ..., -8.297808e-03,
        -4.150571e-03,  1.722801e-06],
       [ 3.007867e-03,  6.012070e-03,  9.008948e-03, ..., -6.010825e-03,
        -3.006620e-03,  1.247975e-06]])
Dimensions without coordinates: Field020_dim002, Field020_dim001

~/anaconda3/lib/python3.6/site-packages/hvplot/util.py in process_xarray(data, x, y, by, groupby, use_dask, persist, gridded, label, value_label)
    276             x = data_vars[0] if y in dims else dims[0]
    277         elif not x and not y:
--> 278             x, y = dims[0], data_vars
    279 
    280         if by is None:

IndexError: list index out of range

Broken links

Front page of GitHub the two links are broken
image

The front page of the docs, the highlighted line's link is broken
image

xarray.DataArray.holoplot.image() fails if no 'name' is set

If trying to holoplot a 2D xr.DataArray, it currently must have a name to work. These names are usually inherited when e.g. selecting from a xr.Dataset but are seemingly dropped after some operations. A quick fix would just be an informative error.

Some code to reproduce:

import numpy as np
import xarray as xr
import holoplot.xarray

da = xr.DataArray(
    data=np.random.randn(10, 10), 
    dims=['a', 'b'],
    coords={'a': np.arange(10), 'b': np.arange(10)},
)

da.holoplot.image()

produces the slightly obscure error:

...
~/conda/lib/python3.6/site-packages/holoplot/converter.py in image(self, x, y, z, data)
    859         element = self._get_element('image')
    860         if self.geo: params['crs'] = self.crs
--> 861         return element(data, [x, y], z, **params).redim(**self._redim).redim.range(**ranges).opts(**opts)
    862 
    863     def quadmesh(self, x=None, y=None, z=None, data=None):

TypeError: range() keywords must be strings

whereas with a name set:

da = xr.DataArray(
    data=np.random.randn(10, 10), 
    dims=['a', 'b'],
    coords={'a': np.arange(10), 'b': np.arange(10)},
    name='test',
)

da.holoplot.image()

bokeh_plot

Repo title line

Still points to holoplot docs site, which no longer exists

Toggle holoplot when using within Jupyter notebook

This issue is a follow up on this SO answer as per @philippjfr request. Please keep in mind it's the first time I'm using holoplot (which seems to be awesome!)

I tried to use holoplot from within a Jupyter notebook. Once importing the package using

import holoplot.pandas

all .plot are going through holoplot. This is not always a convenient behavior. Sometimes, it is easy to think of a use case where some cells should be using holoplot while others will be rendered using the standard matplotlib. I hope this issue is good enough as a starting point for an interesting discussion.

Adding a theme

I was wondering if there's any interest in integrating a built-in theme to hvplot? If not, I'm thinking of creating a separate package that, on import, applies this theme (like seaborn).

Examples of how it compares to https://pyviz.github.io/hvplot/user_guide/Gridded_Data.html
https://anaconda.org/ahuang11/hvplot_theme/notebook

and also https://pyviz.github.io/hvplot/user_guide/Introduction.html
image
image

There are a couple of issues though.

  1. the title doesn't update according to the theme
  2. the settings set by the theme don't seem to be overwriteable

So I was thinking of wrapping this into a function with adjustable keyword arguments (and also remedy the title) that returns hv.renderer('bokeh').theme = theme

confused about quadmesh coordinate shapes

I am confused about how quadmesh represents data and coordinates. In my head, the coordinates of a quadmesh specify the positions of cell vertices, while the data represent values for the entire cell. Since there are more vertices than there are cells, the size of the coordinates should be greater. Specifically, if the shape of the data is (M, N), the x and y coordinates for the quadmesh should both have the shape (M+1, N+1).

This seems to be at odds with the quadmesh example, in which the coordinates and data have the exact same shape:

n = 20
coords = np.linspace(-1.5,1.5,n)
X,Y = np.meshgrid(coords, coords);
Qx = np.cos(Y) - np.cos(X)
Qy = np.sin(Y) + np.sin(X)
Z = np.sqrt(X**2 + Y**2)
โ€‹
print('Shape of x-coordinates:', Qx.shape)
print('Shape of y-coordinates:', Qy.shape)
print('Shape of value array:', Z.shape)
โ€‹
qmesh = hv.QuadMesh((Qx, Qy, Z))
qmesh
Shape of x-coordinates: (20, 20)
Shape of y-coordinates: (20, 20)
Shape of value array: (20, 20)

However, I find that I can in fact do

Z = np.sqrt(X**2 + Y**2)[:-1, :-1]

with no discernible difference in output. This fits my mental model much better.

What is going on here?

Curve/non geotypes should raise warning/error when geo=True

tst = pd.DataFrame(data={'lon': [1, 2, 3], 'lat': [4, 3, 2], 'idx': [0, 3, 5]})
tst.hvplot('lon', 'lat', geo=True, framewise=False).options(line_width=75) \
* tst.hvplot.points('lon', 'lat', groupby='idx', geo=True, framewise=False)

This yields unexpected results (the points aren't overlaid on top of curve).

A bonus would be to replace hv.Curve with gv.Path if geo=True.

Quadmesh flips image upside down

import os
import xarray as xr
import holoviews as hv
import geoviews as gv
import holoplot.xarray
hv.extension('bokeh')

os.system(
    'wget '
    'ftp://ftp.cdc.noaa.gov/'
    'Datasets/ncep.reanalysis.dailyavgs/'
    'surface/'
    'air.sig995.2018.nc'
)

obs_ds = xr.open_dataset('air.sig995.2018.nc')
obs_ds.holoplot.quadmesh(x='lon', y='lat', z='air', groupby='time')
obs_ds.holoplot.image(x='lon', y='lat', z='air', groupby='time')

Or maybe I just don't really know what the difference between quadmesh and image is.

image

trying holoplot-0.0.4 and pandas-0.23.0 under jupyterlab

I get an error trying introduction.ipynb, did I miss something ?

import holoplot.pandas
df.holoplot()
---------------------------------------------------------------------------
AttributeError                            Traceback (most recent call last)
<ipython-input-3-5a136e144f5a> in <module>()
      1 import holoplot.pandas
      2 
----> 3 df.holoplot()

C:\WinP\bd36\buQt5\winp32-3.6.x.1\python-3.6.5\lib\site-packages\pandas\core\generic.py in __getattr__(self, name)
   4370             if self._info_axis._can_hold_identifiers_and_holds_name(name):
   4371                 return self[name]
-> 4372             return object.__getattribute__(self, name)
   4373 
   4374     def __setattr__(self, name, value):

AttributeError: 'DataFrame' object has no attribute 'holoplot'

documentation enhancements - instructions to install us_crime and airline_flights

Add to the documenation for "Getting Started", that to get the us_crime and airline_flights catalogues you have to install the packages with: conda install -c intake us_crime airline_flights. Then to load them, I had to use crime = intake.Catalog('[direct path to yaml file]'), instead of intake.cat.us_crime.read() which gave me a KeyError. Once loaded, I got the dataframe by calling crime.us_crime.read(). Similar process was used to load the flights dataframe.

Load extension automatically in patch function

Hi all, I'm trying to see if using holoplot is feasible for an upcoming talk on real-time processing, for which streamz will make a brief appearance. I'm currently not getting much.

image

Is there additional setup that I should be doing here? Is there something that I can do to accelerate tracking down issues here?

Is there a way to control aspect ratio for hvplot?

I thought from holoviz/holoviews#30 (comment) that this might work:

import xarray as xr
import hvplot.xarray
url = 'https://rsignell.s3.amazonaws.com/NLCD/nlcd_2011_landcover_2011_edition_2014_10_10.tif'
da = xr.open_rasterio(url, chunks={'x':2056, 'y':2056})

%%opts Image [width=700 height=500 colorbar=True aspect='equal'] (cmap='magma') 
da[0, 50000:51000, 80000:81000].hvplot()

but I guess aspect is not a thing.

Is it possible to use Raster with hvplot?

I couldn't figure that out either. ๐Ÿ˜ฟ

groupby plots doesn't adhere to framewise

When I do something like

%%opts BoxWhisker {-framewise}

from bokeh.sampledata.autompg import autompg as df

title = "MPG by Cylinders and Data Source, Colored by Cylinders"
boxwhisker = hv.BoxWhisker(df, ['cyl', 'origin'], 'mpg', label=title)

df.plot.box('mpg', 'origin', groupby='yr')

the ylimits do not stay consistent across frames.
image
image

Works with HoloViews dataset.to.box syntax though

%%opts BoxWhisker {-framewise}

from bokeh.sampledata.autompg import autompg as df

title = "MPG by Cylinders and Data Source, Colored by Cylinders"
boxwhisker = hv.BoxWhisker(df, ['cyl', 'origin'], 'mpg', label=title)

hv.Dataset(df).to.box('origin', 'mpg', groupby='yr')

Adding coastline leaves image blank

import os
import xarray as xr
import holoviews as hv
import geoviews as gv
import holoplot.xarray
hv.extension('bokeh')

os.system(
    'wget '
    'ftp://ftp.cdc.noaa.gov/'
    'Datasets/ncep.reanalysis.dailyavgs/'
    'surface/'
    'air.sig995.2018.nc'
)

obs_ds = xr.open_dataset('air.sig995.2018.nc')
obs_ds.holoplot.image(x='lon', y='lat', z='air', groupby='time')

obs_ds.holoplot.image(x='lon', y='lat', z='air', groupby='time') * gv.feature.coastline()

hv.Dataset(obs_ds).to(gv.Image, ['lon', 'lat'], 'air', ['time'], dynamic=True) * gv.feature.coastline()

image

Datashaded plots with dask dataframes, datashader keyerror 'get'

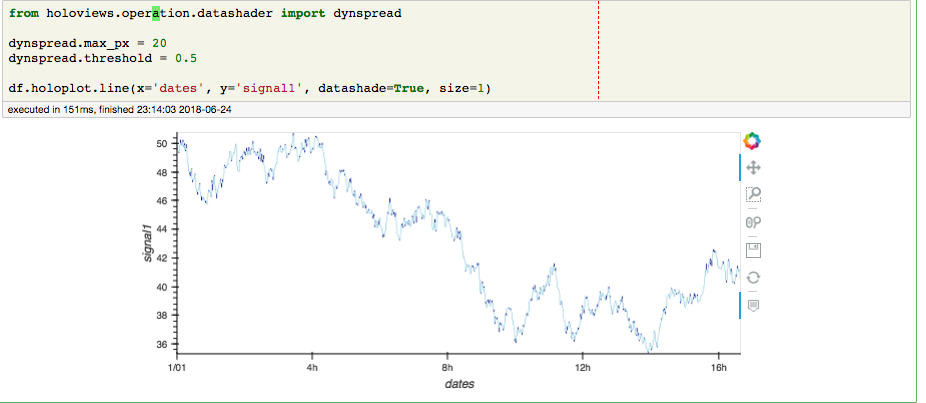
The following examples gives an error.
If you compute() dataframe it will work.
If it is non datashaded, it will work.

def generate_df(size):
    d = {
        'dates' : pd.date_range('1980-01-01', periods=size, freq='1T'),
        'unique_id' : np.arange(0, size),
        'ints' : np.random.randint(0, size, size=size),
        'floats' : np.random.randn(size),
        'bools' : np.random.choice([0, 1], size=size),
        'int_nans' : np.random.choice([0, 1, np.nan], size=size),
        'float_nans' : np.random.choice([0.0, 1.0, np.nan], size=size),
        'constant' : 1,
        'fake_categorical' : np.random.choice([10, 20, 30, 40, 50], size=size) ,
        'categorical_binary' : np.random.choice(['a', 'b'], size=size),
        'categorical_nans' : np.random.choice(['a', 'b', 'c', 'd', 'e', 'f', 'g'], size=size),
        'signal1' : np.random.normal(0, 0.3, size=size).cumsum() + 50,
        'signal2' : np.random.normal(0, 0.3, size=size).cumsum() + 50
    }

    df = pd.DataFrame(d)
    df['hardbools'] = df['bools'] == 1
    df['categorical_nans'] = df['categorical_nans'].replace('c', np.nan)
    df['categorical_binary'] = df['categorical_binary'].astype('category')
    df['unique_id'] = df['unique_id'].astype(str)

    df.index = df.dates
    df.index.name = 'dates'
    df = df.drop('dates', axis=1)

    return df

def generate_dask_df(size, npartitions=16):
    return dd.from_pandas(generate_df(size), npartitions=npartitions)
import holoplot.dask
import holoplot.pandas

plt = df.holoplot(y='signal1', by="categorical_binary", 
            title='yo', datashade=True, 
            )
plt

This gives stacktrace:

KeyError                                  Traceback (most recent call last)
~/jungle/local/lib/python3.5/site-packages/ipython-6.3.1-py3.5.egg/IPython/core/formatters.py in __call__(self, obj, include, exclude)
    968 
    969             if method is not None:
--> 970                 return method(include=include, exclude=exclude)
    971             return None
    972         else:

~/area51/holoviews/holoviews/core/dimension.py in _repr_mimebundle_(self, include, exclude)
   1229         combined and returned.
   1230         """
-> 1231         return Store.render(self)
   1232 
   1233 

~/area51/holoviews/holoviews/core/options.py in render(cls, obj)
   1287         data, metadata = {}, {}
   1288         for hook in hooks:
-> 1289             ret = hook(obj)
   1290             if ret is None:
   1291                 continue

~/area51/holoviews/holoviews/ipython/display_hooks.py in pprint_display(obj)
    270     if not ip.display_formatter.formatters['text/plain'].pprint:
    271         return None
--> 272     return display(obj, raw_output=True)
    273 
    274 

~/area51/holoviews/holoviews/ipython/display_hooks.py in display(obj, raw_output, **kwargs)
    246     elif isinstance(obj, (HoloMap, DynamicMap)):
    247         with option_state(obj):
--> 248             output = map_display(obj)
    249     elif isinstance(obj, Plot):
    250         output = render(obj)

~/area51/holoviews/holoviews/ipython/display_hooks.py in wrapped(element)
    140         try:
    141             max_frames = OutputSettings.options['max_frames']
--> 142             mimebundle = fn(element, max_frames=max_frames)
    143             if mimebundle is None:
    144                 return {}, {}

~/area51/holoviews/holoviews/ipython/display_hooks.py in map_display(vmap, max_frames)
    200         return None
    201 
--> 202     return render(vmap)
    203 
    204 

~/area51/holoviews/holoviews/ipython/display_hooks.py in render(obj, **kwargs)
     63         renderer = renderer.instance(fig='png')
     64 
---> 65     return renderer.components(obj, **kwargs)
     66 
     67 

~/area51/holoviews/holoviews/plotting/bokeh/renderer.py in components(self, obj, fmt, comm, **kwargs)
    260         # Bokeh has to handle comms directly in <0.12.15
    261         comm = False if bokeh_version < '0.12.15' else comm
--> 262         return super(BokehRenderer, self).components(obj,fmt, comm, **kwargs)
    263 
    264 

~/area51/holoviews/holoviews/plotting/renderer.py in components(self, obj, fmt, comm, **kwargs)
    327             plot = obj
    328         else:
--> 329             plot, fmt = self._validate(obj, fmt)
    330 
    331         widget_id = None

~/area51/holoviews/holoviews/plotting/renderer.py in _validate(self, obj, fmt, **kwargs)
    226         if isinstance(obj, tuple(self.widgets.values())):
    227             return obj, 'html'
--> 228         plot = self.get_plot(obj, renderer=self, **kwargs)
    229 
    230         fig_formats = self.mode_formats['fig'][self.mode]

~/area51/holoviews/holoviews/plotting/bokeh/renderer.py in get_plot(self_or_cls, obj, doc, renderer)
    153             curdoc().theme = self_or_cls.theme
    154         doc.theme = self_or_cls.theme
--> 155         plot = super(BokehRenderer, self_or_cls).get_plot(obj, renderer)
    156         plot.document = doc
    157         return plot

~/area51/holoviews/holoviews/plotting/renderer.py in get_plot(self_or_cls, obj, renderer)
    193 
    194         # Initialize DynamicMaps with first data item
--> 195         initialize_dynamic(obj)
    196 
    197         if not isinstance(obj, Plot):

~/area51/holoviews/holoviews/plotting/util.py in initialize_dynamic(obj)
    242             continue
    243         if not len(dmap):
--> 244             dmap[dmap._initial_key()]
    245 
    246 

~/area51/holoviews/holoviews/core/spaces.py in __getitem__(self, key)
   1130         # Not a cross product and nothing cached so compute element.
   1131         if cache is not None: return cache
-> 1132         val = self._execute_callback(*tuple_key)
   1133         if data_slice:
   1134             val = self._dataslice(val, data_slice)

~/area51/holoviews/holoviews/core/spaces.py in _execute_callback(self, *args)
    909 
    910         with dynamicmap_memoization(self.callback, self.streams):
--> 911             retval = self.callback(*args, **kwargs)
    912         return self._style(retval)
    913 

~/area51/holoviews/holoviews/core/spaces.py in __call__(self, *args, **kwargs)
    570 
    571         try:
--> 572             ret = self.callable(*args, **kwargs)
    573         except KeyError:
    574             # KeyError is caught separately because it is used to signal

~/area51/holoviews/holoviews/util/__init__.py in dynamic_operation(*key, **kwargs)
    435             def dynamic_operation(*key, **kwargs):
    436                 self.p.kwargs.update(kwargs)
--> 437                 return self._process(map_obj[key], key)
    438         if isinstance(self.p.operation, Operation):
    439             return OperationCallable(dynamic_operation, inputs=[map_obj],

~/area51/holoviews/holoviews/core/spaces.py in __getitem__(self, key)
   1130         # Not a cross product and nothing cached so compute element.
   1131         if cache is not None: return cache
-> 1132         val = self._execute_callback(*tuple_key)
   1133         if data_slice:
   1134             val = self._dataslice(val, data_slice)

~/area51/holoviews/holoviews/core/spaces.py in _execute_callback(self, *args)
    909 
    910         with dynamicmap_memoization(self.callback, self.streams):
--> 911             retval = self.callback(*args, **kwargs)
    912         return self._style(retval)
    913 

~/area51/holoviews/holoviews/core/spaces.py in __call__(self, *args, **kwargs)
    570 
    571         try:
--> 572             ret = self.callable(*args, **kwargs)
    573         except KeyError:
    574             # KeyError is caught separately because it is used to signal

~/area51/holoviews/holoviews/util/__init__.py in dynamic_operation(*key, **kwargs)
    431                 self.p.kwargs.update(kwargs)
    432                 obj = map_obj[key] if isinstance(map_obj, HoloMap) else map_obj
--> 433                 return self._process(obj, key)
    434         else:
    435             def dynamic_operation(*key, **kwargs):

~/area51/holoviews/holoviews/util/__init__.py in _process(self, element, key)
    417             kwargs = {k: v for k, v in self.p.kwargs.items()
    418                       if k in self.p.operation.params()}
--> 419             return self.p.operation.process_element(element, key, **kwargs)
    420         else:
    421             return self.p.operation(element, **self.p.kwargs)

~/area51/holoviews/holoviews/core/operation.py in process_element(self, element, key, **params)
    141         """
    142         self.p = param.ParamOverrides(self, params)
--> 143         return self._apply(element, key)
    144 
    145 

~/area51/holoviews/holoviews/core/operation.py in _apply(self, element, key)
    119         for hook in self._preprocess_hooks:
    120             kwargs.update(hook(self, element))
--> 121         ret = self._process(element, key)
    122         for hook in self._postprocess_hooks:
    123             ret = hook(self, ret, **kwargs)

~/area51/holoviews/holoviews/operation/datashader.py in _process(self, element, key)
    912 
    913     def _process(self, element, key=None):
--> 914         agg = rasterize._process(self, element, key)
    915         shaded = shade._process(self, agg, key)
    916         return shaded

~/area51/holoviews/holoviews/operation/datashader.py in _process(self, element, key)
    743             op = transform.instance(**op_params)
    744             op._precomputed = self._precomputed
--> 745             element = element.map(op, predicate)
    746             self._precomputed = op._precomputed
    747         return element

~/area51/holoviews/holoviews/core/dimension.py in map(self, map_fn, specs, clone)
    689                 if new_val is not None:
    690                     deep_mapped[k] = new_val
--> 691             if applies: deep_mapped = map_fn(deep_mapped)
    692             return deep_mapped
    693         else:

~/area51/holoviews/holoviews/core/operation.py in __call__(self, element, **params)
    161                                 operation=self, kwargs=params)
    162         elif isinstance(element, ViewableElement):
--> 163             processed = self._apply(element)
    164         elif isinstance(element, DynamicMap):
    165             if any((not d.values) for d in element.kdims):

~/area51/holoviews/holoviews/core/operation.py in _apply(self, element, key)
    119         for hook in self._preprocess_hooks:
    120             kwargs.update(hook(self, element))
--> 121         ret = self._process(element, key)
    122         for hook in self._postprocess_hooks:
    123             ret = hook(self, ret, **kwargs)

~/area51/holoviews/holoviews/operation/datashader.py in _process(self, element, key)
    413             ((isinstance(agg_fn, (ds.count, ds.sum, ds.mean)) and agg_fn.column not in element.kdims) or
    414              (isinstance(agg_fn, ds.count_cat) and agg_fn.column in element.kdims))):
--> 415             return self._aggregate_ndoverlay(element, agg_fn)
    416 
    417         if element._plot_id in self._precomputed:

~/area51/holoviews/holoviews/operation/datashader.py in _aggregate_ndoverlay(self, element, agg_fn)
    360                 grouped = element.groupby([agg_fn.column], container_type=NdOverlay,
    361                                           group_type=NdOverlay)
--> 362             return grouped.clone({k: agg_fn1(v) for k, v in grouped.items()})
    363 
    364         # Create aggregate instance for sum, count operations, breaking mean

~/area51/holoviews/holoviews/operation/datashader.py in <dictcomp>(.0)
    360                 grouped = element.groupby([agg_fn.column], container_type=NdOverlay,
    361                                           group_type=NdOverlay)
--> 362             return grouped.clone({k: agg_fn1(v) for k, v in grouped.items()})
    363 
    364         # Create aggregate instance for sum, count operations, breaking mean

~/area51/holoviews/holoviews/core/operation.py in __call__(self, element, **params)
    161                                 operation=self, kwargs=params)
    162         elif isinstance(element, ViewableElement):
--> 163             processed = self._apply(element)
    164         elif isinstance(element, DynamicMap):
    165             if any((not d.values) for d in element.kdims):

~/area51/holoviews/holoviews/core/operation.py in _apply(self, element, key)
    119         for hook in self._preprocess_hooks:
    120             kwargs.update(hook(self, element))
--> 121         ret = self._process(element, key)
    122         for hook in self._postprocess_hooks:
    123             ret = hook(self, ret, **kwargs)

~/area51/holoviews/holoviews/operation/datashader.py in _process(self, element, key)
    450 
    451         dfdata = PandasInterface.as_dframe(data)
--> 452         agg = getattr(cvs, glyph)(dfdata, x.name, y.name, agg_fn)
    453         if 'x_axis' in agg.coords and 'y_axis' in agg.coords:
    454             agg = agg.rename({'x_axis': x, 'y_axis': y})

~/jungle/local/lib/python3.5/site-packages/datashader/core.py in line(self, source, x, y, agg)
    185         if agg is None:
    186             agg = any_rdn()
--> 187         return bypixel(source, self, Line(x, y), agg)
    188 
    189     # TODO re 'untested', below: Consider replacing with e.g. a 3x3

~/jungle/local/lib/python3.5/site-packages/datashader/core.py in bypixel(source, canvas, glyph, agg)
    535     agg.validate(schema)
    536     canvas.validate()
--> 537     return bypixel.pipeline(source, schema, canvas, glyph, agg)
    538 
    539 

~/jungle/local/lib/python3.5/site-packages/datashader/utils.py in __call__(self, head, *rest, **kwargs)
     56         typ = type(head)
     57         if typ in lk:
---> 58             return lk[typ](head, *rest, **kwargs)
     59         for cls in getmro(typ)[1:]:
     60             if cls in lk:

~/jungle/local/lib/python3.5/site-packages/datashader/dask.py in dask_pipeline(df, schema, canvas, glyph, summary)
     19     dsk, name = glyph_dispatch(glyph, df, schema, canvas, summary)
     20 
---> 21     get = _globals['get'] or getattr(df, '__dask_scheduler__', None) or df._default_get
     22     keys = getattr(df, '__dask_keys__', None) or df._keys
     23     optimize = getattr(df, '__dask_optimize__', None) or df._optimize

KeyError: 'get'

I tried doing a loc version by overlaying plots with data locced by category, with plain Holoviews,
and it throws an error:

~/jungle/local/lib/python3.5/site-packages/ipython-6.3.1-py3.5.egg/IPython/core/formatters.py in __call__(self, obj, include, exclude)
    968 
    969             if method is not None:
--> 970                 return method(include=include, exclude=exclude)
    971             return None
    972         else:

~/area51/holoviews/holoviews/core/dimension.py in _repr_mimebundle_(self, include, exclude)
   1229         combined and returned.
   1230         """
-> 1231         return Store.render(self)
   1232 
   1233 

~/area51/holoviews/holoviews/core/options.py in render(cls, obj)
   1287         data, metadata = {}, {}
   1288         for hook in hooks:
-> 1289             ret = hook(obj)
   1290             if ret is None:
   1291                 continue

~/area51/holoviews/holoviews/ipython/display_hooks.py in pprint_display(obj)
    270     if not ip.display_formatter.formatters['text/plain'].pprint:
    271         return None
--> 272     return display(obj, raw_output=True)
    273 
    274 

~/area51/holoviews/holoviews/ipython/display_hooks.py in display(obj, raw_output, **kwargs)
    246     elif isinstance(obj, (HoloMap, DynamicMap)):
    247         with option_state(obj):
--> 248             output = map_display(obj)
    249     elif isinstance(obj, Plot):
    250         output = render(obj)

~/area51/holoviews/holoviews/ipython/display_hooks.py in wrapped(element)
    140         try:
    141             max_frames = OutputSettings.options['max_frames']
--> 142             mimebundle = fn(element, max_frames=max_frames)
    143             if mimebundle is None:
    144                 return {}, {}

~/area51/holoviews/holoviews/ipython/display_hooks.py in map_display(vmap, max_frames)
    200         return None
    201 
--> 202     return render(vmap)
    203 
    204 

~/area51/holoviews/holoviews/ipython/display_hooks.py in render(obj, **kwargs)
     63         renderer = renderer.instance(fig='png')
     64 
---> 65     return renderer.components(obj, **kwargs)
     66 
     67 

~/area51/holoviews/holoviews/plotting/bokeh/renderer.py in components(self, obj, fmt, comm, **kwargs)
    260         # Bokeh has to handle comms directly in <0.12.15
    261         comm = False if bokeh_version < '0.12.15' else comm
--> 262         return super(BokehRenderer, self).components(obj,fmt, comm, **kwargs)
    263 
    264 

~/area51/holoviews/holoviews/plotting/renderer.py in components(self, obj, fmt, comm, **kwargs)
    327             plot = obj
    328         else:
--> 329             plot, fmt = self._validate(obj, fmt)
    330 
    331         widget_id = None

~/area51/holoviews/holoviews/plotting/renderer.py in _validate(self, obj, fmt, **kwargs)
    226         if isinstance(obj, tuple(self.widgets.values())):
    227             return obj, 'html'
--> 228         plot = self.get_plot(obj, renderer=self, **kwargs)
    229 
    230         fig_formats = self.mode_formats['fig'][self.mode]

~/area51/holoviews/holoviews/plotting/bokeh/renderer.py in get_plot(self_or_cls, obj, doc, renderer)
    153             curdoc().theme = self_or_cls.theme
    154         doc.theme = self_or_cls.theme
--> 155         plot = super(BokehRenderer, self_or_cls).get_plot(obj, renderer)
    156         plot.document = doc
    157         return plot

~/area51/holoviews/holoviews/plotting/renderer.py in get_plot(self_or_cls, obj, renderer)
    209             plot_opts = self_or_cls.plot_options(obj, self_or_cls.size)
    210             plot = self_or_cls.plotting_class(obj)(obj, renderer=renderer,
--> 211                                                    **plot_opts)
    212             defaults = [kd.default for kd in plot.dimensions]
    213             init_key = tuple(v if d is None else d for v, d in

~/area51/holoviews/holoviews/plotting/plot.py in __init__(self, overlay, ranges, batched, keys, group_counter, **params)
    889         self.group_counter = Counter() if group_counter is None else group_counter
    890         self.zoffset = 0
--> 891         self.subplots = self._create_subplots(ranges)
    892         self.traverse(lambda x: setattr(x, 'comm', self.comm))
    893         self.top_level = keys is None

~/area51/holoviews/holoviews/plotting/plot.py in _create_subplots(self, ranges)
    939         if isinstance(self.hmap, DynamicMap):
    940             dmap_streams = [get_nested_streams(layer) for layer in
--> 941                             split_dmap_overlay(self.hmap)]
    942         else:
    943             dmap_streams = [None]*len(keys)

~/area51/holoviews/holoviews/plotting/util.py in split_dmap_overlay(obj, depth)
    217             if obj.callback.inputs and is_dynamic_overlay(obj):
    218                 for inp in obj.callback.inputs:
--> 219                     layers += split_dmap_overlay(inp, depth+1)
    220             else:
    221                 for v in obj.last.values():

~/area51/holoviews/holoviews/plotting/util.py in split_dmap_overlay(obj, depth)
    211     layers = []
    212     if isinstance(obj, DynamicMap):
--> 213         if issubclass(obj.type, NdOverlay) and not depth:
    214             for v in obj.last.values():
    215                 layers.append(obj)

TypeError: issubclass() arg 1 must be a class

group_label keyword doesn't change group name

tst = (hv.Curve([0, 1, 2], group='agroup', label='alabel') + hv.Curve([3, 4, 5], group='bgroup', label='blabel'))
print(tst)

print('\nhvplot')

tst_df = pd.DataFrame({'x1': [0, 1, 2], 'x2': [3, 4, 5]})
print(tst_df.hvplot('index', 'x1', label='alabel', group_label='agroup') + tst_df.hvplot('index', 'x2', label='blabel', group_label='bgroup'))

image

No option for list of bin edges in histogram

station_df.max_temp_f.hist(alpha=0.5, bins=[50, 60, 70])

image

vs

station_df.max_temp_f.holoplot.hist(alpha=0.5, bins=[50, 60, 70])

station_df.max_temp_f.holoplot.hist(alpha=0.5, bins=[50, 60, 70])
...
~/anaconda3/lib/python3.6/site-packages/holoviews/operation/element.py in _process(self, view, key)
    556 
    557         datetimes = False
--> 558         steps = self.p.num_bins + 1
    559         start, end = hist_range
    560         if data.dtype.kind == 'M' or (data.dtype.kind == 'O' and isinstance(data[0], datetime_types)):

TypeError: can only concatenate list (not "int") to list

cycle referenced before assignment

df contains three columns
df.holoplot(color=hv.Cycle(['red', 'blue', 'black']))

/mnt/c/Users/sephi/GOOGLE~1/Bash/holoplot/holoplot/__init__.py in __call__(self, x, y, kind, **kwds)
     76         kind = kind or params.pop('kind', None)
     77         converter = HoloViewsConverter(
---> 78             self._data, x, y, kind=kind, **params
     79         )
     80         return converter(kind, x, y)

/mnt/c/Users/sephi/GOOGLE~1/Bash/holoplot/holoplot/converter.py in __init__(self, data, x, y, kind, by, use_index, group_label, value_label, backlog, persist, use_dask, crs, fields, groupby, dynamic, width, height, shared_axes, grid, legend, rot, title, xlim, ylim, clim, xticks, yticks, logx, logy, loglog, hover, subplots, label, invert, stacked, colorbar, fontsize, colormap, datashade, rasterize, row, col, figsize, debug, xaxis, yaxis, framewise, aggregator, projection, global_extent, geo, **kwds)
    206             elif not isinstance(color, (Cycle, list)):
    207                 continue
--> 208             style_opts[opt] = Cycle(values=cycle) if isinstance(cycle, list) else cycle
    209         self._style_opts = style_opts
    210         self._norm_opts = {'framewise': framewise, 'axiswise': not shared_axes}

UnboundLocalError: local variable 'cycle' referenced before assignment

colorbar for Polygons

geopandas.read_file('LondonBoroughs.shp').hvplot('PopDen').options(cmap='RdBu', colorbar=True)

returns an hv.Polygon element without the colorbar

Derived datetime accessor (time.dayofyear)

Something like xarray
image

So that instead of

df['day'] = df.index.day
df.dropna(subset=['tmpf']).hvplot('valid', 'tmpf', groupby='day')

one can...
df.dropna(subset=['tmpf']).hvplot('valid', 'tmpf', groupby='valid.day')

Recommend Projects

  • React photo React

    A declarative, efficient, and flexible JavaScript library for building user interfaces.

  • Vue.js photo Vue.js

    ๐Ÿ–– Vue.js is a progressive, incrementally-adoptable JavaScript framework for building UI on the web.

  • Typescript photo Typescript

    TypeScript is a superset of JavaScript that compiles to clean JavaScript output.

  • TensorFlow photo TensorFlow

    An Open Source Machine Learning Framework for Everyone

  • Django photo Django

    The Web framework for perfectionists with deadlines.

  • D3 photo D3

    Bring data to life with SVG, Canvas and HTML. ๐Ÿ“Š๐Ÿ“ˆ๐ŸŽ‰

Recommend Topics

  • javascript

    JavaScript (JS) is a lightweight interpreted programming language with first-class functions.

  • web

    Some thing interesting about web. New door for the world.

  • server

    A server is a program made to process requests and deliver data to clients.

  • Machine learning

    Machine learning is a way of modeling and interpreting data that allows a piece of software to respond intelligently.

  • Game

    Some thing interesting about game, make everyone happy.

Recommend Org

  • Facebook photo Facebook

    We are working to build community through open source technology. NB: members must have two-factor auth.

  • Microsoft photo Microsoft

    Open source projects and samples from Microsoft.

  • Google photo Google

    Google โค๏ธ Open Source for everyone.

  • D3 photo D3

    Data-Driven Documents codes.