Giter VIP home page Giter VIP logo

inigodelportillo / itu-rpy Goto Github PK

View Code? Open in Web Editor NEW
109.0 18.0 160.0 340.13 MB

A python implementation of the ITU-R P. Recommendations for atmospheric attenuation modeling

Home Page: http://itu-rpy.readthedocs.io/en/latest/index.html

License: MIT License

Python 100.00%
itu itu-r itu-recommendations rain-attenuation gas-attenuation cloud-attenuation atmospheric-attenuation atmospheric-gases atmospheric-modelling atmospheric

itu-rpy's People

Contributors

alastairuk avatar aleixpb2 avatar inigodelportillo avatar iportillo avatar xenon130 avatar

Stargazers

 avatar  avatar  avatar  avatar  avatar  avatar  avatar  avatar  avatar  avatar  avatar  avatar  avatar  avatar  avatar  avatar  avatar  avatar  avatar  avatar  avatar  avatar  avatar  avatar  avatar  avatar  avatar  avatar  avatar  avatar  avatar  avatar  avatar  avatar  avatar  avatar  avatar  avatar  avatar  avatar  avatar  avatar  avatar  avatar  avatar  avatar  avatar  avatar  avatar  avatar  avatar  avatar  avatar  avatar  avatar  avatar  avatar  avatar  avatar  avatar  avatar  avatar  avatar  avatar  avatar  avatar  avatar  avatar  avatar  avatar  avatar  avatar  avatar  avatar  avatar  avatar  avatar  avatar  avatar  avatar  avatar  avatar  avatar  avatar  avatar  avatar  avatar  avatar  avatar  avatar  avatar  avatar  avatar  avatar  avatar  avatar  avatar  avatar  avatar  avatar

Watchers

 avatar  avatar  avatar  avatar  avatar  avatar  avatar  avatar  avatar  avatar  avatar  avatar  avatar  avatar  avatar  avatar  avatar  avatar

itu-rpy's Issues

Equivalent height in P.676

Hello,

It seems to me that the equivalent heights for oxygen and water vapour (ITU-R P.676) are given in km. Although not clearly stated, it is then multiplied by a specific attenuation in dB/km, and other distances are in km in the same Recommendation.

In ITU-Rpy, the value returned is in metres, and gives very low values (1 to 5 m). I believe the value should be returned in km instead of m, although I have not checked if it matches the value returned by the actual Recommendation. The documentation should also be modified.

[BUG] Cannot vectorize elevations and unavailabilities at the same time

Describe the bug
Vectorizing the elevations and unavailabilities leads to errors du to incorrect matrix shape. This concerns only the gaseous attenuation matrix.

To Reproduce

from itur import atmospheric_attenuation_slant_path
import numpy as np

ps = np.array([0.1, 1, 10, 5])
els = np.array([[15], [20], [25]])
res = atmospheric_attenuation_slant_path(lat=0, lon=0, f=20, el=els, D=1, p=ps)
print(res)

Expected behavior
This should give me a matrix of 4x3 different combinations of P and el. Instead it crashes.

Possible fix
An easy fix is to replace in __init__.py:

# Compute the total attenuation according to
    A = Ag + np.sqrt((Ar + Ac) ** 2 + As ** 2)

with

# Compute the total attenuation according to
    A = Ag.T + np.sqrt((Ar + Ac) ** 2 + As ** 2)

(We transpose the gaseous matrix which is computed in the inccorect shape)

I can make a PR with this fix if needed.

[BUG] Typo in a formula in itur.models.itu530.multipath_loss

Describe the bug
itur.models.itu530.multipath_loss returns wrong results for A in the shallow fading region. This is due to a missing bracket in step 3b. Here's how to fix it:

        def step_3b(p_0, At, A):
            ...
            q_t = ((qa_p - 2) /
-                   (1 + 0.3 * 10 ** (-At / 20) * 10 ** (-0.016 * At)) -
+                  ((1 + 0.3 * 10 ** (-At / 20)) * 10 ** (-0.016 * At)) -
                   4.3 * (10**(-At / 20) + At / 800))
            ...

And here's the relevant fragment of the recommendation:
screenshot of ITU-R P.530 equation 16

To Reproduce
With the original code, plot of p_W vs fade depth contains a discontinuity, which probably shouldn't happen (the curves in figure 3 of the recommendation are smooth):

import numpy as np
import matplotlib.pyplot as plt
from itur.models import itu530
A = np.linspace(0,30,100)
p = itu530.multipath_loss(lat=22.443907, lon=-74.220397, h_e=40, h_r=40, d=20, f=18, A=A)
plt.plot(A,p)
plt.xlabel("fade depth [dB]")
plt.ylabel("% avg worst month")
plt.yscale("log")
plt.show()

image

Expected behavior
After applying the suggested change, the discontinuity becomes negligibly small (still, shouldn't it be perfectly smooth???)
image

[BUG] bisect returning ValueError: f(a) and f(b) must have different signs

Im trying to use inverse_rain_attenuation function from ITU-R P.530 but I'm getting this error:

File "./lib/link_budget.py", line 341, in inverse_rain_attenuation return bisect(func_bisect, 0.000001, 100) File ".venv/lib/python3.10/site-packages/scipy/optimize/_zeros_py.py", line 557, in bisect r = _zeros._bisect(f, a, b, xtol, rtol, maxiter, args, full_output, disp) ValueError: f(a) and f(b) must have different signs

Here is an example:

from itur.models.itu530 import inverse_rain_attenuation
f = 22.5   # Link frequency
d = 2.6  # Distance
el = 60  # Elevation angle constanf 60 degrees
Ap = 30  #Fade depth
lat = 50.3515944444
lon = 10.9511027778
inverse_rain_attenuation(lat, lon, d, f, el, Ap, tau=90, R001=None)

Thanks in advance

ITU-R P.676 Gas attenuation rho, P, and T parameters

Wouldn't rho, P, and T be equal None too? Should be an option if someone does not know those parameters and uses the ITU-R P.835 data provided when given the height, unless we set P = 1013.24399344 hPa, T = 288.15 K, and rho = 7.5 g/m^3

itu835.py: Erroneous temperature for some cases

Dear ITU-Rpy team,

First of all I would like to thank you for this great ITU models implementation... So useful for any RF enthusiast.

On the other hand, I open this issue because I have found several "typing errors" in the code that can produce bad results. I describe below what found:

  1. Inside class itu835.py:
    Line 192 ------> 294.9838 - 5.2159 * h - 9.07109 * h2
    It should be ---> 294.9838 - 5.2159 * h - 0.07109 * h
    2
    Check bug with this function call: itu835.temperature(30,12,'summer')
    Result: <Quantity -1073.84396 K>

  2. Inside class itu835.py:
    Line 195 -------> 215 * np.exp((h - 17) * 0.008128)
    It shoud be ----> 215.15 * np.exp((h - 17) * 0.008128)

  3. When implementing the pressure formulae for the low, mid and high-latitude, P10 and P72 are calculated with the standard atmosphere. This produces an abrupt step in the continuity of the pressure curve. I am not sure but I think P10 and P72 should be calculated with the formula that was used in the step before (e.g. formula for the interval 0 <= h <= 10 with h=10 for P10)

Thank you very much and best regards,

Daniel.

Superfluous warning when elevation is equal to 90 degrees

if np.any(5 > el) or np.any(np.mod(el, 90) < 5):

When calling gaseous_attenuation_approximation with an elevation angle of 90 degrees, this warning is thrown:

The approximated method to compute the gaseous attenuation in recommendation ITU-P 676-11 is only recommended for elevation angles between 5 and 90 degrees

First, 90 degrees is between 5 and 90 degrees (for the closed interval), so the conditional is inconsistent with the warning. Second, Annex 2 of ITU-R P.676-13 should work for 5 <= el <= 175 degrees, since sin(theta) is symmetric around 90deg.

Error with python 3.6, module 'itur' has no attribute 'u' and module 'itur' has no attribute 'utils'

Is this library working correctly with Python 3.6?
I did the installation according to the documentation but got errors when executing the code. The error information follows:

Traceback (most recent call last):
  File "<input>", line 1, in <module>
  File "/home/samuel/.local/share/JetBrains/Toolbox/apps/PyCharm-P/ch-0/201.7223.92/plugins/python/helpers/pydev/_pydev_bundle/pydev_umd.py", line 197, in runfile
    pydev_imports.execfile(filename, global_vars, local_vars)  # execute the script
  File "/home/samuel/.local/share/JetBrains/Toolbox/apps/PyCharm-P/ch-0/201.7223.92/plugins/python/helpers/pydev/_pydev_imps/_pydev_execfile.py", line 18, in execfile
    exec(compile(contents+"\n", file, 'exec'), glob, loc)
  File "/home/samuel/Analysis-of-antenna-coverage/itur.py", line 1, in <module>
    import itur
  File "/home/samuel/.local/share/JetBrains/Toolbox/apps/PyCharm-P/ch-0/201.7223.92/plugins/python/helpers/pydev/_pydev_bundle/pydev_import_hook.py", line 21, in do_import
    module = self._system_import(name, *args, **kwargs)
  File "/home/samuel/Analysis-of-antenna-coverage/itur.py", line 3, in <module>
    f = 22.5 * itur.u.GHz  # Link frequency
AttributeError: module 'itur' has no attribute 'u'

[BUG]

Describe the bug
In itu837 rainfall_rate is giving an error

To Reproduce
from itur.models.itu837 import rainfall_rate
rainfall_rate(37.5,237.6,0.01)

Expected behavior
The error is happening in function R001 line 103
The error is happening on line 113
return self._R001(
np.array([lat.ravel(), lon.ravel()]).T).reshape(lat.shape)

Additional context
error reported
Traceback (most recent call last):
File "C:\Program Files\JetBrains\PyCharm 2022.1.3\plugins\python\helpers\pydev\pydevconsole.py", line 364, in runcode
coro = func()
File "", line 1, in
File "C:\Users\samee\anaconda3\envs\dts\lib\site-packages\itur\models\itu837.py", line 398, in rainfall_rate
val = __model.rainfall_rate(lat, lon, p)
File "C:\Users\samee\anaconda3\envs\dts\lib\site-packages\itur\models\itu837.py", line 73, in rainfall_rate
return np.array(fcn(lat, lon, p).tolist())
File "C:\Users\samee\anaconda3\envs\dts\lib\site-packages\numpy\lib\function_base.py", line 2328, in call
return self._vectorize_call(func=func, args=vargs)
File "C:\Users\samee\anaconda3\envs\dts\lib\site-packages\numpy\lib\function_base.py", line 2411, in _vectorize_call
outputs = ufunc(*inputs)
File "C:\Users\samee\anaconda3\envs\dts\lib\site-packages\numpy\lib\function_base.py", line 2323, in func
return self.pyfunc(*the_args, **kwargs)
File "C:\Users\samee\anaconda3\envs\dts\lib\site-packages\itur\models\itu837.py", line 154, in rainfall_rate
return self.R001(lat_d, lon_d)
File "C:\Users\samee\anaconda3\envs\dts\lib\site-packages\itur\models\itu837.py", line 113, in R001
return self._R001(
File "C:\Users\samee\anaconda3\envs\dts\lib\site-packages\scipy\interpolate_rgi.py", line 331, in call
indices, norm_distances = self._find_indices(xi.T)
File "C:\Users\samee\anaconda3\envs\dts\lib\site-packages\scipy\interpolate_rgi.py", line 499, in _find_indices
return find_indices(self.grid, xi)
File "_rgi_cython.pyx", line 95, in scipy.interpolate._rgi_cython.find_indices
File "stringsource", line 660, in View.MemoryView.memoryview_cwrapper
File "stringsource", line 350, in View.MemoryView.memoryview.cinit
ValueError: ndarray is not C-contiguous

Current Libraries
scipy 1.10.0
python 3.10.5
numpy 1.23.5

Formula Typo

itur/models/itu835.py line 138

Last exponent should be 4, not 3
h ** 4

Computation of sigma in ITU-R P.1853

Hello,

I might be wrong on this one, but it seems to me that your implementation of step A3 of ITU-R P.1853-1 is not exactly correct: it is using the inverse of the CDF of the normal distribution (ppf), instead of the Q function. This results in a negative sigma, which is by definition impossible.

Q = stats.norm.ppf((Pi / 100))

If I'm not mistaken, this should be easily fixed by adding a minus sign in front of stats.norm.ppf for steps A3 and C1.

Anyways, thanks for the excellent work.

Update pip package

Hello there,

First, thank you so much for this fantastic package! This will save me a lot of coding time :)

I just stumbled upon the problem of loading data with extensions in CAPS from a *nix OS. I have seen that the development version fixes this issue (from commit 79768 onwards), but somehow the version I have installed via pip (v '0.2.0') still shows this issue.

It would be great if you could update the pip package.

Thanks!

P.836 surface_water_vapour_density for out of range percentages

The handling of values < 0.1% and > 99% needs to be revised as I believe you get a nan returned at present.

This is what I did locally. But note: I am not a Python programmer so apologies in advance!

    if p in available_p:
        p_below = p_above = p
        pExact = True
    else:
        if p < available_p[0]:
            p_below = p_above = available_p[0]
            pExact = True
        elif p > available_p[len(available_p) - 1]:
            p_below = p_above = available_p[len(available_p) - 1]
            pExact = True
        else:
            pExact = False
            idx = available_p.searchsorted(p, side='right') - 1
            idx = np.clip(idx, 0, len(available_p) - 1)

            p_below = available_p[idx]
            idx = np.clip(idx + 1, 0, len(available_p) - 1)
            p_above = available_p[idx]

Runtimewarning

code :
import itur
from astropy import units as u

f = 22.5 * u.GHz # Link frequency
D = 1 * u.m # Size of the receiver antenna
el = 60 # Elevation angle constant of 60 degrees
p = 3 # Percentage of time that attenuation values are exceeded.

Generate a regular grid latitude and longitude points with 1 degrees resolution

lat, lon = itur.utils.regular_lat_lon_grid()

Comute the atmospheric attenuation

Att = itur.atmospheric_attenuation_slant_path(lat, lon, f, el, p, D)
itur.utils.plot_in_map(Att.value, lat, lon,
cbar_text='Atmospheric attenuation [dB]')

#error:
itur\models\itu618.py", line 220
np.sqrt(Lr * gammar) / f**2 - 0.45))
RuntimeWarning: invalid value encountered in sqrt

itur\models\itu618.py", line 242
-(0.655 + 0.033 * np.log(p) - 0.045 * np.log(A001) -
RuntimeWarning: divide by zero encountered in log

i copied and ran the examples file but i am facing this issue , please help me out
thank you in advance.

New version of recommendation 840 and 618

Just to notify you that recommendation 840 and 618 have been updated to version 9 and 14 as Aug 2023

The new cloud attenuation model in 840 might have meaningful impact in results since the new data corrects an overestimation of water content in tropical regions.

Reported issues

Hello,

First of all, I would like to thank you for sharing your code, I'm trying to use it to get the rain attenuation as part of a satellite link budget tool, I'm having some error messages as state below:

itu835.py:116: RuntimeWarning: invalid value encountered in power
(-34.1632 / 6.5)),

_itu618.py:220: RuntimeWarning: invalid value encountered in sqrt
np.sqrt(Lr * gammar) / f
2 - 0.45))_**

itu618.py:242: RuntimeWarning: divide by zero encountered in log
-(0.655 + 0.033 * np.log(p) - 0.045 * np.log(A001) -

The tool calculate more than 2000 points, and I having problems with this coordinates Longitude and Latitude pairs:

-70.75 -29.5
-70.75 -30.5
-70.25 -28.83
-70.25 -29.17
-70.75 -30.17
-70.75 -29.83
-70.25 -28.5
-70.25 -29.5

Thank you for your help.

Best Regards.

Lu

New version of recommendation 676

To note, recommendation 676 has been updated to version 13. It contains a new set of methods for calculation of oxygen and water vapour attenuation in Annex 2, and requires the use of climatic data contained in a new recommendation P.2145.

[BUG] 530 Documentation

I think there is a mistake in the ITU 530 documentation for the function XPD_outage_precipitation; it's description is the same as XPD_outage_clear_air:
image

PD: Thanks for the hard work!

Results from the quick-start guide do not match current implementation

Hello there.

I have been trying to reproduce the graphics shown in the quickstart guide by running the scripts shown.

However, I fail to reproduce the numeric results shown. In most cases, numbers are slightly off. Which of them should I trust?

System parameters:

  • Ubuntu 18.04 LTS
  • Python 3.6.5
  • Numpy 1.14.5
  • Matplotlib 2.2.0
  • itur 0.2.1

Below are the results I get:

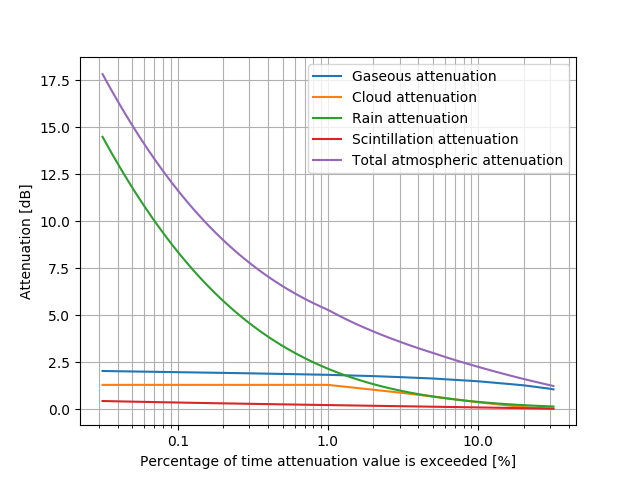
  • Single location attenuation:
    On the guide:
    Quickstart guide graph

My take:
single_location_attenuation

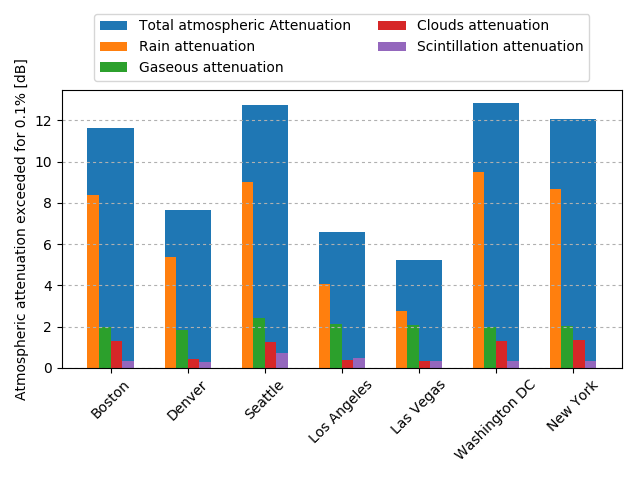
  • Multiple cities
    On the guide:
    quickstart guide
    My take:
    vectorial_operations

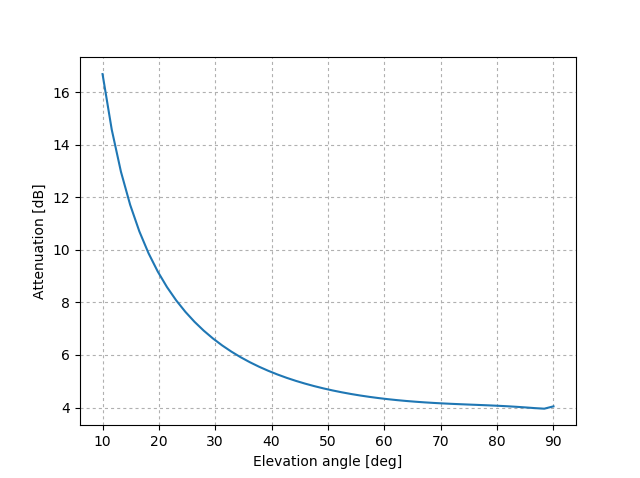
  • Dependency with link parameters
    On the guide:

    My take:
    dependency_with_link_parameters

Thanks a lot for your time!

P.676 documentation

Hello!

There are a few mistakes in the documentation of P.676:

  • In the slant_inclined_path_equivalent_height method, the argument p is described as a probability, whereas it should be a pressure (hPa). I believe it comes from the fact that the variable is lowercase, when pressure appears to use an uppercase letter P elsewhere in your code.

ITU-Rpy/itur/models/itu676.py

Lines 1446 to 1447 in ab8e82d

p : number
Percentage of the time the gaseous attenuation value is exceeded.

  • In the get_version method: it is refering to Rec. P.530.

ITU-Rpy/itur/models/itu676.py

Lines 1252 to 1253 in ab8e82d

version: int
The version of the ITU-R P.530 recommendation being used.

I can submit a pull request if needed.

[BUG] ITURpy not compatible with Scipy 1.10

Describe the bug
Changes to the interpolation functions in scipy 1.10 seem to cause most of the attenuation lookup functions to crash.

To Reproduce

pip install --upgrade scipy
python3 examples/single_location_vs_freq_el.py
....
  File "_rgi_cython.pyx", line 95, in scipy.interpolate._rgi_cython.find_indices
  File "stringsource", line 660, in View.MemoryView.memoryview_cwrapper
  File "stringsource", line 350, in View.MemoryView.memoryview.__cinit__
ValueError: ndarray is not C-contiguous

Expected behavior
Same results as for scipy 1.9.3

Additional context
As a workaround, the scipy version dependency could be pinned to 1.9.3.

P.676: object has no attribute 'gaseous_attenuation_inclined_path'

Calling itu676.gaseous_attenuation_inclined_path yields the following error:

AttributeError: '__ITU676' object has no attribute 'gaseous_attenuation_inclined_path'

I believe the missing code is this:

def gaseous_attenuation_inclined_path(self, f, el, rho, P, T, h1, h2, mode):
# Abstract method to compute the gaseous attenuation over a inclined path
fcn = np.vectorize(self.instance.gaseous_attenuation_inclined_path)
return fcn(f, el, rho, P, T, h1, h2, mode)

I added it around line 140 of itu676.py

Rain attenuation calculation in satellite communication

I'm working on LEO-1200 satellite communication, where I'm trying to compute the distance between the ground station and the satellite. Moreover, I needed to calculate topographic_altitude, rain_attenuation, and elevation_angle, but I got confused between these parameters.

lat : number, sequence, or numpy.ndarray
       Latitudes of the receiver points      #  this is the Latitudes  of the ground station 
   lon : number, sequence, or numpy.ndarray
       Longitudes of the receiver points  # this is the Longitudes of the ground station 
   lat_p : number
       Latitude projection of the point P (degrees)
   lon_p : number
       Longitude projection of the point P (degrees)
   lat_grid : number, sequence of np.ndarray
       Grid of latitude points to which compute the distance (degrees)
   lon_grid : number, sequence of np.ndarray
       Grid of longitude points to which compute the distance (degrees)
    h : float
       Orbital altitude of the satellite (km)    # this can be 1200 km
   lat_s : float
       Latitude of the projection of the satellite (degrees)
   lon_s : float
       Longitude of the projection of the satellite (degrees)

I appreciate any help you can provide.

Mismatched sections in ITU-835

In looking at itur/models/itu835.py, it looks like some of the constants from high-latitude and mid-latitude have been mixed up. The comments are also mixed up.
Example line 189 comment says high-latitude but then is followed by mid-latitude functions. Reverse on line 257.

If I look at the mid-latitude pressure function below 10 km, the polynomial is
1008.0278 - 113.2494 * h + 3.9408 * h ** 2
From the ITU document - these are the values for high-latitude summer. The high lat summer function has the mid lat values.

In addition, for mid lat summer pressure, the 10 < h <= 72 range exponent constant should be -0.147 but is -0.140 in code (line 213).

I have not yet gone through all situations, but it appears these formulas are all correctly represented in your other library (ITURPropagPY).

r618-13

the R618-13 allows probability of the attenuation being exceeded in the range 50% to 0.001%. Therefore the warning message:"RuntimeWarning: The method to compute the rain attenuation in recommendation ITU-P 618-12 is only valid for unavailability values between 0.001 and 5" need to be corrected.

cannot run

I have installed itur as instructions, but when I run examples, there are still a lot of warnings and errors.
for example, I run
import itur
import numpy as np
import matplotlib.pyplot as plt
import astropy.units as u
from astropy.units import imperial
u.imperial.enable()
f = 22.5 * itur.u.GHz # Link frequency
D = 1 * itur.u.m # Size of the receiver antenna
el = 60 # Elevation angle constant of 60 degrees
p = 3 # Percentage of time that attenuation values are exceeded.
Generate a regular grid latitude and longitude points with 1 degrees resolution
lat, lon = itur.utils.regular_lat_lon_grid()
Comute the atmospheric attenuation
Att = itur.atmospheric_attenuation_slant_path(lat, lon, f, el, p, D)
itur.utils.plot_in_map(Att.value, lat, lon, cbar_text='Atmospheric attenuation [dB]')

then I get:

itur\models\itu618.py:220: RuntimeWarning: invalid value encountered in sqrt
np.sqrt(Lr * gammar) / f**2 - 0.45))
C:\Users\LENOVO\AppData\Local\Packages\PythonSoftwareFoundation.Python.3.9_qbz5n2kfra8p0\LocalCache\local-packages\Python39\site-packages\itur\models\itu618.py:242: RuntimeWarning: divide by zero encountered in log
-(0.655 + 0.033 * np.log(p) - 0.045 * np.log(A001) -
Traceback (most recent call last):
File "D:\test.py", line 18, in
itur.utils.plot_in_map(Att.value, lat, lon, cbar_text='Atmospheric attenuation [dB]')
AttributeError: module 'itur.utils' has no attribute 'plot_in_map'

ModuleNotFoundError: No module named 'mpl_toolkits.basemap'

Hi! I'm running the following code:

import itur
import astropy.units as u

f = 22.5 * itur.u.GHz  # Link frequency
D = 1 * itur.u.m  # Size of the receiver antenna
el = 60  # Elevation angle constanf 60 degrees
p = 3  # Percentage of time that attenuation values are exceeded.

# Generate a regular grid latitude and longitude points with 1 degrees resolution
lat, lon = itur.utils.regular_lat_lon_grid()

# Comute the atmospheric attenuation
Att = itur.atmospheric_attenuation_slant_path(lat, lon, f, el, p, D)
itur.utils.plot_in_map(Att.value, lat, lon,
                       cbar_text='Atmospheric attenuation [dB]')

I am getting the following error when running the sample file:

❯ python itur-example.py     

./venv/lib/python3.6/site-packages/itur/models/itu618.py:220: RuntimeWarning: invalid value encountered in sqrt
  np.sqrt(Lr * gammar) / f**2 - 0.45))
./venv/lib/python3.6/site-packages/itur/models/itu618.py:242: RuntimeWarning: divide by zero encountered in log
  -(0.655 + 0.033 * np.log(p) - 0.045 * np.log(A001) -
Traceback (most recent call last):
  File "./venv/lib/python3.6/site-packages/itur/utils.py", line 372, in plot_in_map
    from mpl_toolkits.basemap import Basemap
ModuleNotFoundError: No module named 'mpl_toolkits.basemap'

During handling of the above exception, another exception occurred:

Traceback (most recent call last):
  File "itur-example.py", line 15, in <module>
  File "./venv/lib/python3.6/site-packages/itur/utils.py", line 374, in plot_in_map
    raise RuntimeError('Basemap is not installed and therefore plot_in_map'
RuntimeError: Basemap is not installed and therefore plot_in_map cannot be used

The error is related to the Basemap package, however this package is deprecated. Could the error have come from the line below?

https://github.com/iportillo/ITU-Rpy/blob/6ca239f8fc84d88ea4de5bc62ed7a7822de0b1ab/itur/utils.py#L372

Any suggestions to work around the problem?

Recommend Projects

  • React photo React

    A declarative, efficient, and flexible JavaScript library for building user interfaces.

  • Vue.js photo Vue.js

    🖖 Vue.js is a progressive, incrementally-adoptable JavaScript framework for building UI on the web.

  • Typescript photo Typescript

    TypeScript is a superset of JavaScript that compiles to clean JavaScript output.

  • TensorFlow photo TensorFlow

    An Open Source Machine Learning Framework for Everyone

  • Django photo Django

    The Web framework for perfectionists with deadlines.

  • D3 photo D3

    Bring data to life with SVG, Canvas and HTML. 📊📈🎉

Recommend Topics

  • javascript

    JavaScript (JS) is a lightweight interpreted programming language with first-class functions.

  • web

    Some thing interesting about web. New door for the world.

  • server

    A server is a program made to process requests and deliver data to clients.

  • Machine learning

    Machine learning is a way of modeling and interpreting data that allows a piece of software to respond intelligently.

  • Game

    Some thing interesting about game, make everyone happy.

Recommend Org

  • Facebook photo Facebook

    We are working to build community through open source technology. NB: members must have two-factor auth.

  • Microsoft photo Microsoft

    Open source projects and samples from Microsoft.

  • Google photo Google

    Google ❤️ Open Source for everyone.

  • D3 photo D3

    Data-Driven Documents codes.