ivis-at-bilkent / cytoscape.js-graphml Goto Github PK
View Code? Open in Web Editor NEWA Cytoscape.js extension to import from and export to GraphML format
License: MIT License
A Cytoscape.js extension to import from and export to GraphML format
License: MIT License


I've attempted to use the demo.html output xml to test importing from a div via jquery
this.graphml($("#data").html())
but this doesn't seem to be loading anything. Is there an example of how this is supposed to work that is loading actual xml?
I've also tried to run some exports from ruby pacer and it complains about the xml format.
Hello everyone,
I like to work with components which can be defined via the parent property (https://js.cytoscape.org/#notation/compound-nodes)
However, I do not define my network graph by hand my load a graphml-file via cytoscape.js-graphml:
        var cy = window.cy = cytoscape({
        container: document.getElementById('cy'),
         ready: function () {
             this.graphml({layoutBy: 'random'});
             this.graphml(graphStr);
         }
        });
The graphml file looks like :
<?xml versi

    on='1.0' encoding='utf-8'?>
    <graphml xmlns="http://graphml.graphdrawing.org/xmlns" xmlns:xsi="http://www.w3.org/2001/XMLSchema-instance" xsi:schemaLocation="http://graphml.graphdrawing.org/xmlns http://graphml.graphdrawing.org/xmlns/1.0/graphml.xsd"><key attr.name="relationship" attr.type="string" for="edge" id="d8"/>

    <key attr.name="node_name" attr.type="string" for="node" id="d0"/>
    <key attr.name="parent" attr.type="long" for="node" id="d1"/>
    <graph edgedefault="directed">
    <node id="123">
      <data key="d0">First</data>
      <data key="d1">0</data>
    </node>
    <node id="124">
      <data key="d0">Second</data>
      <data key="d1">1</data>
    </node>
    ...
Where d1 indicates the parent/component id. The question is, how do I define the parent variable of a node afterward. The graphml is automatically generated and can not be modified.
THX Lazloo
Hello,
somehow (maybe due to the graphml specification) the attribute "type" is not recognized as an edge attribute. Therefore line 167
settings[$data.attr("type")][$data.attr("key")] = $data.text();
can't work. Obviously the type-attribute isn't set in line 95.
Therefore i solved this by directly accessing the data-field:
settings["data"][$data.attr("key")] = $data.text();
This is not pretty and not very flexible but it works for me.
Kind regards
Bastian
When generating XML, special XML characters in XML (&,<,>,") are not encoded properly, leading to invalid XML.
Either pack all values into CDATA or check/replace the special characters - something like:
function escapeXml(unsafe) {
return unsafe.replace(/[<>&'"]/g, function (c) {
switch (c) {
case '<': return '<';
case '>': return '>';
case '&': return '&';
case ''': return ''';
case '"': return '"';
}
});
}
Adding some interaction (user input) to demo file might be helpful.
deleting graph elements could also be useful
Hi, thanks for this, it's very useful for peeps working on the server side of things 👍
How do i use this in a vanilla js setting, aka in a browser?
I am new to cytoscape and don't do much js, so am grateful for your patience.
Hey,
i tried to export a graph which has several fields in the data-object.
The exported XML contains the nodes with the correct data fields, eg.:
<node id="a">
  <data type="data" key="label">George</data>
</node>
When i assigned such a label to an edge it is exported in an other format like:
<edge id="abc" source="a" target="b">
  <data key="label">[object Object]</data>
</edge>
The [object Object] should be also "George", but actually it isn't.
I assigned the data via (where selected is either a node or an edge):
var content = "George";
selected.data('label', content);
best regards
Bastian
Hi there I'm using networkx on backend to do heavy lifting and cytoscape.js on frontend to display graph. I've tried to import graphml file generated from networkx but got the following error.
ERROR TypeError: Cannot set property 'd0' of undefined

Here are contents of graphml file.
<?xml version='1.0' encoding='utf-8'?>
<graphml xmlns="http://graphml.graphdrawing.org/xmlns" xmlns:xsi="http://www.w3.org/2001/XMLSchema-instance" xsi:schemaLocation="http://graphml.graphdrawing.org/xmlns http://graphml.graphdrawing.org/xmlns/1.0/graphml.xsd">
  <key attr.name="weight" attr.type="long" for="edge" id="d2" />
  <key attr.name="max" attr.type="long" for="node" id="d1" />
  <key attr.name="min" attr.type="long" for="node" id="d0" />
  <graph edgedefault="directed">
    <node id="a">
      <data key="d0">0</data>
      <data key="d1">2</data>
    </node>
    <node id="b">
      <data key="d0">0</data>
      <data key="d1">3</data>
    </node>
    <edge source="a" target="b">
      <data key="d2">-4</data>
    </edge>
  </graph>
</graphml>
Any help will be appreciated.
Hi I tried using thecytoscape-graphml library to download my network in .graphml format but it didnt work. I had the below error:

Below is the code which I have:
    const downloadPng = (cyToDownload, picFormat) => {
      if (picFormat == 'png') {
        const png = cyToDownload.png()
        var a = document.createElement("a"); //Create <a>
        a.href = png
        a.download = "local_network.png"; //File name Here
        a.click(); //Download file
      } else if (picFormat == 'jpg') {
        const jpg = cyToDownload.jpg()
        var a = document.createElement("a"); //Create <a>
        a.href = jpg
        a.download = "local_network.jpg"; //File name Here
        a.click(); //Download file
      } else if (picFormat == 'svg') {
        console.log("download func called")
        const svgPic = cyToDownload.svg()
        console.log(svgPic)
        var a = document.createElement("a"); //Create <a>
        a.href = svgPic
        a.download = "local_network.svg"; //File name Here
        a.click(); //Download file
      }
  }
So my functions to download my network in png, jpg and svg work, so I don't know why it can't download the network in .graphml format. Could I get some help please?
At the start of my script, I have imported the module as follows, however the graphml seems to be coloured differently, is there an error in the importing?
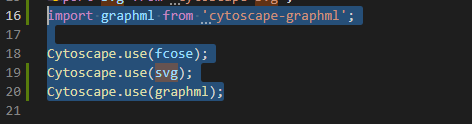
Thank you
Jonathan
Hello everyone,
I have an autogenerate graphml file like:
<?xml versi

    on='1.0' encoding='utf-8'?>
    <graphml xmlns="http://graphml.graphdrawing.org/xmlns" xmlns:xsi="http://www.w3.org/2001/XMLSchema-instance" xsi:schemaLocation="http://graphml.graphdrawing.org/xmlns http://graphml.graphdrawing.org/xmlns/1.0/graphml.xsd"><key attr.name="relationship" attr.type="string" for="edge" id="d8"/>

    <key attr.name="node_name" attr.type="string" for="node" id="d0"/>
    <key attr.name="parent" attr.type="long" for="node" id="d1"/>
    <graph edgedefault="directed">
    <node id="123">
      <data key="d0">First</data>
    </node>
    <node id="124">
      <data key="d0">Second</data>
      <data key="d1">First</data>
    </node>
    ...
Currenty the node attributes in the final data are represented by the keys (d0 and d1). However, when I add a new attribute, the order changes and therefore the attribute name vs. id association.
Is it possible to add the attributes by name (node_name and parent)?
THX Lazloo
Is there a plan to add an option to apply a selector option to either the nodes or edges?
This behavior is not documented :(
Complex data sholud be allowed to be exported. As XML or at least stringified JSON.
It should also be possible to import the result correctly.
It would be even better if user is allowed to pass a callback to transform data as one wishes.
I am trying to export the graph as graphml file and save it locally. Its working. However the code structure is not preserved. Means the line breaks and indentations are not there.
This is how I am exporting:
var blob = new Blob([cy.graphml()], {type: "text/plain;charset=UTF-8"});
saveAs(blob, "testfile.graphml");
Please try the following link:
https://tonicdev.com/metincansiper/57b6c9db010a52150018085e
1-) I have an cytoscape.js graph. Ideally it looks like below

2-) If I empty styles of cytoscape by executing js code cy.style([]), graph looks like below

3-) If I set cytoscape style with a command like cy.style([/* some big array object */ ]) it becomes as the ideal like the first image.
4-) When I execute cy.graphml() on first image to generate xml. Then load using command cy.grapml('xml string previously generated') on a empty canvas I get

5-) As could be seen from above image, graphml does not preserve style information (I tried with css: true also). When I apply the old styles like in step 3, I expect to see a graph like first image but it does not. The above image doesn't change a bit
6-) When I give the same object as a string like cy.style('[/* some big array object */ ]') it gives me a bit more stylish graph (below image)

Setting a
stylebypass at element creation is deprecated
warning is popping for each node in the graph that is being converted.
To test it the graph below can be used:
<graphml xmlns="http://graphml.graphdrawing.org/xmlns"
    xmlns:xsi="http://www.w3.org/2001/XMLSchema-instance"
    xsi:schemaLocation="http://graphml.graphdrawing.org/xmlns
     http://graphml.graphdrawing.org/xmlns/1.0/graphml.xsd">
  <graph id="G" edgedefault="undirected">
    <node id="n0">
      <data key="height">40</data>
      <data key="width">60</data>
    </node>
    <node id="n1">
      <data key="height">40</data>
      <data key="width">60</data>
    </node>
    <node id="n2">
      <data key="height">30</data>
      <data key="width">30</data>
    </node>
    <node id="n3">
      <data key="height">30</data>
      <data key="width">30</data>
    </node>
    <node id="n4">
      <data key="height">50</data>
      <data key="width">45</data>
    </node>
    <node id="n5">
      <data key="height">45</data>
      <data key="width">45</data>
    </node>
    <node id="n6">
      <data key="height">10</data>
      <data key="width">10</data>
    </node>
    <node id="n7"/>
    <node id="n8"/>
    <node id="n9"/>
    <node id="n10">
      <data key="height">15</data>
      <data key="width">15</data>
    </node>
    <edge id="e0" source="n0" target="n2"/>
    <edge id="e1" source="n1" target="n2"/>
    <edge id="e2" source="n2" target="n3"/>
    <edge id="e3" source="n3" target="n5"/>
    <edge id="e4" source="n3" target="n4"/>
    <edge id="e5" source="n4" target="n6"/>
    <edge id="e6" source="n6" target="n5"/>
    <edge id="e7" source="n5" target="n7"/>
    <edge id="e8" source="n6" target="n8"/>
    <edge id="e9" source="n8" target="n7"/>
    <edge id="e10" source="n8" target="n9"/>
    <edge id="e11" source="n8" target="n10"/>
  </graph>
</graphml>
Bug:
var layoutOptT = typeof options.layoutBy;
if (layoutOptT == "string")
  cy.layout({name: "cose"});
else if (layoutOptT == "function")
  options.layoutBy();
must be:
var layoutOptT = typeof options.layoutBy;
if (layoutOptT != "string")
  cy.layout({name: "cose"});
else if (layoutOptT == "function")
  options.layoutBy();
For the graph below with the layout option "preset" initial positions of the nodes are lost
<?xml version="1.0" encoding="UTF-8"?>
<graphml xmlns="http://graphml.graphdrawing.org/xmlns"
    xmlns:xsi="http://www.w3.org/2001/XMLSchema-instance"
    xsi:schemaLocation="http://graphml.graphdrawing.org/xmlns
     http://graphml.graphdrawing.org/xmlns/1.0/graphml.xsd">
  <graph id="G" edgedefault="undirected">
    <node id="n0"/>
	    <data key="x">122.50374073928583</data>
		<data key="y">367.98329788349827</data>
    <node id="n1"/>
	    <data key="x">100</data>
		<data key="y">300</data>
    <node id="n2"/>
	    <data key="x">150</data>
		<data key="y">300</data>
    <node id="n3"/>
    <node id="n4"/>
    <node id="n5"/>
    <node id="n6"/>
    <node id="n7"/>
    <node id="n8"/>
    <node id="n9"/>
    <node id="n10"/>
    <edge source="n0" target="n2"/>
    <edge source="n1" target="n2"/>
    <edge source="n2" target="n3"/>
    <edge source="n3" target="n5"/>
    <edge source="n3" target="n4"/>
    <edge source="n4" target="n6"/>
    <edge source="n6" target="n5"/>
    <edge source="n5" target="n7"/>
    <edge source="n6" target="n8"/>
    <edge source="n8" target="n7"/>
    <edge source="n8" target="n9"/>
    <edge source="n8" target="n10"/>
  </graph>
</graphml>
A declarative, efficient, and flexible JavaScript library for building user interfaces.
🖖 Vue.js is a progressive, incrementally-adoptable JavaScript framework for building UI on the web.
TypeScript is a superset of JavaScript that compiles to clean JavaScript output.
An Open Source Machine Learning Framework for Everyone
The Web framework for perfectionists with deadlines.
A PHP framework for web artisans
Bring data to life with SVG, Canvas and HTML. 📊📈🎉
JavaScript (JS) is a lightweight interpreted programming language with first-class functions.
Some thing interesting about web. New door for the world.
A server is a program made to process requests and deliver data to clients.
Machine learning is a way of modeling and interpreting data that allows a piece of software to respond intelligently.
Some thing interesting about visualization, use data art
Some thing interesting about game, make everyone happy.
We are working to build community through open source technology. NB: members must have two-factor auth.
Open source projects and samples from Microsoft.
Google ❤️ Open Source for everyone.
Alibaba Open Source for everyone
Data-Driven Documents codes.
China tencent open source team.