Giter VIP home page Giter VIP logo

likert's Introduction

Analysis and Visualization of Likert Based Items

Author: Jason Bryer, Ph.D.
Website: https://jbryer.github.io/likert/

Build Status CRAN_Status_Badge Downloads

likert is an R package designed to help analyzing and visualizing Likert type items. More information can be obtained at https://jbryer.github.io/likert. Also, the included demo demonstrates many of the features.

Download the 2013 useR! Conference abstract and slides.

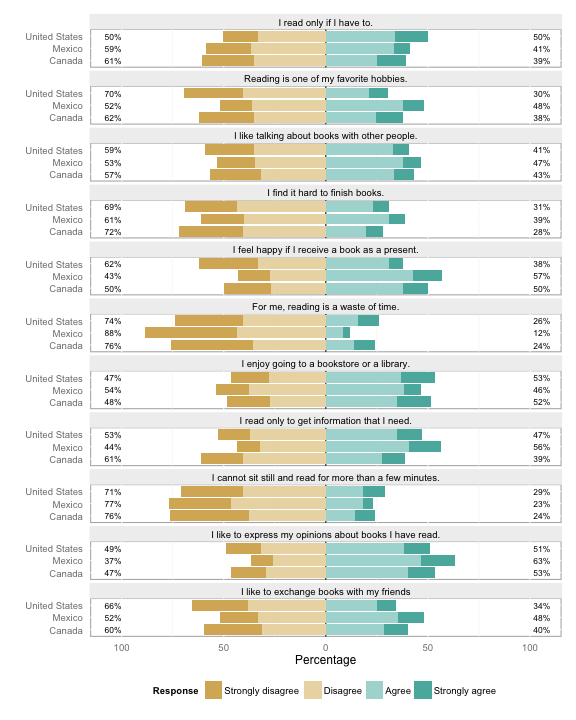
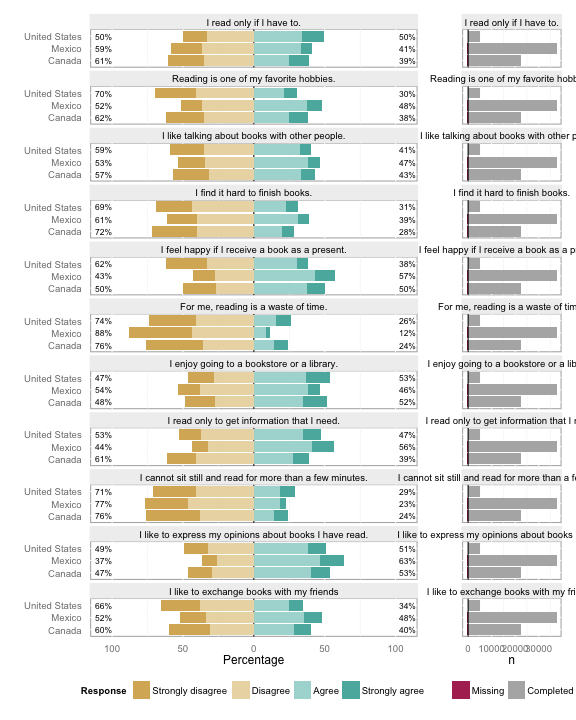
Reading Attitude Reading Attitude with Histogram

The latest development version can be downloaded using the devtools package.

remotes::install_github('jbryer/likert')

To get started take a look at the likert demo or from within R:

demo('likert', package='likert')

Or run the Shiny app:

shinyLikert()
``

likert's People

Contributors

abidawson avatar arcaldwell49 avatar compstats avatar daroczig avatar ezequielscott avatar gkalvelage avatar jbryer avatar kspeer avatar leeper avatar lemna avatar m-dev- avatar mine-cetinkaya-rundel avatar sipemu avatar sumidu avatar talgalili avatar

Stargazers

 avatar  avatar  avatar  avatar  avatar  avatar  avatar  avatar  avatar  avatar  avatar  avatar  avatar  avatar  avatar  avatar  avatar  avatar  avatar  avatar  avatar  avatar  avatar  avatar  avatar  avatar  avatar  avatar  avatar  avatar  avatar  avatar  avatar  avatar  avatar  avatar  avatar  avatar  avatar  avatar  avatar  avatar  avatar  avatar  avatar  avatar  avatar  avatar  avatar  avatar  avatar  avatar  avatar  avatar  avatar  avatar  avatar  avatar  avatar  avatar  avatar  avatar  avatar  avatar  avatar  avatar  avatar  avatar  avatar  avatar  avatar  avatar  avatar  avatar  avatar  avatar  avatar  avatar  avatar  avatar  avatar  avatar  avatar  avatar  avatar  avatar  avatar  avatar  avatar  avatar  avatar  avatar  avatar  avatar  avatar  avatar  avatar  avatar  avatar  avatar

Watchers

 avatar  avatar  avatar  avatar  avatar  avatar  avatar  avatar  avatar  avatar  avatar  avatar  avatar  avatar  avatar  avatar  avatar  avatar  avatar  avatar

likert's Issues

Add ability to specify height for bars

When creating the stacked barcharts, would it be possible to add an optional parameter to limit or set the height of the bar? Grouped barcharts usually look pretty good because there are multiple likert questions and so it looks reasonable. However, for a barchart with a single likert item, the bars themselves are very tall and take up a lot of space.

Adding support for Survey Weights

Hey,
Thanks for the neat package. For many surveys, the data comes with weights that allow for estimating totals.

I don't think it would be difficult to adjust likert to work with weights. Would you consider a pull request?

Regards

Change size of text labels on the plot?

Firstly, thanks jbryer for an awesome library. Top effort.

Quick question though: how do I change the size of the text labels on the plot in my likert bar plot? I can easily change axis text sizes using theme() but unsure how to change the size of the % values displayed on the plot.

I've labelled the points I mean below:

_bh-survey-_rstudio-6

error in likert(…, grouping = grouping)

likert() throws an error, if there is a variable with unused levels, and grouping is used.

library(likert)
library(reshape)

df <- data.frame(matrix(c(1,1,1,1,2,1,2,2), 4))

df[,1] <- factor(df[,1], 1:2)
df[,2] <- factor(df[,2], 1:2)

gr <- c(1,1,2,2)

likert(df, grouping=gr, nlevels=2)

output is:

Error in fix.by(by.y, y) : 'by' must specify uniquely valid columns

Warning when installing the package

When I follow the procedure given in README file, ie:

require(devtools)
install_github('likert', 'jbryer')

then I get the following error message:
Username parameter is deprecated. Please use jbryer/likert

I guess that the README file should be updated or I'm missing something?

error in plot(..., include.histogram = TRUE)

I get an Error trying to plot bar charts including histogram, w/o works fine.

Error in [<-.data.frame(*tmp*, hist$missing, , value = list(missing = c(NA, :
missing values are not allowed in subscripted assignments of data frames
In addition: Warning messages:
1: In [<-.factor(*tmp*, ri, value = c(26L, 4L)) :
invalid factor level, NA generated
2: In [<-.factor(*tmp*, ri, value = c(23L, 7L)) :
invalid factor level, NA generated
3: In [<-.factor(*tmp*, ri, value = c(29L, 1L)) :
invalid factor level, NA generated
4: In [<-.factor(*tmp*, ri, value = c(30L, 30L)) :
invalid factor level, NA generated
5: In [<-.factor(*tmp*, ri, value = c(28L, 2L)) :
invalid factor level, NA generated
6: In [<-.factor(*tmp*, ri, value = c(28L, 2L)) :
invalid factor level, NA generated
7: In [<-.factor(*tmp*, ri, value = c(30L, 30L)) :
invalid factor level, NA generated
8: In [<-.factor(*tmp*, ri, value = c(26L, 4L)) :
invalid factor level, NA generated
9: In Ops.factor(-1, hist[hist$missing, ]$value) :

  • not meaningful for factors

Output error integrating with tikzDevice package

I run into errors when I attempt to output my divergent stacked bar to native TeX code using tikZDevice package. I get the impression it has something to do with the % sign in the resulting graph.

Error I get is below and code and data I am working with is here [1]

[1] https://gist.github.com/phiri/936acb5a12d3b5721c10

Error log

File: epstopdf-sys.cfg 2010/07/13 v1.3 Configuration of (r)epstopdf for TeX Liv
e
))
Preview: Fontsize 10pt
Preview: PDFoutput 1
! Undefined control sequence.
l.19 \path
let \p1 = ($(TeX.east) - (TeX.west)$),
Here is how much of TeX's memory you used:
11606 strings out of 493308
234511 string characters out of 6137822
262787 words of memory out of 5000000
14865 multiletter control sequences out of 15000+600000
4403 words of font info for 15 fonts, out of 8000000 for 9000
957 hyphenation exceptions out of 8191
55i,3n,54p,416b,485s stack positions out of 5000i,500n,10000p,200000b,80000s

! ==> Fatal error occurred, no output PDF file produced!
Error in getMetricsFromLatex(TeXMetrics) :
TeX was unable to calculate metrics for the following string
or character:

    12%

Common reasons for failure include:

  • The string contains a character which is special to LaTeX unless
    escaped properly, such as % or $.
  • The string makes use of LaTeX commands provided by a package and
    the tikzDevice was not told to load the package.

The contents of the LaTeX log of the aborted run have been printed above,
it may contain additional details as to why the metric calculation failed.
Calls: ... tryCatchList -> evalFunc -> print -> print.likert.bar.plot
Execution halted

Error in abs(x) : non-numeric argument to mathematical function

Your library looks great, more flexible than HH likert. I really like the centered plots, but want to be able to do them split over different categories. I was able to create a simple likert item, and also one split by categories, following your example. (My columns are ordered categorical). Printing the likert item, or doing summary() on it works perfectly, but when I try to plot it, I get

Error in abs(x) : non-numeric argument to mathematical function

Traceback:
Error in abs(x) : non-numeric argument to mathematical function

7: is.data.frame(x)
6: rowSums(abs(x))
5: force(rightAxisLabels)
4: plot.likert.default(a)
3: plot.likert(a)
2: plot(a)
1: plot(a)

(I tried with various plot options). Let me know what I can do to debug this issue further, I'd love to get it to work (unfortunately I can't share the dataset).

Stian

Potentially incorrect grouping (at least for some data sets)

I am trying to run this sample data using the latest version of the package (3c95d76) and the grouped scale (likert (df2, grouping=df$Group)) returns likert object with zero responses.

Looks like this code in likert.R fails to merge results with t data frames properly because results$Response is an int and not a factor.

The issues seems to be caused by fact that results$Response column is converted to factors after the for loop and after the merge.

  results$Response <- factor(results$Response, levels=1:nlevels, labels=levels(items[,i]))  

I tried moving this line just before the loop (right after results data frame is created) and then grouping works correctly in my tests with this data set, example from the package and a few of my data sets. I had to hardcode the levels to be take from the first column (levels(items[,1])) assuming that all levels of the scale are the same. Which may or may not be correct in some cases, but only one scale could be used along the x axis anyway.

Error when the amount of factor levels are unequal

Hi I get an error when creating a plot item using the likert function. The error occurs because the factor levels in each variable differs, This is however not a mistake but just a result of small survey data. And in theory it could happen with larger data sets as well. (see example below)

data  <- data.frame(
  q1 = ordered(sample(c("Strongly Agree", "Agree", "Disagree", "Strongly disagree"),500, replace=T)),
  q2 = ordered(sample(c("Strongly Agree", "Disagree", "Strongly disagree"),500, replace=T)),
  q3 = ordered(sample(c("Strongly Agree", "Agree", "Disagree", "Strongly disagree"),500, replace=T)),
  q4 = ordered(sample(c("Strongly Agree", "Agree", "Strongly disagree"),500, replace=T)))

# Doesn't work
item1          <- likert(data)

I would like to suggest adding to your function a way to deal with this. Below is a code that provides the "missing levels". However its not ready to be implemented with your code yet. But maybe you'll have a better take on that than me?

# Append missing levels
n.levels   <- sapply(data,nlevels)
max.levels <- levels(data[,which.max(n.levels)])

for (i in seq_along(data)) {
  mis.lev = which(!max.levels %in% levels(data[,i]))
  levels(data[,i]) = append(levels(data[,i]),max.levels[mis.lev])
}

# Now it plots, but values for q4 and q2 is wrong. 
item1          <- likert(data)
plot(item1)

Bug in likert.bar.plot when 'ordered = TRUE'

Hi,

I'm trying to plot a centered Likert scale.
When summarizing the Likert object with ordered = TRUE, it looks all good:
image
However, when plotting this object, the order is not respected:
image
As you can see, 'Protocoles' is not on the top of the plot. Seems like the plot is sorted according to alphabetical order...
Any help would be much appreciated !
Thanks in advance,

MLU

Potential bug with likert function

Hi,

New to the 'likert' package (very good BTW). I am getting an error when using the likert() function on a dataset:

Error in likert(website) :
All items (columns) must have the same number of levels\

The problem seems to be that I have one response vector without a 'Disagree' response from at least one subject.

Is there are work around for this problem?

Any help appreciated.

Cheers.

plot.percents for groups

It seems that percentages are only plotted for non-grouped charts.

For example when I run:
plot(l24g,plot.percents=TRUE)

It doesn't show the percentages. Am I doing something wrong?

Example doesn't work

The Pisana example does not work:

> data(pisana)
> items28 = pisana[, substr(names(pisana), 1, 5) == "ST24Q"]
> 
> items28 <- rename(items28, c(ST24Q01 = "I read only if I have to.", ST24Q02 = "Reading is one of my favorite hobbies.", 
+                              ST24Q03 = "I like talking about books with other people.", ST24Q04 = "I find it hard to finish books.", ST24Q05 = "I feel happy if I receive a book as a present.", 
+                              ST24Q06 = "For me, reading is a waste of time.", ST24Q07 = "I enjoy going to a bookstore or a library.", ST24Q08 = "I read only to get information that I need.", 
+                              ST24Q09 = "I cannot sit still and read for more than a few minutes.", ST24Q10 = "I like to express my opinions about books I have read.", 
+                              ST24Q11 = "I like to exchange books with my friends"))
> 
> for (i in 1:ncol(items28)) {
+     items28[, i] = factor(items28[, i], levels = 1:4, labels = c("Strongly disagree", "Disagree", "Agree", "Strongly Agree"), 
+                           ordered = TRUE)
+ }
Error in `[.data.frame`(items28, , i) : undefined columns selected
5: stop("undefined columns selected")
4: `[.data.frame`(items, , 1)
3: items[, 1]
2: levels(items[, 1]) at likert.R#32
1: likert(items28)

Grouping histograms

jbryer,

Thanks for this package. It works nicely. I only have one issue I cannot deal with (I'm kind of new to r):

By default Likert items are plotted "by amount". I can change this and plot Likert items grouping them manually. The thing is that I added also a histogram, but it is ordered as the Likert items were in the first place, and Likert-histogram items do not match. I can find no way of rearranging histograms too...

Thanks in advance!

When there are zero counts and when grouping argument is used, proportions are shifted, even when nlevels is used.

Issue?

When there are zero counts (i.e., missing levels) and when grouping argument is used, proportions seem to be shifted.

e.g.,
In reality, proportions should be something like 0%, 20%, 20%, 20%, 20%, 20%.
But when the 'grouping' argument is used in likert, e.g., likert(items,..., grouping=group, nlevels=6), the proportions that appear are shifted, e.g., 20%, 20%, 20%, 20%, 20%, 0%.

Have I missed or misunderstood something??

Set up

There are four items in this data, with 6 possible levels to be endorsed (1 to 6).
On Item 4, there are zero counts on level 1.

library(likert)
library(dplyr)

group<-rep(c('n', 's'), each=30)
dat <-data.frame(item1=rep(1:6, 10), item2=rep(1:6, 10) ,item3=rep(1:6, 10), item4=rep(2:6, 12))
apply(dat, 2, table)     _**#item 4 has zero counts on level 1**`

Use base r to obtain proportions by 'group'

apply(dat[group=='n', ], 2, table) 
apply(dat[group=='n', ], 2, function(x) round(prop.table(table(x)),2))

#group s
apply(dat[group=='s', ], 2, table) 
apply(dat[group=='s', ], 2, function(x) round(prop.table(table(x)),2))

Use Likert function on a subset of data, without defining a grouping factor

#           Get proportions using Likert, but without grouping argument
lik.1 <- likert(data.frame(lapply(dat[group=='n', ], factor, levels=1:6)), nlevels=6)
round(lik.1$results[,-1],2)

Use Likert function on a subset of data, after defining a grouping factor

lik.2 <- likert(data.frame(lapply(dat, factor, levels=1:6)), grouping=group, nlevels=6)
round(subset(lik.2$results, select=-c(Group, Item)),2)

Compare

# check
# base
table(dat[group=='n',]$item4)
table(dat[group=='n',]$item4) %>% prop.table %>% round(., 2)


lik.1$results[4,]   # Likert without grouping argument
lik.2$results[4,]  # Likert with grouping argument 

too much overlay when plot.percents = T and factor levels are odd number

Centered level's percent is displayed twice, once as a sum and once split into 2 parts, when plot.percents = T and factor levels are odd numbers.

plot(l29, plot.percents = T) + ggtitle(title)
rendered the plot below.
image

plot(l29, plot.percents = T, plot.percent.neutral= F) + ggtitle(title)
gives
image

I think maybe it is better if only the total percent of centered level is displayed. Probably it is not a big problem , since one can always set plot.percents = F and add a geom_text layer separately to fix this.

Thank you for the great package!

Likert and Knitr rendering problems

Hi,

I've come upon some issues when trying to render Likert bar plots via Knitr.

  1. wrap attribute has no effect in Knitr rendered document
  2. grouped plots are squeezed and unreadable when rendered via Knitr: normal, knitr

When doing the same Likert calls in RStudio console, everything is just fine and works as expected. See screenshots above.

Are these known and hopefully fixable issues? Thank you!

Getting "All items must be same level" error with items with the same levels

Hi!

I am having an issue using the likert() function. My data has all the same levels, c("Disagree", "Somewhat Disagree", "Neither", "Somewhat Agree", "Agree"). I have four variables, all factors and in the appropriate order. When I go to use the likert() function, I get the "All items (columns) must have the same number of levels" error. I looked at the help file for likert(), and I noticed that the nlevels argument defaults to length(levels(items[, 1])). While I get the levels calling my data with $, e.g. Hello$Q13, I do not get the levels when subsetting like you do in the help file, e.g. Hello[ ,1]. I do not know if this is what is causing the problem. Is this a common problem? Is there a way to solve this? My code is below. Thank you in advance for any help you may provide.

#Read in data.
Hello <- read_csv("Hello.csv")

#Convert to factors. #Labels have been changed to 1, 2, 3, 4, 5
Hello$Q13_1 <- as.factor(Hello$Q13_1)
Hello$Q13_2 <- as.factor(Hello$Q13_2)
Hello$Q13_3 <- as.factor(Hello$Q13_3) #Skip Q13_4
Hello$Q13_5 <- as.factor(Hello$Q13_5)

#Rename variables
Hello1 <- rename(Hello, c("Q13_1" = "A gluten free diet would help someone lose weight.", "Q13_2" = "A gluten free diet would enhance someone's athletic performance.", "Q13_3" = "A gluten free diet would improve the quality of someone's skin.", "Q13_5" = "A gluten free diet would improve someone's memory, clarity, and overall cognitive function."))

#Use likert() function
l4 <- likert(Hello1)

To guide things, here is the output when finding the levels.

levels(Hello1$A gluten free diet would help someone lose weight.)
[1] "1" "2" "3" "4" "5"

levels(Hello[,1])
NULL

Again, thank you in advance for your help! Much appreciated.

Facet order reverts to alphabetical in grouped bar plot

The grouped bar plots displays facet items in alphabetical order, regardless of the order of columns from the original data frame.

Using the demo data:

require(likert)
data(pisaitems)

items29 <- pisaitems[,substr(names(pisaitems), 1,5) == 'ST25Q']
names(items29) = c("Magazines", "Comic books", "Fiction", "Non-fiction books", "Newspapers")

l29g <- likert(items29, grouping=pisaitems$CNT)
plot(l29g)

image

I expect the book categories to be listed in the order of the input data:

c("Magazines", "Comic books", "Fiction", "Non-fiction books", "Newspapers")

The factor levels are specified according to the original data frame's column order in the likert object and ggplot data.

levels(l29g$results$Item)
[1] "Magazines"         "Comic books"       "Fiction"           "Non-fiction books" "Newspapers" 

a <- plot(l29g)
levels(a$data$Item)
[1] "Magazines"         "Comic books"       "Fiction"           "Non-fiction books" "Newspapers"       

b <- print(l29g)
levels(b$Item)
[1] "Magazines"         "Comic books"       "Fiction"           "Non-fiction books" "Newspapers"    

Interestingly, the summary method for the likert object has the item levels in alphabetical order.

c <- summary(l29g)
levels(c$Item)
[1] "Comic books"       "Fiction"           "Magazines"         "Newspapers"        "Non-fiction books"

I suspect this is due to the method used by summary to create the data frame, as seen at https://github.com/jbryer/likert/blob/master/R/summary.likert.r#L94. However, if I change line 95 (https://github.com/jbryer/likert/blob/master/R/summary.likert.r#L95) to

Item=factor(rep(names(items), length(unique(results$Group))), levels = names(object$items)),

the summary items are in the correct order, but the plot remains as above.

c <- summary(l29g)
levels(c$Item)
[1] "Magazines"         "Comic books"       "Fiction"           "Non-fiction books" "Newspapers"  

The facet_* function from ggplot2 does not appear to accept functions, so I'm not able specify the generated plot's facets. At most I can reverse the order with:

facet_wrap(~ Item, ncol=1, as.table = FALSE)

Is there a way to have the faceted items respect the order of columns or factors in the input dataframes?

Possible to add confidence intervals or test stats for diffs b/w groups?

This package is fantastic! Just wondering if it would be possible to add the ability to indicate if comparisons across groups are statistically significant. For example, in the provided examples looking at reading differences across Mexico, Canada, and the US, would it be possible to show an F statistic and associated p-value in a column to the right?

could not find function "llply"

When I use include.histogram = TRUE, I get an error:

> plot(lmydf, include.histogram = TRUE)
Error in gtable_gList(x) : could not find function "llply"

Just plotting lmydf works fine.

mydf <- data.frame( # made up cases and a group var
  case.id <- seq(1:500),
  SAMP_APPL <- rep(c("Group 1","Group 2"),each=250)
)
#made.up.likert.stuff 
mylikerts <- data.frame(as.factor(sample(1:4, nrow(mydf), replace=TRUE, prob=c(0.2,0.3,0.1,0.4))),
                       as.factor(sample(1:4, nrow(mydf), replace=TRUE, prob=c(0.5,0.25,0.15,0.1))),
                       as.factor(sample(1:4, nrow(mydf), replace=TRUE, prob=c(0.25,0.1,0.4,0.25))),
                       as.factor(sample(1:4, nrow(mydf), replace=TRUE, prob=c(0.1,0.4,0.4,0.1))),
                       as.factor(sample(1:4, nrow(mydf), replace=TRUE, prob=c(0.35,0.25,0.15,0.25))))
names(mylikerts) <- c("Q1", "Q2", "Q3", "Q4", "Q5")
mylevels <- c("Strongly disagree", "Disagree", "Agree", "Strongly Agree")
mylikerts[] <- lapply(mylikerts, factor, 
               levels=c(1,2,3,4), 
              labels = mylevels)
mydf <- cbind(mydf, mylikerts)
qlikerts <- mydf[,substr(names(mydf), 1,1) == 'Q'] #my fake likerts all start with Q
lmydf <- likert(qlikerts[,1:5], grouping=mydf$SAMP_APP) 

Here is sessionInfo()

> sessionInfo()
R version 3.2.2 (2015-08-14)
Platform: x86_64-apple-darwin13.4.0 (64-bit)
Running under: OS X 10.9.5 (Mavericks)

locale:
[1] en_US.UTF-8/en_US.UTF-8/en_US.UTF-8/C/en_US.UTF-8/en_US.UTF-8

attached base packages:
[1] stats     graphics  grDevices utils     datasets  methods   base     

other attached packages:
[1] scales_0.3.0  likert_1.3.2  xtable_1.8-0  ggplot2_1.0.1

loaded via a namespace (and not attached):
 [1] Rcpp_0.12.1      reshape_0.8.5    psych_1.5.8      digest_0.6.8     MASS_7.3-44     
 [6] grid_3.2.2       plyr_1.8.3       gtable_0.1.2     magrittr_1.5     stringi_1.0-1   
[11] reshape2_1.4.1   labeling_0.3     proto_0.3-10     tools_3.2.2      stringr_1.0.0   
[16] munsell_0.4.2    parallel_3.2.2   colorspace_1.2-6 mnormt_1.5-3     gridExtra_2.0.0

nlevels=5 not working when grouping?

Hi,
For a smaller dataset, some questions do not have at least one response for each of the likert scale ratings. When plotting the whole dataset, adding nlevels=5 works fine. But when introducing a grouping, the nlevels=5 command seems to be ignored. Note below the question "Workshop participants discussed issues in an open way." There were no "1" or "2" responses. The first graph takes care of that. The second does not, it assumes the values "3" "4" and "5" are actually "1" "2" and "3".

x.overall.order <- c(1,2,3,4,6,7,8,9,11,5,10)
x.overall <- survey.df[,c(22:32)][x.overall.order]
t <- likert(x.overall, nlevels=5)
o=names(x.overall)
my.plot <- plot(likert(x.overall, nlevels=5),ordered=FALSE, group.order=o,wrap=70) + ggtitle(paste("Post-workshop survey"))
my.plot
ggsave(paste("overall0.png"), plot = my.plot, width = 13, height = 6)

overall0

x.overall.order <- c(1,2,3,4,6,7,8,9,11,5,10,12)
x.overall <- survey.df[,c(22:32,69)][x.overall.order]
x.overall[,12] <- gsub("0", "No Viz", x.overall[,12])
x.overall[,12] <- gsub("1", "Viz", x.overall[,12])
l <- likert(x.overall[,1:11], nlevels=5, grouping = x.overall$viz)
l
my.plot <- plot(l,ordered=FALSE, wrap=90) + ggtitle(paste("Post-workshop survey, by Viz"))
my.plot

overall

Grouping: example not working?

I pasted the example without modification directly from the documentation currently at http://jason.bryer.org/likert/index.html

The grouping yields an error shown below.

library(likert)
data(pisaitems)
items29 <- pisaitems[, substr(names(pisaitems), 1, 5) == "ST25Q"]
names(items29) <- c("Magazines", "Comic books", "Fiction", "Non-fiction books", "Newspapers")
l29g <- likert(items29, grouping = pisaitems$CNT)  # error
## Error in sum(x) : invalid 'type' (character) of argument
l29g <- likert(items29, grouping = factor(pisaitems$CNT))  # same error


sessionInfo()
## R version 3.2.1 (2015-06-18)
## Platform: x86_64-apple-darwin13.4.0 (64-bit)
## Running under: OS X 10.9.5 (Mavericks)
## 
## locale:
##   [1] en_US.UTF-8/en_US.UTF-8/en_US.UTF-8/C/en_US.UTF-8/en_US.UTF-8
## 
## attached base packages:
##   [1] stats     graphics  grDevices utils     datasets  methods   base     
## 
## other attached packages:
##   [1] testthat_0.10.0  lubridate_1.3.3  readr_0.1.1      reshape2_1.4.1   magrittr_1.5     data.table_1.9.4 plyr_1.8.3      
## [8] knitr_1.11       likert_1.2       xtable_1.7-4     ggplot2_1.0.1   
## 
## loaded via a namespace (and not attached):
##   [1] Rcpp_0.12.1      MASS_7.3-43      mnormt_1.5-3     munsell_0.4.2    colorspace_1.2-6 stringr_1.0.0    tools_3.2.1     
## [8] parallel_3.2.1   grid_3.2.1       gtable_0.1.2     psych_1.5.8      digest_0.6.8     crayon_1.3.1     gridExtra_2.0.0 
## [15] memoise_0.2.1    labeling_0.3     stringi_0.5-5    scales_0.3.0     reshape_0.8.5    chron_2.3-47     proto_0.3-10    

plot not printing all levels in legend

I have a variable with four levels but only three are currently represented in the data. The plot only shows the three active levels. Is there a way to include the missing levels?

David

Plot has extra space if values are only in upper half of factor

R version: from github (5c6b0ec)

If you have a factor, and all the values are in the upper half of the factor, then the resulting plot always has extra space above it. See the examples below. I've spent several hours trying to figure out why this happens. But I can't find the bug. Any idea what's going on here?

Extra Space:

q = factor(c(6, 6, 7, 5, 5, 7, 7), levels = 1:7)
l = likert(data.frame(q))
plot(l)

space

However, this works:

q = factor(c(1, 6, 7, 5, 5, 7, 7), levels = 1:7)
l = likert(data.frame(q))
plot(l)

no-space

And so does this.

q = factor(c(3, 3, 1, 3, 2, 1, 1), levels = 1:7)
l = likert(data.frame(q))
plot(l)

no-space2

reverse natural order for plot and ordered = FALSE

This issue is somehow related to #33.

I like to keep my questions in the order as they occur in the questionnaire. While this is working in the likert object (foo1, foo2) plot change this order (from top to bottom foo2, foo1).

MWE:

library("likert")

d <- data.frame(foo1=factor(c(2, 1), levels=1:3, labels=c("yes", "maybe", "no")),
                foo2=factor(c(1, 1), levels=1:3, labels=c("yes", "maybe", "no")))
l <- likert(d)
#   Item yes maybe no
#1 foo1  50    50  0
#2 foo2 100     0  0
plot(l, ordered=FALSE)

l

Is there a way to get foo1, foo2 from top to bottom in the plot method?

Unnatural sort order when plotting with ordered=FALSE

Hey there,
I'm trying to plot some likert scale items using likert.bar.plot. I use the function directly (instead of the generic plot function) because I don't want the variables to be sorted by the plot function (I've got the labels numbered and I'd like to keep this order).

Plotting with ordered=FALSE gives me kind of an unnatural sort order (see attachment). Instead of 1 ... 14 (like in the likert object) I get 9 ... 1, 14 ... 10.

Can you help me with this?

Thanks a lot for the support! Great package, by the way!

Jonas

ordered = TRUE (generic plot function)
ordered true

ordered = FALSE
ordered false

Can't use the shinyLikert() function

The shinyLikert() function does not appear in my namespace.

require(devtools)
install_github( 'jbryer/likert' )
require(likert)
ls("package:likert")

gives me

[1] "likert"                "likert.bar.plot"       "likert.density.plot"  
[4] "likert.heat.plot"      "likert.histogram.plot" "recode"               
[7] "reverse.levels"       

According to http://jason.bryer.org/likert/, there should be an eight function called shinyLikert(). I am operating under Windows7 and did not get any errors while installing.

I already tried some hacks,but it does not seem to work

  • If i start the app directly using shiny::runApp( "inst/shiny" ) with the project root (in my case ~/Downloads/likert-master) as working directory, I get an error that R/xtable.likert.R does not exist.
  • If I now rename R/xtable.likert.r to R/xtable.likert.R and run shiny::runApp( "inst/shiny" ) again, I get an error saying that C:/Users/User/Dropbox/Github/likert/R/xtable.likert.R does not exist. My computer does not have a user called User

Is the function currently broken or is it just me?

Wrong Order in Histogram

This is probably related to #33 and maybe to #21 and #31. I’m not quite sure though, so I’d rather create a new issue for it.

I’ll use the tutorial as example. In the tutorial we do:

> l28g <- likert(items28, grouping=pisaitems$CNT)
> plot(l28g, include.histogram=TRUE)

rplot

This works as expected. However I think it is coincidental that the histogram is plotted correctly, because if I rename “United States” to “Australia,” the histogram bars get mixed up. It seems they’re always sorted in reverse alphabetical order.

> levels(pisaitems$CNT)[levels(pisaitems$CNT) == 'United States'] <- 'Australia'
> l28g <- likert(items28, grouping=pisaitems$CNT)
> plot(l28g, include.histogram=TRUE)

rplot

> summary(pisaitems$CNT)
   Canada    Mexico Australia 
    23207     38250      5233 

Marforic’s workaround works for me also in this context, which makes me think the problems are probably related.

> plot(l28g, include.histogram=TRUE, group.order=c('Australia', 'Mexico', 'Canada'))

rplot01

Thanks!

Local paths in repository.

Just take a look at server.R code:
https://github.com/jbryer/likert/blob/a36d14352a1d799c35f27a3f30dd0e3cbea5c945/inst/shiny/server.R

source('C:/Users/User/Dropbox/Github/likert/R/xtable.likert.R')#rm this when github syncs

This is the error I get:

likert:::shinyLikert()

Listening on http://127.0.0.1:5240
Warning in file(filename, "r", encoding = encoding) :
  cannot open file 'C:/Users/User/Dropbox/Github/likert/R/xtable.likert.R': No such file or directory
Error in file(filename, "r", encoding = encoding) : 
  cannot open the connection

BTW Even though README.md tells to try shiny app with shinyLikert() this function is not exported globally.

conflicts with tibble classes

I have been racking my brain trying to figure out why my data would not work with the likert() function. I think it has something to do with either class tbl or tbl_df.

Here's a quick example in a R Notebook:

library(tidyverse)
library(likert)
Loading tidyverse: ggplot2
Loading tidyverse: tibble
Loading tidyverse: tidyr
Loading tidyverse: readr
Loading tidyverse: purrr
Loading tidyverse: dplyr
Conflicts with tidy packages -------------------------------------------------------------------------------
filter(): dplyr, stats
lag():    dplyr, stats
Loading required package: xtable

Attaching package: ‘likert’

The following object is masked from ‘package:dplyr’:

    recode
survey <- tribble(
  ~feel_today, ~feel_yesterday, ~feel_last_week,
  "fine",      "poor",          "good",
  "poor",      "fine",          "fine",
  "good",      "good",          "poor",
  "fine",      "poor",          "poor"
)
levels <- c("poor", "fine", "good")
survey <- survey %>% mutate_all(funs(factor(., levels = levels)))
survey
map(survey, class)
$feel_today
[1] "factor"

$feel_yesterday
[1] "factor"

$feel_last_week
[1] "factor"
map(survey, nlevels)
$feel_today
[1] 3

$feel_yesterday
[1] 3

$feel_last_week
[1] 3
likert(survey)
Error in likert(survey) : 
  All items (columns) must have the same number of levels
items <- as.data.frame(survey)
likert(items)
            Item poor fine good
1     feel_today   25   50   25
2 feel_yesterday   50   25   25
3 feel_last_week   50   25   25

I was reading about tibbles this morning and I know there are differences, especially between [ and [[ in terms of returning another tibble or a vector. Not sure what might be going on under the hood but thought you might like to know about it.

Thanks for the package!

levels in bar plot are not mapped correctly, if not all levels have data and if grouping is used

It is easier to explain the serious(!) errror by an example:

df <- data.frame(g=c(1,1,1,2,2,2), x=c(2,3,3,2,3,3), y=c(2,3,3,1,3,3))

df$g <- factor(df$g)
df$x <- factor(df$x, levels=1:3)
df$y <- factor(df$y, levels=1:3)

li <- likert(df[,2:3], grouping=df$g, nlevels=3)
plot(li)

The two bars in the upper half of the plot (x) should look similar as the upper bar in the lower half of the plot (y).
bug

Incorrect ploted level order when using grouping

Hello,

First things first: thank you for this great package! I use it a lot.
Now, let's try to replicate the bug(?).

require(likert)

Using demo data
data(pisaitems)
items28 <- pisaitems[, substr(names(pisaitems), 1, 5) == "ST24Q"]

Prepare data to plot likert
l28 <- likert(items28)

Levels are ploted in the correct order
plot(l28)

image

Prepare grouped data by CNT to plot likert
l28g <- likert(items28, grouping = pisaitems$CNT)

"Strongly agree" apears before "Agree" level
plot(l28g)

image

Here's my session info:

sessionInfo()
R version 3.3.0 (2016-05-03)
Platform: x86_64-w64-mingw32/x64 (64-bit)
Running under: Windows 7 x64 (build 7601) Service Pack 1

locale:
[1] LC_COLLATE=Portuguese_Portugal.1252 LC_CTYPE=Portuguese_Portugal.1252
[3] LC_MONETARY=Portuguese_Portugal.1252 LC_NUMERIC=C
[5] LC_TIME=Portuguese_Portugal.1252

attached base packages:
[1] stats graphics grDevices utils datasets methods base

other attached packages:
[1] likert_1.3.4 xtable_1.8-2 ggplot2_2.2.0

loaded via a namespace (and not attached):
[1] Rcpp_0.12.8 digest_0.6.10 psych_1.6.9 assertthat_0.1
[5] grid_3.3.0 plyr_1.8.4 gtable_0.2.0 magrittr_1.5
[9] scales_0.4.1 stringi_1.1.2 reshape2_1.4.2 lazyeval_0.2.0
[13] labeling_0.3 tools_3.3.0 foreign_0.8-67 stringr_1.1.0
[17] munsell_0.4.3 parallel_3.3.0 colorspace_1.3-1 mnormt_1.5-5
[21] gridExtra_2.2.1 tibble_1.2

I've been keeping all packages updated. Could it be related to ggplot2 version 2.2.0? (Just tried with 2.1.0 version and had the same issue)
[UPDATE: It really is related to ggplot2_2.2.0, works fine with 2.1.0. One needs to uninstall 2.2.0, restart R and install 2.1.0]
Thanks,

"Percentage" hardcoded in barplot

The barplot function uses the word "Percentage" as legend description in the source. This does not fit nicely when plotting scales with foreign levels.

Perhaps you can introduce an "yLab" param?

wrong cols in summary.likert for pre-summarized data

line 48:

lowCols <- startCol:(floor(center-.5)+1) # not fully tested

line 54:

highCols <- (ceiling(center+.5)+startCol-1):ncol(results) # not fully tested

line 67:

lowCols <- startCol:(floor(center-.5)+2) # not fully tested

line 73:

highCols <- (ceiling(center+.5)+startCol-1):ncol(results) # not fully tested

Plot Errors with Grouping

I recently developed a number of scripts for the Likert package to process data from a survey. The survey questions I plotted had a unique scale and needed to be their own Likert objects. I subsetted the vector with the response and a grouping variable into a data frame. Then I created a new list of just the question (without the grouping.) I coerced this into a dataframe for the Likert package and created a Likert object from it with grouping to the original subset. The plot worked fine. I came back to the data after upgrading R and now plots add a extra response category to the plots.

Previous version:
tsunprob
After update:
tsunprob

The grey extra bar to the right is the new artifact I can't seem to work around. When I print the Likert object the data comes out as anticipated (5 categories, not 6.) Its something about how the plot handles the Likert object. Also, the color shading is shifting on the right side. (Dark become light, and vice versa.)

Another clue - my plots using true dataframes (not coerced ones) function just fine. Also, if I drop the grouping the grey space is no longer present either.

shinyLikert fails due to missing file (?)

when running shinyLikert() I get an error due to a path to an existing file, I suppose:

> shinyLikert() 
Warning in file(filename, "r", encoding = encoding) :
  cannot open file 'C:/Users/User/Dropbox/Github/likert/R/xtable.likert.R': No such file   
or directory
Error in file(filename, "r", encoding = encoding) : 
  cannot open the connection

I work on Mac, so C:/ etc. should not appear at all, I guess :)

Way of storing full question names

In the example, you rename the variables like this:

items24 <- rename(items24, c(
        ST24Q01="I read only if I have to.",
        ST24Q02="Reading is one of my favorite hobbies.",
        ST24Q03="I like talking about books with other people.",
        ST24Q04="I find it hard to finish books.",
        ST24Q05="I feel happy if I receive a book as a present.",
        ST24Q06="For me, reading is a waste of time.",
        ST24Q07="I enjoy going to a bookstore or a library.",
        ST24Q08="I read only to get information that I need.",
        ST24Q09="I cannot sit still and read for more than a few minutes.",
        ST24Q10="I like to express my opinions about books I have read.",
        ST24Q11="I like to exchange books with my friends."))

This works, but I find it very messy to include all this information in my code. As well, since some of the questions contain special characters that R won't accept (ie. Likert will still work, but I can no longer do q$Weird question with lot's of characters?), I will have to redo this if I extract a new set of variables, a different grouping etc.

To me, it would be much cleaner if I could somehow store the full question names in the data frame, perhaps as a comment on each column, or as a metadata attribute? Usually the way I work with questionnaire data is to write one script to clean it up (convert to NAs, order factors, etc), save the data, and then use knitr to load the data and write the report. It would be great if I could store the question names in the first script, and then easily say "show me a likert graph of these five variables", and it would have the right names etc.

I've also been thinking of better ways of storing and sharing data than CSV - how do you attach metadata on short/full variable names, ordered factors, NAs etc... That's a further step, but for now some meta info that I could store in an Rdata would be a great first step.

Thanks for a great package!

Install error

I try to install on Mac OS 10.9

require(devtools)
install_github('pisa', 'jbryer')

I have this error:

Error in texi2dvi(file = file, pdf = TRUE, clean = clean, quiet = quiet, :
Running 'texi2dvi' on 'likert-xtable.tex' failed.
Calls: -> texi2pdf -> texi2dvi
Execution halted

Have any idea?

Suggestion for improvment regarding handling the percent sign

Hi there,

It would be pretty cool if you could add some more flexibility regarding the handling of the percent sign. For this I have two specific use cases:

  1. Currently, “likert” seems to follow the instructions of English style guides which in general suggest not to put a space between numerical value and percent sign. However, other conventions (especially about standardization and norming) do require a non-breaking space between number and unit. Currently, “likert” does not seem to provide an option to change the appearance of the percent sign.
  2. Along with this, the “raw” percent sign brings some confusion when being used in applications interfering with other software tools. There is a pretty useful library called “tikzDevice” which allows for exporting R plots into Latex readable TikZ code. As the raw percent sign (%) is the symbol for commenting in Latex, using “tikzDevice” on “likert” plots fails if the plot contains percent signs. For this purpose it would be cool to being able to change the percent sign into //% by means of an option.

likert() does not seem to handle `tbl_df` data

Expected Behavior

If data is of class tbl_df (or inherits from it), likert::likert() should be able to handle it without issue.

Actual Behavior

Handing in data inheriting from class tbl_df produces an error:

Error in likert(test_data) : 
  The items parameter must be a data frame. If trying to subset a data frame to analyze only one column, try: items=mydf[,1, drop=FALSE].
In addition: Warning message:
In if (class(items) != "data.frame") { :
  the condition has length > 1 and only the first element will be used

Steps to Reproduce

# Checkpoint for reproducibility
require(checkpoint)
checkpoint("2016-03-30", R.version = "3.2.4")

require(dplyr)
require(likert)
data("pisaitems")

test_data <- pisaitems %>%
  select(one_of("ST24Q02", "ST24Q01")) %>%
  tbl_df()

# If `test_data` is a `tbl_df`, this call will fail because likert() claims the
#   `items` parameter is not a data frame
likert(test_data)

# Calling `class()` on `test_data` shows it inherits from multiple classes,
#   including `data.frame`. So, I'm not sure what's happening exactly,
#   but I suspect it's related to this source code block: https://github.com/jbryer/likert/blob/4ff9837ffa17085219c5b23f5e8319b0405e2893/R/likert.R#L71-L74
class(test_data)

# Coercing `test_data` back to a data frame fixes the issue,
#   but is there any reason `tbl_df` data should be failing?
as.data.frame(test_data) %>% likert()

Where I suspect the error might be originating

Based on my inspection, the only part of the likert package source code that could produce this error is here:

likert/R/likert.R

Lines 71 to 74 in 4ff9837

if(!('data.frame' %in% class(items))) {
stop(paste0('The items parameter must be a data frame. If trying ',
'to subset a data frame to analyze only one column, try: ',
'items=mydf[,1, drop=FALSE].'))

Which in turn means this conditional check is returning TRUE :

if(!('data.frame' %in% class(items)))

Session Info

R version 3.2.4 (2016-03-10)
Platform: x86_64-apple-darwin13.4.0 (64-bit)
Running under: OS X 10.11.4 (El Capitan)

locale:
[1] en_US.UTF-8/en_US.UTF-8/en_US.UTF-8/C/en_US.UTF-8/en_US.UTF-8

attached base packages:
[1] stats     graphics  grDevices utils     datasets  methods   base     

other attached packages:
[1] likert_1.3.3      xtable_1.8-2      ggplot2_2.1.0     dplyr_0.4.3       checkpoint_0.3.16

loaded via a namespace (and not attached):
 [1] Rcpp_0.12.4      knitr_1.12.3     magrittr_1.5     mnormt_1.5-4     munsell_0.4.3   
 [6] colorspace_1.2-6 R6_2.1.2         stringr_1.0.0    plyr_1.8.3       tools_3.2.4     
[11] parallel_3.2.4   grid_3.2.4       gtable_0.2.0     psych_1.6.4      DBI_0.3.1       
[16] lazyeval_0.1.10  assertthat_0.1   digest_0.6.9     gridExtra_2.2.1  reshape2_1.4.1  
[21] formatR_1.3      labeling_0.3     stringi_1.0-1    scales_0.4.0    

Recommend Projects

  • React photo React

    A declarative, efficient, and flexible JavaScript library for building user interfaces.

  • Vue.js photo Vue.js

    🖖 Vue.js is a progressive, incrementally-adoptable JavaScript framework for building UI on the web.

  • Typescript photo Typescript

    TypeScript is a superset of JavaScript that compiles to clean JavaScript output.

  • TensorFlow photo TensorFlow

    An Open Source Machine Learning Framework for Everyone

  • Django photo Django

    The Web framework for perfectionists with deadlines.

  • D3 photo D3

    Bring data to life with SVG, Canvas and HTML. 📊📈🎉

Recommend Topics

  • javascript

    JavaScript (JS) is a lightweight interpreted programming language with first-class functions.

  • web

    Some thing interesting about web. New door for the world.

  • server

    A server is a program made to process requests and deliver data to clients.

  • Machine learning

    Machine learning is a way of modeling and interpreting data that allows a piece of software to respond intelligently.

  • Game

    Some thing interesting about game, make everyone happy.

Recommend Org

  • Facebook photo Facebook

    We are working to build community through open source technology. NB: members must have two-factor auth.

  • Microsoft photo Microsoft

    Open source projects and samples from Microsoft.

  • Google photo Google

    Google ❤️ Open Source for everyone.

  • D3 photo D3

    Data-Driven Documents codes.