Giter VIP home page Giter VIP logo

speedscope's Introduction

English | 简体中文

🔬speedscope

A fast, interactive web-based viewer for performance profiles. Supports import from a variety of profiles in a variety of languages (JS, Ruby, Python, Go & more). Try it here: https://www.speedscope.app

Given raw profiling data, speedscope allows you to interactively explore the data to get insight into what's slow in your application, or allocating all the memory, or whatever data is represented in the profiling data.

Example Profile

Supported file formats

speedscope is designed to ingest profiles from a variety of different profilers for different programming languages & environments. Click the links below for documentation on how to import from a specific source.

Contributions to add support for additional formats are welcome! See issues with the "import source" tag.

Usage

Visit https://www.speedscope.app, then either browse to find a profile file or drag-and-drop one onto the page. The profiles are not uploaded anywhere -- the application is totally in-browser.

Command line usage

For offline use, or convenience in the terminal, you can also install speedscope via npm:

npm install -g speedscope

Invoking speedscope /path/to/profile will load speedscope in your default browser.

Self-contained directory

If you don't have npm or node installed, you can also download a self-contained version from https://github.com/jlfwong/speedscope/releases. After you download the zip file from a release, simply unzip it and open the contained index.html in Chrome or Firefox.

Importing via URL

To load a specific profile by URL, you can append a hash fragment like #profileURL=[URL-encoded profile URL]&title=[URL-encoded custom title]. Note that the server hosting the profile must have CORS configured to allow AJAX requests from speedscope.

Views

🕰Time Order

Detail View

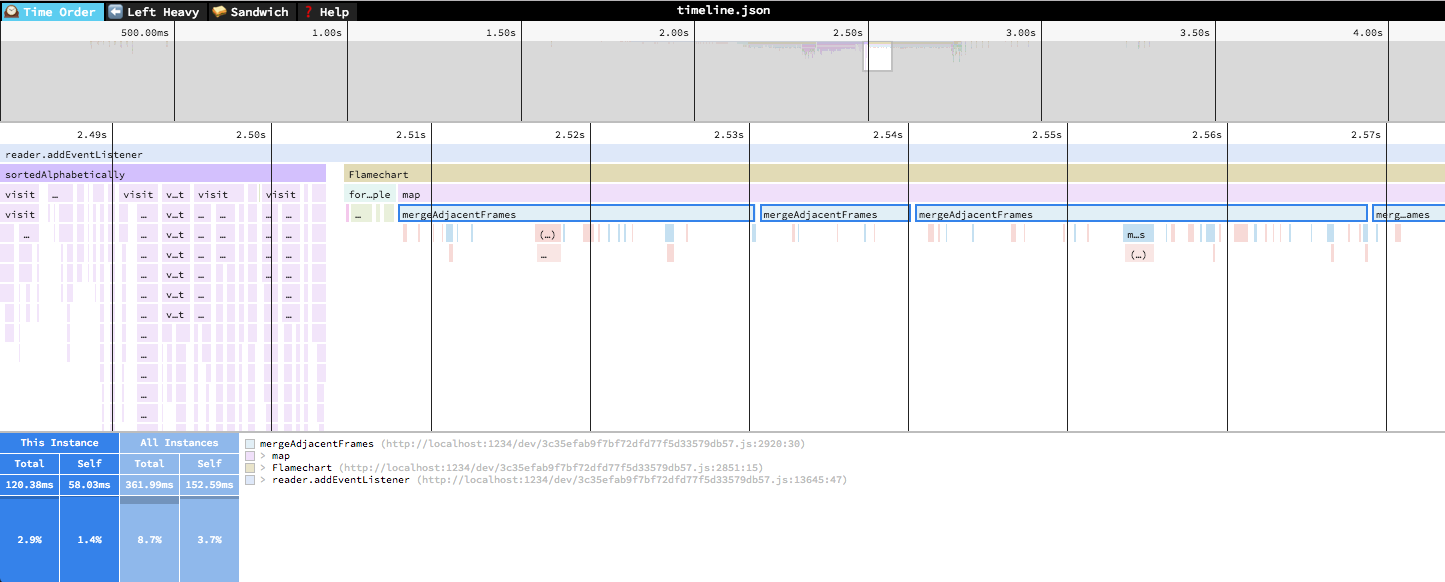
In the "Time Order" view (the default), call stacks are ordered left-to-right in the same order as they occurred in the input file, which is usually going to be the chronological order they were recorded in. This view is most helpful for understanding the behavior of an application over time, e.g. "first the data is fetched from the database, then the data is prepared for serialization, then the data is serialized to JSON".

The horizontal axis represents the "weight" of each stack (most commonly CPU time), and the vertical axis shows you the stack active at the time of the sample. If you click on one of the frames, you'll be able to see summary statistics about it.

⬅️Left Heavy

Left Heavy View

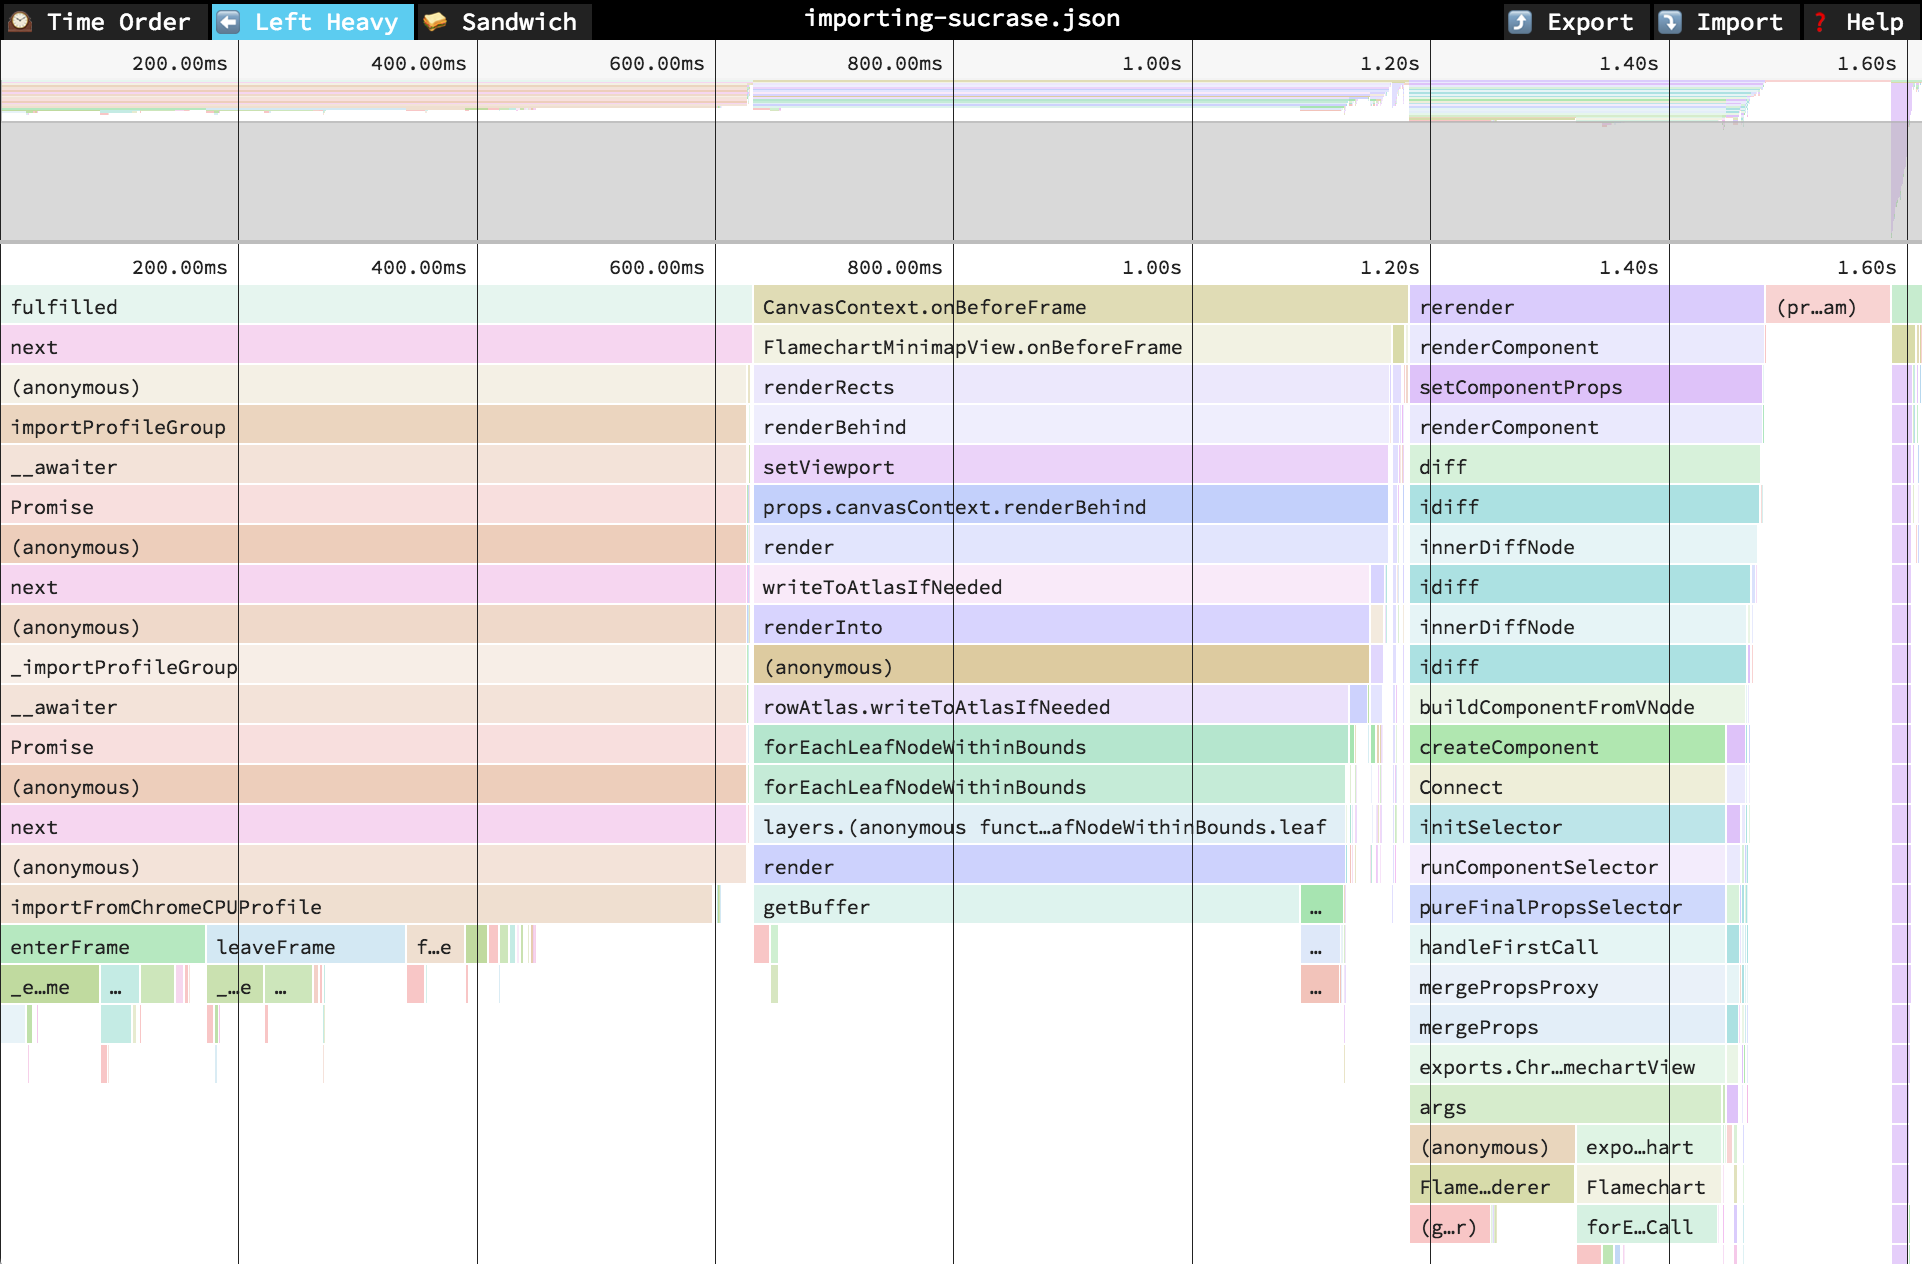
In the "Left Heavy" view, identical stacks are grouped together, regardless of whether they were recorded sequentially. Then, the stacks are sorted so that the heaviest stack for each parent is on the left -- hence "left heavy". This view is useful for understanding where all the time is going in situations where there are hundreds or thousands of function calls interleaved between other call stacks.

🥪 Sandwich

Sandwich View

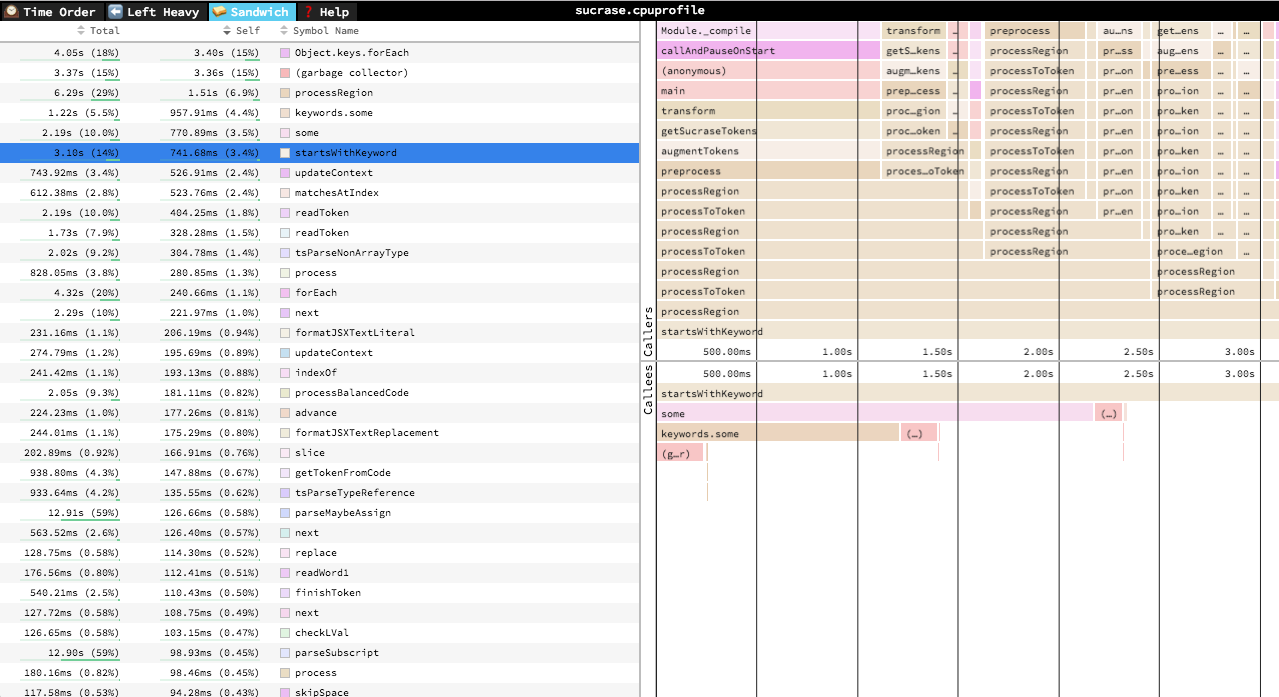
The Sandwich view is a table view in which you can find a list of all functions and their associated times. You can sort by self time or total time. It's called "Sandwich" view because if you select one of the rows in the table, you can see flamegraphs for all the callers and callees of the selected row.

Navigation

Once a profile has loaded, the main view is split into two: the top area is the "minimap", and the bottom area is the "stack view".

Minimap Navigation

  • Scroll on either axis to pan around
  • Click and drag to narrow your view to a specific range

Stack View Navigation

  • Scroll on either axis to pan around
  • Pinch to zoom
  • Hold Cmd+Scroll to zoom
  • Double click on a frame to fit the viewport to it
  • Click on a frame to view summary statistics about it

Keyboard Navigation

  • +: zoom in
  • -: zoom out
  • 0: zoom out to see the entire profile
  • w/a/s/d or arrow keys: pan around the profile
  • 1: Switch to the "Time Order" view
  • 2: Switch to the "Left Heavy" view
  • 3: Switch to the "Sandwich" view
  • r: Collapse recursion in the flamegraphs
  • Cmd+S/Ctrl+S to save the current profile
  • Cmd+O/Ctrl+O to open a new profile
  • n: Go to next profile/thread if one is available
  • p: Go to previous profile/thread if one is available
  • t: Open the profile/thread selector if available
  • Cmd+F/Ctrl+F: to open search. While open, Enter and Shift+Enter cycle through results

Contributing

Do you want to contribute to speedscope? Sweeeeet. Check out CONTRIBUTING.md for instructions on setting up your dev environment.

speedscope's People

Contributors

alangpierce avatar alexcoco avatar archerlly avatar byronhe avatar danvk avatar dgiger42 avatar djudd avatar evanw avatar f-hj avatar goose97 avatar jez avatar jlfwong avatar joerick avatar justinbeckwith avatar jyc avatar krinkle avatar loganek avatar manuelfelipe avatar p403n1x87 avatar pushrax avatar sokra avatar spillerrec avatar taneliang avatar tom93 avatar trishume avatar vasi-stripe avatar vmarchaud avatar vrischmann avatar zacharyfmarion avatar zoidyzoidzoid avatar

Stargazers

 avatar  avatar  avatar  avatar  avatar  avatar  avatar  avatar  avatar  avatar  avatar  avatar  avatar  avatar  avatar  avatar  avatar  avatar  avatar  avatar  avatar  avatar  avatar  avatar  avatar  avatar  avatar  avatar  avatar  avatar  avatar  avatar  avatar  avatar  avatar  avatar  avatar  avatar  avatar  avatar  avatar  avatar  avatar  avatar  avatar  avatar  avatar  avatar  avatar  avatar  avatar  avatar  avatar  avatar  avatar  avatar  avatar  avatar  avatar  avatar  avatar  avatar  avatar  avatar  avatar  avatar  avatar  avatar  avatar  avatar  avatar  avatar  avatar  avatar  avatar  avatar  avatar  avatar  avatar  avatar  avatar  avatar  avatar  avatar  avatar  avatar  avatar  avatar  avatar  avatar  avatar  avatar  avatar  avatar  avatar  avatar  avatar  avatar  avatar  avatar

Watchers

 avatar  avatar  avatar  avatar  avatar  avatar  avatar  avatar  avatar  avatar  avatar  avatar  avatar  avatar  avatar  avatar  avatar  avatar  avatar  avatar  avatar  avatar  avatar  avatar  avatar  avatar  avatar  avatar  avatar  avatar  avatar  avatar  avatar  avatar  avatar  avatar  avatar  avatar  avatar  avatar  avatar  avatar  avatar  avatar  avatar  avatar  avatar  avatar

speedscope's Issues

Add support for crop

In time ordered view, it would be useful to be able to crop along the time axis to the current viewport. This would allow for more meaningful statistics around where the time is going within some specific time span (e.g. a single request or a single frame).

Allow speedscope to be used as a library instead of a standalone application

I'm making a chrome devtools extension to surface the results of server-side profiling, and I tried hacking speedscope in as a React component, but I ran into some issues. From my perspective, it would be great if I could install speedscope as a library and render it as a React component with the full text of the profile as a prop.

Here's a partial list of issues that would need to be addressed for this to happen:

  • You need to actually build it as a library and publish it on npm. 😄My hacky approach was to just npm link the TypeScript into my node_modules and compile it with webpack, but that ran into various issues. If you want to avoid the React dependency (or peer dependency), you could ship a @speedscope/core and separate @speedscope/react package, or something like that.
  • Speedscope uses Preact, which isn't drop-in compatible with React. Probably the best way to ship a React-friendly speedscope component is to just write a React wrapper that mounts a Preact render tree inside, rather than trying to make the whole thing a React render tree.
  • I ran into CSP issues since regl uses eval. I was able to enable eval for my extension to work around it, but I'd prefer not to. This seems like it might be unreasonable to work around, but it would be a good thing to mention in docs.
  • Formatting looked wrong because speedscope includes reset.css, which it turns out is necessary. The aphrodite styles just worked, though, which was nice.
  • The profile rendered correctly and various interactions worked, but hover and pinch zoom didn't do anything, and drag-to-pan caused the main flamechart view to just disappear. This might just be due to React/Preact differences, not sure.

So at least for now, it looks like an iframe (or external window) is the nicest way to use speedscope, and from what I can see that works fine. But it would be cool if it could be more integrated into a larger tool.

Support import of multithreaded/multiprocess profiles

This will be helpful for supporting both multiprocess/multithread Instruments import (#63) and general trace import (#77)

This is required for #31.

Here's a rough toolbar mockup showing navigation controls between the profiles from different threads/processes.
image

Add support for search

It would be really nice to be able to quickly locate functions within a profile by highlighting them via search.

Here are some mockups of what that might look like:
image

Better main thread detection during Instruments data import.

For a complex, heavily multi-threaded app, the logic that assumes that the thread with the most samples is the main thread can be mislead.

Sadly, I don't have a concrete suggestion for something better. I notice that main appears to usually be thread id '4', but there has to be something less hacky.

Just wanted to open this issues to start a discussion about this.

Instruments .trace files do not load in speedscope.app

When trying to open an instruments time tracing trace, speedscope fails to load it with an error. Pasting in a deep copy of the same trace works. The error that shows up in the JS console is just 'undefined'

Here is an example trace that fails. I created it by tracing xcode 9.4 for a few seconds.
xcode.trace.zip

Hang when zoom scale is large

Repro: zoom in really far. Sometimes the loop in this picture hangs because the loop offset plus the loop increment ends up being rounded down to the loop offset (i.e. the increment has no effect). A check for that condition such as if (t + n === t) break would fix this here.

Better labels for the time axis

First, it would really help if we could simplify how time > 1 minute is shown. It's hard to parse 1.20min as 1:12 (have to constantly multiply the fraction by 60 to understand seconds).

Second, only 2 decimals are shown, once you pass 1 minute, instead of 10ms as the finest grain now you only see 0.01 minutes (600ms) as the finest grain. To improve this it would be best if we could get a mm:ss.iii format (minutes:seconds.millisconds) instead. You can look at the timeline in Instruments to see a demo of what this would look like.

Thanks!

What's the license for this repository?

What's the license for this repository? I don't see it in the README or in the repo.

It'd be great to add a LICENSE file to the repository to make this clear.

This project looks really nice!

feature: WASD navigation

In the DevTools (and about:tracing) we allow panning Y axis with A/D and zooming Y axis with W/S. I've come to heavily rely on that, so I'd lurve if it was supported here, too.

Greattt work on this app. So nice.

Command line tool

It would be nice if you could run speedscope /path/to/profile.json and have it either automatically open in your browser of choice or boot up speedscope in an electron shell. This would make integration with other tools potentially much easier.

The UI breaks after browser zoom changes

Ideally I'd be able to zoom out using the browser's zoom to be able to compress deeper traces. Right now the UI gets really messed up if you do that. It looks like there are two separate layers that are both the wrong scale in different ways?

Format Support: Trace Event Format

Chrome has a simplified trace format which is a json list of trace dictionaries. This is the main format we generate internally at our company, so it would be nice if speedscope could render them.

This test trace file loads in chrome://tracing while it gives an error in speedscope.

test.json.zip

Feature request: see the duration of a run in the UI

#61 was caused by me zooming in really far at the end of the run to try to measure the overall time since that's not displayed in the UI anywhere. Displaying that in the UI somewhere would mean I wouldn't have hit this bug in the first place :)

Format Support: Firefox profiler data

The developer tools in Chrome's latest release are super buggy, so I'd like to use Firefox for profiling instead. I can't find any documentation about the format unfortunately. It looks like it's JSON-based.

Add baseline tests 😓

There are no unit tests for this repository yet!

Some of the areas that should be pretty easy to write tests for:

  • importFromChromeTimeline
  • importFromChromeCPUProfile
  • importFromStackprof
  • importFromBGFlameGraph
  • The methods of the Profile class
  • The methods of the Flamechart class
  • The LRUCache class
  • The Vec2 class
  • The AffineTransform class
  • The Rect class

Trickier tests that would require some form of visual diffing + a GPU (or CPU implementation of gl like headless-gl, but are otherwise pretty stable with well defined interfaces

  • ViewportRectangleRenderer
  • TextureRenderer
  • RectangleBatchRenderer
  • FlamechartRenderer

And then there's the matter of tests for the UI itself

Document, export, and re-import a speedscope json file format

Since this app can read many trace formats, it would be pretty cool if we could have an export function into some sort of common JSON format. That way we can use it to convert things like proprietary instruments traces into open chrome traces so we can use it with other tools.

Low framerate in Chrome 66 on MBP

For some reason, the example profile is running really slowly, but only in Chrome. It seems like most of the time is going into compositing layers

image

image

It seems to run just fine in Firefox

Recommend Projects

  • React photo React

    A declarative, efficient, and flexible JavaScript library for building user interfaces.

  • Vue.js photo Vue.js

    🖖 Vue.js is a progressive, incrementally-adoptable JavaScript framework for building UI on the web.

  • Typescript photo Typescript

    TypeScript is a superset of JavaScript that compiles to clean JavaScript output.

  • TensorFlow photo TensorFlow

    An Open Source Machine Learning Framework for Everyone

  • Django photo Django

    The Web framework for perfectionists with deadlines.

  • D3 photo D3

    Bring data to life with SVG, Canvas and HTML. 📊📈🎉

Recommend Topics

  • javascript

    JavaScript (JS) is a lightweight interpreted programming language with first-class functions.

  • web

    Some thing interesting about web. New door for the world.

  • server

    A server is a program made to process requests and deliver data to clients.

  • Machine learning

    Machine learning is a way of modeling and interpreting data that allows a piece of software to respond intelligently.

  • Game

    Some thing interesting about game, make everyone happy.

Recommend Org

  • Facebook photo Facebook

    We are working to build community through open source technology. NB: members must have two-factor auth.

  • Microsoft photo Microsoft

    Open source projects and samples from Microsoft.

  • Google photo Google

    Google ❤️ Open Source for everyone.

  • D3 photo D3

    Data-Driven Documents codes.