Giter VIP home page Giter VIP logo

lambda-science / myoquant Goto Github PK

View Code? Open in Web Editor NEW
3.0 2.0 1.0 3.84 MB

MyoQuant🔬: a tool to automatically quantify pathological features in muscle fiber histology images. Demo version deployed at: https://lbgi.fr/MyoQuant

Home Page: https://lbgi.fr/MyoQuant/

License: GNU Affero General Public License v3.0

Python 86.46% Makefile 0.48% Jupyter Notebook 13.06%
computer-vision deep-learning disease histology image medecine python pytorch quantification tensorflow

myoquant's Introduction

Twitter Follow Demo Version PyPi Pypi verison PyPi Python Version PyPi Format GitHub last commit GitHub

MyoQuant🔬: a tool to automatically quantify pathological features in muscle fiber histology images

MyoQuant Banner

MyoQuant Illustration

MyoQuant🔬 is a command-line tool to automatically quantify pathological features in muscle fiber histology images.
It is built using CellPose, Stardist, custom neural-network models and image analysis techniques to automatically analyze myopathy histology images.
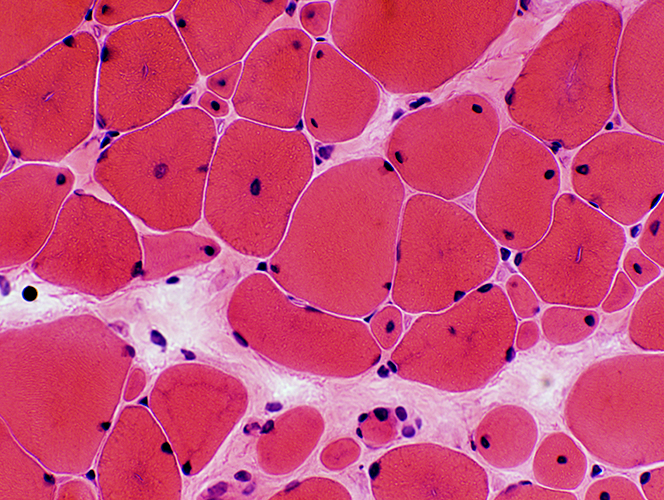
Currently MyoQuant is capable of quantifying centralization of nuclei in muscle fiber with HE staining, anomaly in the mitochondria distribution in muscle fibers with SDH staining and the number of type 1 muscle fiber vs type 2 muscle fiber with ATP staining.

An online demo with a web interface is available at https://lbgi.fr/MyoQuant/. This project is free and open-source under the AGPL license, feel free to fork and contribute to the development.

Warning: This tool is still in early phases and active development.

How to install

Installing from PyPi (Preferred)

MyoQuant package is officially available on PyPi (pip) repository. https://pypi.org/project/myoquant/ Pypi verison

Using pip, you can simply install MyoQuant in a python environment with a simple: pip install myoquant

Installing from sources (Developers)

  1. Clone this repository using git clone https://github.com/lambda-science/MyoQuant.git
  2. Create a virtual environment by using python -m venv .venv
  3. Activate the venv by using source .venv/bin/activate
  4. Install MyoQuant by using pip install -e .

How to Use

To use the command-line tool, first activate your venv in which MyoQuant is installed: source .venv/bin/activate
Then you can perform SDH or HE analysis. You can use the command myoquant --help to list available commands.

💡Full command documentation is avaliable here: CLI Documentation

  • For SDH Image Analysis the command is:
    myoquant sdh-analysis IMAGE_PATH
    Don't forget to run myoquant sdh-analysis --help for information about options.
  • For HE Image Analysis the command is:
    myoquant he-analysis IMAGE_PATH
    Don't forget to run myoquant he-analysis --help for information about options.
  • For ATP Image Analysis the command is:
    myoquant atp-analysis IMAGE_PATH
    Don't forget to run myoquant atp-analysis --help for information about options.

If you're running into an issue such as myoquant: command not found please check if you activated your virtual environment with the package installed. And also you can try to run it with the full command: python -m myoquant sdh-analysis --help

Contact

Creator and Maintainer: Corentin Meyer, PhD in Biomedical AI [email protected]

Citing MyoQuant🔬

[placeholder]

Examples

For HE Staining analysis, you can download this sample image: HERE
For SDH Staining analysis, you can download this sample image: HERE
For ATP Staining analysis, you can download this sample image: HERE

  1. Example of successful SDH analysis output with: myoquant sdh-analysis sample_sdh.jpg

image image 2. Example of HE analysis: myoquant he-analysis sample_he.jpg

image

  1. Example of ATP analysis with: myoquan atp-analysis sample_atp.jpg

image

Advanced information

Model path and manual download

For the SDH Analysis our custom model will be downloaded and placed inside the myoquant package directory. You can also download it manually here: https://lbgi.fr/~meyer/SDH_models/model.h5 and then you can place it in the directory of your choice and provide the path to the model file using:
myoquant sdh-analysis IMAGE_PATH --model_path /path/to/model.h5

HuggingFace🤗 repositories for Data and Model

In a effort to push for open-science, MyoQuant SDH dataset and model and availiable on HuggingFace🤗

Partners

Partner Banner

MyoQuant is born within the collaboration between the CSTB Team @ ICube led by Julie D. Thompson, the Morphological Unit of the Institute of Myology of Paris led by Teresinha Evangelista, the imagery platform MyoImage of Center of Research in Myology led by Bruno Cadot, the photonic microscopy platform of the IGMBC led by Bertrand Vernay and the Pathophysiology of neuromuscular diseases team @ IGBMC led by Jocelyn Laporte

myoquant's People

Contributors

dependabot[bot] avatar lambda-science avatar

Stargazers

 avatar  avatar

Watchers

 avatar  avatar

myoquant's Issues

HE analysis eccentricity threshold does not affect output

Problem

Changing eccentricity threshold, either from the myoquant he-analysis CLI or from myoquant.HE_analysis.run_he_analysis function results in the same dataframe and array output.

Additionally, it's not clear what value range the eccentricity values can take.

Description

Output

Counts for all Features in dataframe output and labels in painted map output stay the same regardless of selected eccentricity threshold.

Expected

Ratio of internalized/peripherical nuclei should change in function of eccentricity threshold.

Possible issue / Proposed solution

I believe the issue is that the param eccentrictiy_thresh in run_he_analysis is not passed to the internal functions predict_all_cells and single_cell_analysis.

Python example output

Running the analysis directly from Python using the run_he_analysis function with different thresholds results in identical values as in plot below:

eccentricity_threshold_test

CLI example output

myoquant he-analysis ./dapi/dapi_00.tif --cellpose-path ./tritc/tritc_00_cp_masks.tif --stardist-path ./dapi/dapi_00_labels.tif --output-path ./ --eccentricity-thresh 2

Screenshot from 2022-11-17 11-47-16

myoquant he-analysis ./dapi/dapi_00.tif --cellpose-path ./tritc/tritc_00_cp_masks.tif --stardist-path ./dapi/dapi_00_labels.tif --output-path ./ --eccentricity-thresh 0.1

Screenshot from 2022-11-17 11-46-58

Recommend Projects

  • React photo React

    A declarative, efficient, and flexible JavaScript library for building user interfaces.

  • Vue.js photo Vue.js

    🖖 Vue.js is a progressive, incrementally-adoptable JavaScript framework for building UI on the web.

  • Typescript photo Typescript

    TypeScript is a superset of JavaScript that compiles to clean JavaScript output.

  • TensorFlow photo TensorFlow

    An Open Source Machine Learning Framework for Everyone

  • Django photo Django

    The Web framework for perfectionists with deadlines.

  • D3 photo D3

    Bring data to life with SVG, Canvas and HTML. 📊📈🎉

Recommend Topics

  • javascript

    JavaScript (JS) is a lightweight interpreted programming language with first-class functions.

  • web

    Some thing interesting about web. New door for the world.

  • server

    A server is a program made to process requests and deliver data to clients.

  • Machine learning

    Machine learning is a way of modeling and interpreting data that allows a piece of software to respond intelligently.

  • Game

    Some thing interesting about game, make everyone happy.

Recommend Org

  • Facebook photo Facebook

    We are working to build community through open source technology. NB: members must have two-factor auth.

  • Microsoft photo Microsoft

    Open source projects and samples from Microsoft.

  • Google photo Google

    Google ❤️ Open Source for everyone.

  • D3 photo D3

    Data-Driven Documents codes.