Giter VIP home page Giter VIP logo

ggspatial's Introduction

ggspatial

ggspatial on CRAN Coverage Status Lifecycle: stable R-CMD-check

Spatial data plus the power of the ggplot2 framework means easier mapping.

Installation

The package is available on CRAN, and can be installed using install.packages("ggspatial"). The development version can be installed via remotes.

install.packages("ggspatial")

Or for the development version:

install.packages("remotes") # if remotes isn't installed
remotes::install_github("paleolimbot/ggspatial")

Introduction

This package is a framework for interacting with spatial data using ggplot2 as a plotting backend. The package supports sf package objects, sp package objects, and raster package objects, and uses geom_sf() and coord_sf() to do most of the heavy lifting with respect to coordinate transformation.

library(ggplot2)
library(ggspatial)
load_longlake_data()

ggplot() +
  # loads background map tiles from a tile source
  annotation_map_tile(zoomin = -1) +
  
  # annotation_spatial() layers don't train the scales, so data stays central
  annotation_spatial(longlake_roadsdf, size = 2, col = "black") +
  annotation_spatial(longlake_roadsdf, size = 1.6, col = "white") +

  # raster layers train scales and get projected automatically
  layer_spatial(longlake_depth_raster, aes(colour = after_stat(band1))) +
  # make no data values transparent
  scale_fill_viridis_c(na.value = NA) +
  
  # layer_spatial trains the scales
  layer_spatial(longlake_depthdf, aes(fill = DEPTH_M)) +
  
  # spatial-aware automagic scale bar
  annotation_scale(location = "tl") +

  # spatial-aware automagic north arrow
  annotation_north_arrow(location = "br", which_north = "true")

ggspatial's People

Contributors

brentthorne avatar c-brendel avatar caijun avatar dieghernan avatar joshobrien avatar paleolimbot avatar potash avatar rsbivand avatar thiesben avatar

Stargazers

 avatar  avatar  avatar  avatar  avatar  avatar  avatar  avatar  avatar  avatar  avatar  avatar  avatar  avatar  avatar  avatar  avatar  avatar  avatar  avatar  avatar  avatar  avatar  avatar  avatar  avatar  avatar  avatar  avatar  avatar  avatar  avatar  avatar  avatar  avatar  avatar  avatar  avatar  avatar  avatar  avatar  avatar  avatar  avatar  avatar  avatar  avatar  avatar  avatar  avatar  avatar  avatar  avatar  avatar  avatar  avatar  avatar  avatar  avatar  avatar  avatar  avatar  avatar  avatar  avatar  avatar  avatar  avatar  avatar  avatar  avatar  avatar  avatar  avatar  avatar  avatar  avatar  avatar  avatar  avatar  avatar  avatar  avatar  avatar  avatar  avatar  avatar  avatar  avatar  avatar  avatar  avatar  avatar  avatar  avatar  avatar  avatar  avatar  avatar  avatar

Watchers

 avatar  avatar  avatar  avatar  avatar  avatar  avatar  avatar  avatar  avatar  avatar  avatar  avatar

ggspatial's Issues

Unexpected behaviour when plotting raster data with layer_spatial

Hi,

I have found a few issues with how layer_spatial plots raster data.

My initial issue was with the default interpolation of raster data. This seems like it should not be the default or come with a warning. But a specific concern is that it interpolated the colours between NA values and data values which doesn't make sense even when interpolate is TRUE.

When trying to make a simple reprex of the above behaviours I found a few other concerns:

  • layer_spatial with interpolate = FALSE is incorrectly showing data in area from 40.0-40.2 and 40.8-41.0 (3rd example plot)
  • layer_spatial with interpolate = FALSE is showing NAs where there are actual no data cells (3rd example plot)

I have made a simple example below. I am using ggspatial_1.1.2

Thanks

library(ggplot2)
library(ggspatial)
library(raster)
#> Loading required package: sp


r <- raster(extent(30,31,40,41),ncol=5, nrow=5, crs = "+proj=longlat +datum=WGS84")
values(r) <- c(rep(NA,5),1,2,3:15, rep(NA, 5))

#plot using raster::plot - correctly shows band of grey NAs top and bottom
raster::plot(r, colNA = "grey")

#default layer_spatial, grey on all sides with blending from real colours to NA colour
ggplot()+
   layer_spatial(r)+coord_sf(crs =  "+proj=longlat +datum=WGS84", expand = 0)

#layer_spatial with interpolate = FALSE. Grey is on all 4 sides not just top and bottom. 
# 40.8-41 and 40-40.2 which should be NA are plotting as values
ggplot()+
   layer_spatial(r,interpolate = FALSE)+coord_sf(crs =  "+proj=longlat +datum=WGS84", expand = 0)

#plotted by converting to data.frame and using ggplot2 for comparison
df_r <- as.data.frame(r, xy = TRUE)

ggplot(df_r, aes(x = x, y = y))+geom_tile(aes(fill = layer))+coord_quickmap(expand = F)

Created on 2020-06-02 by the reprex package (v0.3.0)

Add a "annotation_northarrow()" in ggspatial

Hey @paleolimbot

I was thinking that it would be really cool if you were able to port over the addnortharrow() function from prettymapr in the same way you created the annotation_scale() function from addscalebar()

I really liked the approach you took to building the north arrow in prettymapr rather than using a pre saved image like other solutions use. It really allowed for seamless styling.

Let me know what you think!

-Brent

Unable to change legend.key background for points when layer_spatial is used

Hi,
When using layer_spatial the point background (for factor points) is very dark. In a normal ggplot this would automatically match the underlying theme. layer_spatial is also making it impossible to change the background using the theme elements to something more appropriate to your plot (or wildly inappropriate as attempted below).

  library(ggspatial)

library(ggplot2)
library(dplyr)

library(sf)
#> Linking to GEOS 3.6.1, GDAL 2.2.3, PROJ 4.9.3
load_longlake_data()


longlake_depthdf <- longlake_depthdf %>% 
  mutate(group_nm = sample(letters[1:4], n(),replace = T))

#try using layer_spatial for points layer
ggplot() +
  layer_spatial(longlake_depth_raster, aes(fill = stat(band1)), interpolate = F) +
  layer_spatial(longlake_depthdf, aes(col = group_nm)) +
  theme(legend.key = element_rect(fill = "purple"))

#try using base ggplot for point layer (and by default would match the theme set
longlake_depthdf_withcoord <- as.data.frame(st_coordinates(longlake_depthdf)) %>% 
  mutate(group_nm = sample(letters[1:4], n(),replace = T))

ggplot() +
  layer_spatial(longlake_depth_raster, aes(fill = stat(band1)), interpolate = F) +
  geom_point(data = longlake_depthdf_withcoord, aes(x=X,y=Y,col = group_nm)) +
  theme_bw()+
  theme(legend.key = element_rect(fill = "green"))

#without layer_spatial can change background

ggplot() +
  geom_point(data = longlake_depthdf_withcoord, aes(x=X,y=Y,col = group_nm)) +
  theme_bw()+
  theme(legend.key = element_rect(fill = "green"))

Created on 2020-07-02 by the reprex package (v0.3.0)

Shapes of shape aesthics are not shown in legend

ggplot2 has an example on the shape aesthetic in ?scale_shape:

library(ggplot2)
dsmall <- diamonds[sample(nrow(diamonds), 100), ]

(d <- ggplot(dsmall, aes(carat, price)) + geom_point(aes(shape = cut)))
#> Warning: Using shapes for an ordinal variable is not advised

Created on 2020-01-08 by the reprex package (v0.3.0)

I expected this to work with ggspatial as well, but no success:

library(ggplot2)
library(ggspatial)
load_longlake_data()
longlake_depthdf$fact <- factor(as.integer(longlake_depthdf$DEPTH_M))
ggplot() +
  
  scale_alpha_continuous(na.value = 0) +
  
  # layer_spatial() layers train the scales
  layer_spatial(longlake_depthdf, aes(col = DEPTH_M, shape  = fact))

Created on 2020-01-08 by the reprex package (v0.3.0)

Release ggspatial 2.0.0

Prepare for release:

  • devtools::check()
  • devtools::check_win_devel()
  • rhub::check_for_cran()
  • revdepcheck::revdep_check(num_workers = 4)
  • Polish NEWS
  • Polish pkgdown reference index
  • Draft blog post

Submit to CRAN:

  • usethis::use_version('major')
  • Update cran-comments.md
  • devtools::submit_cran()
  • Approve email

Wait for CRAN...

  • Accepted ๐ŸŽ‰
  • usethis::use_github_release()
  • usethis::use_dev_version()
  • Finish blog post
  • Tweet
  • Add link to blog post in pkgdown news menu

annotation_scale and annotation_north_arrow appear in all facets

I often do faceted plotting with ggplot.
However, if using facets with annotations, such as annotation_scale and annotation_north_arrow, appear on all facets. How would it be possible to make them appear only once, other than using patchwork or similar, instead of facets?

error with ggpolypath

Apparently getting the following when plotting polygons.

ggpolypath was created using a different version of ggproto

quick fix solution is to install a previous version of the package (that doesn't use ggpolypath):

devtools::install_github('paleolimbot/ggspatial', ref='1254e83')

Specify single colour polygon outlines in layer_spatial

Hi Dewey, sorry that this is probably a dumb question but I've been hacking away and for the life of me can't figure it out.

Following this tutorial I've plotted the California coastline then fishing landings in polygon squares, with the square fills coloured by the landings values. So far all good. The default polygon border colour is grey. I want to change it. But specifying (e.g.) colour = "white" in aes makes the lines red, seemingly with "white" being considered a new separate group of null value and which gets its own legend. If I set colour to the same group as I did for fills, that works (outlines match fills so the squares just look a little bigger), suggesting colour is the correct way to set this attribute. I tried making an object forcewhite = "white" and using that but got the same result.

Any chance you could point out what I'm missing? Surprised to find nobody else seems to have this problem. Which means I'm probably going about things the wrong way!! Cheers

ggplot() + 
  layer_spatial(cali, fill = "grey", lwd = 0) +
  layer_spatial(caltrawl, aes(fill = Anchovy_BPel, colour = forcewhite))

bad

copyright OSM

OSM requires credit for using their data: https://www.openstreetmap.org/copyright. When creating a plot with ggspatial, this does not happen. I think all tiles should by default have the "ยฉ OpenStreetMap contributorsโ€ in the lower right corner to match the requirements of OSM. Or maybe we have to move this issue to paleolimbot/rosm?

Add documentation for downsampling of rasters to speed up raster rendering

Just extending discussion from #9 to be its own issue.

The idea is to delay any action involving the original raster object until there is a known height, width, and target resolution, so that large rasters can be passed to annotation_spatial.Raster() without fear of taking forever to render.

Question for @mdsumner: What is the series of events that usually takes place during this operation? I had been thinking something like:

target_res <- calculate_target_res(bounds, height, width, dpi)

st_make_grid(plot_bounds, cellsize = target_res) %>% 
  st_transform(raster_crs) %>% 
  raster::extract(raster, .) %>%
  make_a_raster_grob()

...but maybe it's a bad idea to reverse project a grid from the coord_sf() CRS to the raster CRS and resample that way? The other option would be to raster::projectRaster() %>% raster::resample()? Or maybe you've solved this in the hypertidy/lazyraster package?

Would also be nice to apply this to a rasterGrob() somehow, since these also take forever to render?

ggspatial + osmplotr?

@paleolimbot - great package you've got there! Just a heads up that there is a lot of overlap with osmplotr, and it'd likely help us both to combine, merge, swap code. In particular, osmplotr currently uses osmar to get OpenStreetMap (OSM) data and plots only sp objects, but once osmdata has been reviewed at ropensci it'll go on CRAN and be adapted for sf as well as sp, so we'll both be solving your #5 at roughly the same time.

ggplot-ing sf objects ought to be much easier (and quicker) than equivalent sp objects.

sf update for 3D sp data

Hey Dewey,

I have noticed that using 3d sp data set gives this error when plotting with layer_spatial():

Error in bb_wrap(as.vector(sp::bbox(sp))) : 
  is.numeric(bb) && length(bb) == 4 is not TRUE

It seems to be an issue with the sf packaged which was brought up here sf: issue905.

It appears to have been fixed however I still get the error using ggspatial. Any suggestions on how to incorporate this fix?

Cheers! ๐Ÿ˜„

df_spatial does not preserve column names in @data

Thanks for updating the package :) There is a new issue with the CRAN update yesterday. Namely, the df_spatial() does not preserve column names in SpatialPointsDataFrames (probably also other spatial data frame classes) any longer. Before the update it did.

library(sp)
library(ggspatial)

tmp <- sp::SpatialPointsDataFrame(expand.grid(x = c(30, 60), y = c(40, 70)), proj4string = sp::CRS("+init=epsg:4326"), data = data.frame(feat_name = 1:4))
ggspatial::df_spatial(tmp)
#> # A tibble: 4 x 5
#>       x     y feature_id part_id `x_without_geom[df_geom$feature_id, ]`
#>   <dbl> <dbl>      <int>   <int>                                  <int>
#> 1    30    40          1       1                                      1
#> 2    60    40          2       1                                      2
#> 3    30    70          3       1                                      3
#> 4    60    70          4       1                                      4

Created on 2020-04-28 by the reprex package (v0.3.0)

geom_hline() error with plot of only layer_spatial() objects

While I was putting together an inset map for one of my figures I found that the geom_hline() and geom_vline() functions do not work.

My goal is to add a horizontal line that follows the y-axis grid along a specific major grid line. For my personal use I want to show a dotted line for the "Arctic Circle" on my inset map. Here is the example of what I want to accomplish but using your data and trying to add a geom_hline() to the yintercept at 45.9N:

library(ggspatial)
load_longlake_data()

ggplot() +
    # annotation_spatial() layers don't train the scales, so data stays central
  annotation_spatial(longlake_roadsdf, size = 2, col = "black") +
  annotation_spatial(longlake_roadsdf, size = 1.6, col = "white") +
  
  # raster layers train scales and get projected automatically
  layer_spatial(longlake_depth_raster, aes(fill = NULL, alpha = stat(band1)), fill = "darkblue") +
  scale_alpha_continuous(na.value = 0) +
  
  # layer_spatial trains the scales
  layer_spatial(longlake_depthdf, aes(col = DEPTH.M)) +
  
  # spatial-aware automagic scale bar
  annotation_scale(location = "tl") +

  #add hline
  geom_hline(yintercept =  45.9) +
  NULL

Results: Error in unit(x0, default.units) : 'x' and 'units' must have length > 0

Here is what I would like it to look like in theory (please excuse my awful mspaint edit...):
dream

Any advice you have on this please let me know or if you think this is an issue that should be over in ggplot2 I can bring this up to them as well.

Cheers

annotation_map_tile extent is a bit larger than panel extent

bottom right of annotation_map_tile extent reaches a bit over the panel border.
Example script to show the problem:
library(sp)
library("rgdal")
library("rgeos")
library("tibble")
library("sf")
library('mapdata')
library('maptools')
library(ggspatial)

setwd("c:/test")

ireland <- map('worldHires','Ireland', fill=TRUE)
ireland_poly_sp <- map2SpatialPolygons(ireland, IDs=ireland$names, proj4string=CRS("+proj=longlat +datum=WGS84"))
ireland_sf = st_as_sf(ireland_poly_sp)
ireland_29903 <- st_transform(mypoly_sf,29903) #irish grid
ggData <- ggplot(data = ireland_29903) +
annotation_map_tile(zoom = 9, cachedir = system.file("mcd.cache", package = "ggspatial")) +
geom_sf(fill="red", colour='black', size = 0.01) +
coord_sf(crs = 29903) +
labs(x = NULL, y = NULL) +
theme_light() +
theme(
axis.title=element_blank(),
panel.background = element_rect(fill = '#f3ecdb'),
panel.border=element_rect(colour='black', size=0.2),
legend.position = "none"
)
cairo_pdf(file="test_ggspatial.pdf")
plot(ggData)
dev.off()

test_ggspatial.pdf

Problem to install ggspatiall

I get this error when I try to install ggspatial. Could you help me to solve it?

install_github("paleolimbot/ggspatial")

Running `R CMD build`...
* checking for file โ€˜/tmp/Rtmp45j30y/remotes2d4b14c1ab0e/paleolimbot-ggspatial-e6ae6a4/DESCRIPTIONโ€™ ... OK
* preparing โ€˜ggspatialโ€™:
* checking DESCRIPTION meta-information ... OK
* checking for LF line-endings in source and make files and shell scripts
* checking for empty or unneeded directories
* building โ€˜ggspatial_1.0.4.9000.tar.gzโ€™
Installing package into โ€˜/home/marcos/R/x86_64-pc-linux-gnu-library/3.5โ€™
(as โ€˜libโ€™ is unspecified)
* installing *source* package โ€˜ggspatialโ€™ ...
** R
** inst
** byte-compile and prepare package for lazy loading
Error : .onLoad failed in loadNamespace() for 'sf', details:
  call: get(genname, envir = envir)
  error: object 'group_map' not found
ERROR: lazy loading failed for package โ€˜ggspatialโ€™
* removing โ€˜/home/marcos/R/x86_64-pc-linux-gnu-library/3.5/ggspatialโ€™
Error in i.p(...) : 
  (converted from warning) installation of package โ€˜/tmp/Rtmp45j30y/file2d4b5b1d3fef/ggspatial_1.0.4.9000.tar.gzโ€™ had non-zero exit status

> Sys.info()
                                      sysname                                       release 
                                      "Linux"                        "4.20.12-arch1-1-ARCH" 
                                      version                                      nodename 
"#1 SMP PREEMPT Sat Feb 23 15:11:34 UTC 2019"                                     "Nomad01" 
                                      machine                                         login 
                                     "x86_64"                                      "marcos" 
                                         user                                effective_user 
                                     "marcos"                                      "marcos" 

Font family for annotation_scale()

Hi @paleolimbot

It would be great to have the ability to specify font family and type for annotation_scale(). As of right now I am using the dev version of ggplot2 and everything else from ggspatial is working great so far, but when I knit my RMarkdown to pdf the scalebar doesn't have the font change as specified by my ggplot2::theme(text = element_text(family = "Palatino Linotype").

Thank again for the great work and let me know if you think this is a possibility!

Cheers,

-Brent

Changing text color of north_arrow_fancy_orienteering() not possible

Hey there,
I have a raster plot with a rather dark color scheme and want to overlay it with a white north arrow. When using north_arrow_fancy_orienteering() or north_arrow_fancy_minimal(), this works for the arrow and its line, but not for the letter 'N' above. For north_arrow_nautical(), however, this is not an issue. Am I missing something or does the text color get overwritten by something else?
Thanks!

library(raster)
library(ggplot2)
library(ggspatial)
r <- raster(matrix(1, ncol=3), crs=4326)
ggplot(r) + geom_raster(aes(x,y)) +
  scale_x_continuous(expand = c(0,0)) +
  scale_y_continuous(expand = c(0,0)) +
  annotation_north_arrow(location = 'tr',
                         style = north_arrow_fancy_orienteering(text_col = 'white',
                                                                                         line_col = 'white',
                                                                                         fill = 'white'))

Rplot

Support for the stars package?

I just found out of the existence of ggspatial thanks to the new r-spatial blogs, and it looks interesting.

In the last few months I found myself increasingly resorting to use stars rather than raster. It's still a young project, but it's evolving very fast. It interfaces well with sf, the author is the same so you can expect the same level of quality there. You could consider integrating stars in a similar way to the raster integration.

stars does not yet have a natural bridge to ggplot as sf does, so currently I usually transform data to sf polygons prior to plotting: this is slow, but allows to change projections without regridding. Do you do the same with raster, or do you use geom_tile (or _raster)? IIRC the latter two did not really play well with coordinate transformations.

Fatal error whenever I use layer_spatial()

First, thank you very much for the really handsome package! I think it's a great advantage to the ggplot community.

Unfortunately, whenever I try to use layer_spatial() my R Session aborts with a fatal error. It does not matter if I try to plot the longlake data or my own, I tried several raster and shapefiles. Probably the problem is not within the package but my system, yet I thought it might be interesting to see if anyone else has the same problems.

I use RStudio Version 1.1.463 on Linux Mint 19.1 Cinnamon
If I can provide any other relevant information, please let me know.

Same map displayed whaterver the map type

Hi,

I've tested your package and it is already a favorite one!
I've tried the map type parameter and it seems not to work as expected. Whatever the type, the same map is displayed.

library(ggspatial)
ggplot() +
# loads background map tiles from a tile source
annotation_map_tile(type = "stamenbw", zoomin = -1) +
# annotation_spatial() layers don't train the scales, so data stays central
annotation_spatial(longlake_roadsdf, size = 2, col = "black") +
annotation_spatial(longlake_roadsdf, size = 1.6, col = "white") +
# raster layers train scales and get projected automatically
layer_spatial(longlake_depth_raster, aes(fill = NULL, alpha = stat(band1)), fill = "darkblue") +
scale_alpha_continuous(na.value = 0) +
# layer_spatial trains the scales
layer_spatial(longlake_depthdf, aes(col = DEPTH.M)) +
# spatial-aware automagic scale bar
annotation_scale(location = "tl")
#> Error in ggplot(): could not find function "ggplot"

Feel free to send me some testing task,

Erwan

annotation_scale specified in map units

Would it be possible to have a parameter similar to tmap's tm_scale_bar(breaks=c(0, 100), ...) to tell annotation_scale() to draw only one section instead of the black-white pattern?

A nice side effect could be to provide control over the size for the scale bar in map units. Although, that is probably a separate feature wish.

Different parameters for the text size

For putting multiple maps on one page with gridExtra::arrangeGrob() I had to fiddle with all units and the text sizes.

The parameter controlling the size of the text is named differently and has different effects at least across annotation_scale(..., text_cex=0.5) and annotation_north_arrow(..., style=north_arrow_orienteering(text_size=4).

Would it be possible to harmonize the way the text size works?

README example does not work if ggplot2 is not loaded

In package code, I don't want to clutter the namespace and import all of ggplot2, so people often prefix functions with ::, but this does not work:

# library(ggspatial)
ggspatial::load_longlake_data()

ggplot2::ggplot() +
  # loads background map tiles from a tile source
  ggspatial::annotation_map_tile(zoomin = -1) +
  
  # annotation_spatial() layers don't train the scales, so data stays central
  ggspatial::annotation_spatial(longlake_roadsdf, size = 2, col = "black") +
  ggspatial::annotation_spatial(longlake_roadsdf, size = 1.6, col = "white") +
  
  # raster layers train scales and get projected automatically
  ggspatial::layer_spatial(longlake_depth_raster, ggplot2::aes(colour = ggplot2::stat(band1))) +
  # make no data values transparent
  ggplot2::scale_fill_viridis_c(na.value = NA) +
  
  # layer_spatial trains the scales
  ggspatial::layer_spatial(longlake_depthdf, ggplot2::aes(fill = DEPTH_M)) +
  
  # spatial-aware automagic scale bar
  ggspatial::annotation_scale(location = "tl") +
  
  # spatial-aware automagic north arrow
  ggspatial::annotation_north_arrow(location = "br", which_north = "true")
#> Error in eval(`_inherit`, env, NULL): object 'Stat' not found

Created on 2019-12-23 by the reprex package (v0.3.0)

Support for simple features

Imagine this is in the pipeline - just thought I'd flag as not mentioned in the docs I've seen. Looks like a powerful and useful package, adding to R's spatial data visualisation capabilities and nicely complementing the likes of tmap and mapview.

Error in CRS("+init=epsg:3857") : no system list, errno: 2

Just to be clear, is that the error that you mention in the README?

> ggplot() + geom_spatial(longlake_waterdf) + coord_fixed()
NOTE: rgdal::checkCRSArgs: no proj_defs.dat in PROJ.4 shared files
 Error in CRS("+init=epsg:3857") : no system list, errno: 2 

Error in st_as_sf.data.frame(point_coords, coords = c("x", "y"), crs = sf_crs) : missing values in coordinates not allowed

I am trying to add a scale bar to a projected map with a specified extent.

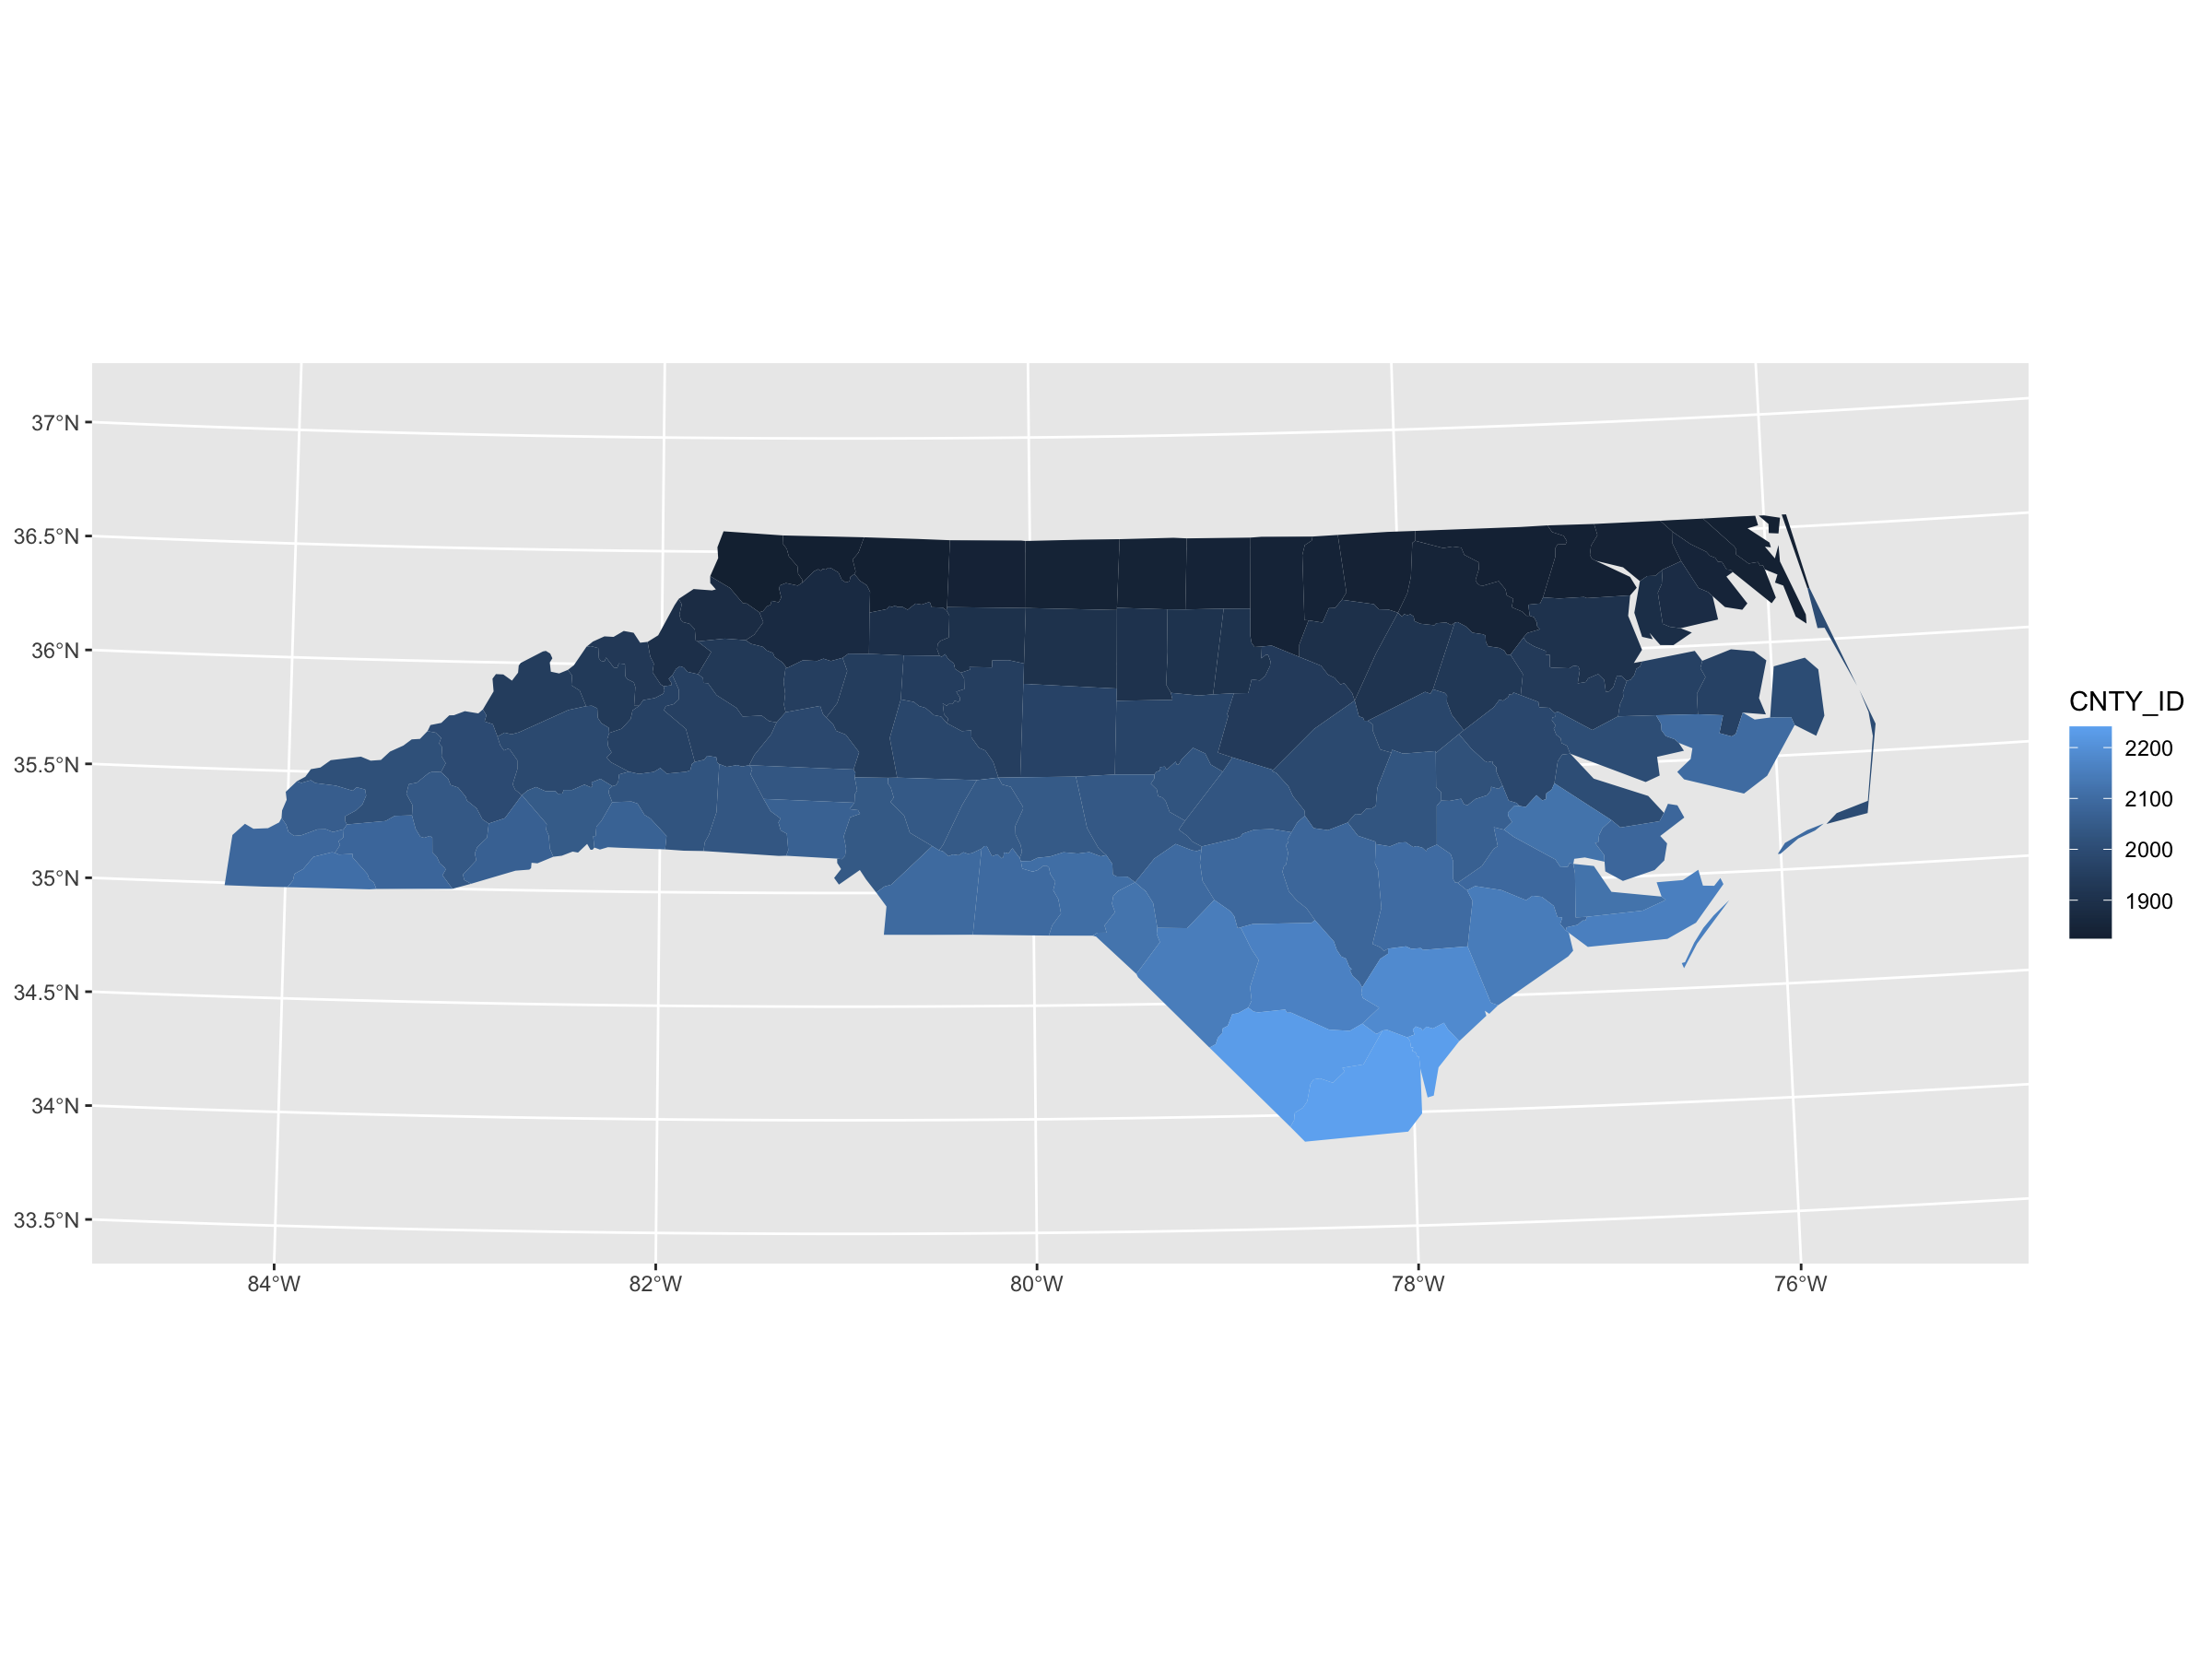
The first example shows the projected map without specifying the extent. The scale bar is successfully added to the map.

library(raster)
shpfile <- system.file("shape/nc.shp", package = "sf")

library(sf)
nc <- read_sf(shpfile)

library(ggspatial)
p <- ggplot(nc) + 
  geom_sf(aes(fill = CNTY_ID), color = NA) + 
  annotation_scale() + 
  coord_sf(crs = 26717)
p

image

The following codes specify the extent.

# extent of nc
(nc.bbox <- st_bbox(nc))
# longitude and latitude of lower left point
ll <- st_point(c(-84.5, 33.5))
# longitude and latitude of upper right point
ur <- st_point(c(-75, 37))
# WGS84
sfc <- st_sfc(ll, ur, crs = 4326)
sfc
sfc_proj <- st_transform(sfc, crs = 26717)
sfc_proj_bbox <- st_bbox(sfc_proj)

There is not error produced without adding a scale bar.

p <- ggplot(nc) + 
  geom_sf(aes(fill = CNTY_ID), color = NA) + 
  coord_sf(xlim = sfc_proj_bbox[c(1, 3)], ylim = sfc_proj_bbox[c(2, 4)], crs = 26717)
p

image

The following error is produced when trying to add a scale bar.

An error "Error in st_as_sf.data.frame(point_coords, coords = c("x", "y"), crs = sf_crs) : 
  missing values in coordinates not allowed" 
p <- ggplot(nc) + 
  geom_sf(aes(fill = CNTY_ID), color = NA) + 
  coord_sf(xlim = sfc_proj_bbox[c(1, 3)], ylim = sfc_proj_bbox[c(2, 4)], crs = 26717) + 
  annotation_scale()
p

My session information is as follows

> sessionInfo()
R version 3.6.3 (2020-02-29)
Platform: x86_64-apple-darwin19.3.0 (64-bit)
Running under: macOS Catalina 10.15.3

Matrix products: default
BLAS:   /System/Library/Frameworks/Accelerate.framework/Versions/A/Frameworks/vecLib.framework/Versions/A/libBLAS.dylib
LAPACK: /usr/local/Cellar/openblas/0.3.9/lib/libopenblasp-r0.3.9.dylib

locale:
[1] en_US.UTF-8/en_US.UTF-8/en_US.UTF-8/C/en_US.UTF-8/en_US.UTF-8

attached base packages:
[1] stats     graphics  grDevices utils     datasets  methods   base     

other attached packages:
[1] ggspatial_1.0.4.9000 sf_0.7-7            

loaded via a namespace (and not attached):
 [1] Rcpp_1.0.4         rstudioapi_0.11    magrittr_1.5       units_0.6-6        tidyselect_1.0.0   munsell_0.5.0     
 [7] colorspace_1.4-1   R6_2.4.1           rlang_0.4.5        dplyr_0.8.5        tools_3.6.3        grid_3.6.3        
[13] packrat_0.5.0      gtable_0.3.0       KernSmooth_2.23-16 e1071_1.7-3        DBI_1.1.0          class_7.3-15      
[19] digest_0.6.25      assertthat_0.2.1   tibble_2.1.3       lifecycle_0.2.0    crayon_1.3.4       farver_2.0.3      
[25] purrr_0.3.3        ggplot2_3.3.0      glue_1.3.2         labeling_0.3       compiler_3.6.3     pillar_1.4.3      
[31] scales_1.1.0       classInt_0.4-2     pkgconfig_2.0.3

How to limit plot extent

Taking the README example, I tried to limit the extent of the map to exactly the boundary of the raster used (my non-simplified use case is a square raster area and I want it to match the map extend, otherwise I have some sort of frame around my plot):

I tried scale_y_continuous(expand = ggplot2::expand_scale()). Unfortunately, this did not work:

library(ggplot2)
library(ggspatial)
load_longlake_data()

ggplot() +
  # loads background map tiles from a tile source
  annotation_map_tile(zoomin = -1) +
  # raster layers train scales and get projected automatically
  layer_spatial(longlake_depth_raster, aes(colour = stat(band1))) +
  # make no data values transparent
  scale_fill_viridis_c(na.value = NA) +
  
  # layer_spatial trains the scales
  layer_spatial(longlake_depthdf, aes(fill = DEPTH_M)) + 
  scale_x_continuous(expand = ggplot2::expand_scale()) + 
  scale_y_continuous(expand = ggplot2::expand_scale())
#> Warning: Ignoring unknown aesthetics: colour
#> Zoom: 14
#> Fetching 6 missing tiles
#>   |                                                                              |                                                                      |   0%  |                                                                              |============                                                          |  17%  |                                                                              |=======================                                               |  33%  |                                                                              |===================================                                   |  50%  |                                                                              |===============================================                       |  67%  |                                                                              |==========================================================            |  83%  |                                                                              |======================================================================| 100%
#> ...complete!
#> Warning: Removed 9122 rows containing missing values (geom_raster).

Created on 2020-01-24 by the reprex package (v0.3.0)

I hope I don't miss the obvious.

Note that this is very similar to the initial problem described in #46, which lead to the implementation of shadow_spatial(). After giving it a second thought, I am not sure this implementation is as general as it could be. Because it's not only that you want to expand the limits of the map (as my initial idea was in #46), sometimes you want the opposite: limit them. I thin think shadow_spatial() does not support this (and the name would also not fit this functionality).

Reprex:

library(ggplot2)
library(ggspatial)
load_longlake_data()

ggplot() +
  shadow_spatial(sf::st_bbox(longlake_depthdf[1, ])) +
  layer_spatial(longlake_depthdf, aes(col = DEPTH_M))

ggplot() +
  shadow_spatial(sf::st_bbox(longlake_depthdf)) +
  layer_spatial(longlake_depthdf, aes(col = DEPTH_M))

Created on 2020-01-24 by the reprex package (v0.3.0)

The concept of a bounding box seems to me to be superior to the idea of shadowing in this context now... How would you approach this problem?

Confusing documentation

Hey,
Question about documentation, is layer_spatial a wrapper for all the others?

If so the documentation is quite confusing as a number of the examples both myself and a colleague come across regularly pass rasters straight to layer_spatial rather than layer_spatial.Raster which means when you look at the documentation you miss key details such as interpolate = TRUE by default (why is that?) and it becomes not easy to track down why rasters come out looking weird.

Limiting extent with coord_sf() and annotation_scale()

This may be similar to Issue #62, but I've recently encountered a problem when adding annotation_scale() to a working ggplot2 object with limits specified in coord_sf(). For example, this works:

library(ggplot2)
library(ggspatial)

# Load system file
nc <- st_read(system.file("shape/nc.shp", package="sf"))

# Define bounding box
map.bounds <- st_bbox(nc)

# Make basic plot, setting xlim/ylim
ggplot() + 
  geom_sf(data = nc) + 
  coord_sf(xlim = c(map.bounds["xlim"], map.bounds["xmax"]),
           ylim = c(map.bounds["ylim"], map.bounds["ymax"])) 

but this fails:

# Add annotation scale
ggplot() + 
  geom_sf(data = nc) + 
  coord_sf(xlim = c(map.bounds["xlim"], map.bounds["xmax"]),
           ylim = c(map.bounds["ylim"], map.bounds["ymax"])) + 
  annotation_scale()

with the following error message: Error in st_as_sf.data.frame(point_coords, coords = c("x", "y"), crs = sf_crs) : missing values in coordinates not allowed.

It appears that the problem exists with the named vector elements supplied by the result of st_bbox() passed to the ggplot2 object, because this seems to work just fine:

# Unname xlim/ylim
ggplot() + 
  geom_sf(data = nc) + 
  coord_sf(xlim = unname(c(map.bounds["xlim"], map.bounds["xmax"])),
           ylim = unname(c(map.bounds["ylim"], map.bounds["ymax"]))) + 
  annotation_scale()

, but I don't understand the internals of ggplot2::coord_sf() to know why.

Any ideas?

For now using unname() in the coord_sf() bit is a fine workaround, but I'm curious to know if this is expected behavior or a bug.

Thanks!

North Arrow text col error

Hey Dewey,

Looks like the text grobs for north arrow styles are missing the col= text_col option:

gp = grid::gpar(
        fontsize = text_size,
        fontface = text_face,
        fontfamily = text_family,
        col = text_col
      )

All styles except for the north_arrow_nautical() are missing it. Let me know if you want me to make a pull request to fix it or if you want to take care of it!

Cheers

Some .id values are present in attrs and missing in fortified

Hi I don't know how to fix this error. Can you help me? Please tell me if you need more information.
Thank you!.

spatial_fortify(data_barrio)
Error in spatial_fortify.default(x, attrs, ...) : 
  Some .id values are present in attrs and missing in fortified

Fix warnings in raster rendering

test-layer-spatial-raster.R:207: warning: layer-spatial works for stars objects
no non-missing arguments to max; returning -Inf

(not replicated in the console, so it's hard to track down)

Use vdiffr

(instead of the slew of print(ggplot() + ...) calls I have now)

Support for plotting with bounding box

I would like to make a plot that is more size-stable and I could not find a way to do that. For example, if want to put two maps of the same extent next to each other in a report, but plot different geometries, the size (ratios) will generally vary. I am not so familiar with the package, but it seemed to me that annotation_map_tile() could gain a bbox argument, so the user can specify the tile to be fetched with rosm more preciesly. Is that a feature you would consider to add? Maybe there is also another way to control the behavior in ggplot2, but I could not find one. Thanks for this cool package.

Just that we are on the same page, I'd like to make the below map fit a custom bounding box.

library(ggplot2)
library(ggspatial)
load_longlake_data()

ggplot() +
  annotation_map_tile(zoom = 13, cachedir = system.file("rosm.cache", package = "ggspatial")) +
  geom_sf(data = longlake_waterdf, fill = NA, col = "grey50")
#> Zoom: 13

Created on 2019-09-11 by the reprex package (v0.3.0)

Make geom_spatial_* functions silent

I am using the ggspatial package in another ggplot based mapping package to handle complex bathymetry shapes (https://github.com/MikkoVihtakari/PlotSvalbard). I do not use coord_sf() in that package but handle the projections internally. Every time I use the geom_spatial_* functions they keep complaining about the projection:

Assuming crs = 4326 in stat_spatial_identity()
Warning message:
Ignoring transformation in stat_spatial_identity(). Use coord_sf() with a crs to project this layer. 

Since my package is based on ggplot, the only way turning off warnings and messages is to wrap the plot call into the print function. This adds unnecessary complexity to my code.

Could it be possible to add a "silent" argument to the stat_spatial_identity and geom_spatial_* functions and give the user a possibility to turn off the warnings? These warnings do not seem that relevant always.

Example for plotting continuous raster values without background

Hi, thanks for the great pkg. Finally a pkg for spatial data with ggplot ๐Ÿ‘

I was wondering if you could add a similar example as below to the vignette/README? It took me ~ 45 mins to figure out

  1. How to get rid of the background data so it does not appear grey (by using aes(fill = stat(band1)) and na.value = NA together)
  2. How to plot continuous color values instead of using alpha
library(ggplot2)
library(ggspatial)
load_longlake_data()

ggplot() + 
  annotation_map_tile(zoomin = -1) +
  layer_spatial(longlake_depth_raster, aes(fill = stat(band1))) +
  scale_fill_viridis_c(na.value = NA) +
  annotation_scale(location = "tl") +
  annotation_north_arrow(location = "br", which_north = "true")
#> Zoom: 14
#> Fetching 6 missing tiles
#> 
  |                                                                       
  |                                                                 |   0%
  |                                                                       
  |===========                                                      |  17%
  |                                                                       
  |======================                                           |  33%
  |                                                                       
  |================================                                 |  50%
  |                                                                       
  |===========================================                      |  67%
  |                                                                       
  |======================================================           |  83%
  |                                                                       
  |=================================================================| 100%
#> ...complete!
#> Warning: Removed 9122 rows containing missing values (geom_raster).

Created on 2019-01-10 by the reprex package (v0.2.1)

Recommend Projects

  • React photo React

    A declarative, efficient, and flexible JavaScript library for building user interfaces.

  • Vue.js photo Vue.js

    ๐Ÿ–– Vue.js is a progressive, incrementally-adoptable JavaScript framework for building UI on the web.

  • Typescript photo Typescript

    TypeScript is a superset of JavaScript that compiles to clean JavaScript output.

  • TensorFlow photo TensorFlow

    An Open Source Machine Learning Framework for Everyone

  • Django photo Django

    The Web framework for perfectionists with deadlines.

  • D3 photo D3

    Bring data to life with SVG, Canvas and HTML. ๐Ÿ“Š๐Ÿ“ˆ๐ŸŽ‰

Recommend Topics

  • javascript

    JavaScript (JS) is a lightweight interpreted programming language with first-class functions.

  • web

    Some thing interesting about web. New door for the world.

  • server

    A server is a program made to process requests and deliver data to clients.

  • Machine learning

    Machine learning is a way of modeling and interpreting data that allows a piece of software to respond intelligently.

  • Game

    Some thing interesting about game, make everyone happy.

Recommend Org

  • Facebook photo Facebook

    We are working to build community through open source technology. NB: members must have two-factor auth.

  • Microsoft photo Microsoft

    Open source projects and samples from Microsoft.

  • Google photo Google

    Google โค๏ธ Open Source for everyone.

  • D3 photo D3

    Data-Driven Documents codes.