rkillick / changepoint Goto Github PK
View Code? Open in Web Editor NEWA place for the development version of the changepoint package on CRAN.
A place for the development version of the changepoint package on CRAN.


Where and how can I install changeppoint.influence?
The residual method would calculate the residuals for an output, with option for ncpts for CROPS.
hi @rkillick I'm trying to get the segment means computed by binary segmentation, which appear to be incorrect below.
> changepoint::cpt.mean(c(1,2,4), penalty="Manual", method="BinSeg", pen.value=0, Q=1)@param.est
$mean
[1] 1.000000 2.333333
# I expected 1.5, 4
> changepoint::cpt.mean(c(1,2,4), penalty="Manual", method="BinSeg", pen.value=0, Q=2)@param.est
$mean
[1] 1.000000 1.000000 2.333333
# I expected 1,2,4
> changepoint::cpt.mean(c(1,2,4), penalty="Manual", method="BinSeg", pen.value=0, Q=3)@param.est
$mean
[1] 1.000000 1.000000 1.000000 2.333333
# I expected error because there can not be Q=3 changepoints in 3 data points.
> Would it be possible to pass graphical parameters like 'type="h"' to plot() function?
(‘histogram’ like (or ‘high-density’) vertical lines)
Like in
v1.crops=cpt.var(ftse100$V2, method="PELT", penalty="CROPS", pen.value=c(5,500))
plot(v1.crops, diagnostic=TRUE, type="h")
Maybe it will be easier to compare drops in test statistics for different n.o. changepoints.
hi @rkillick I'm using changepoint in my teaching https://github.com/tdhock/cs499-599-fall-2020/blob/master/homeworks/8.org
I recommended my students use the code
changepoint::cpt.mean(logratio_vector, Q=100, method=”BinSeg”, penalty=”Manual”)and one student was wondering if it is normal to see a lot of warnings. For example,
> fit6 <- changepoint::cpt.mean(rnorm(10), penalty="Manual", method="BinSeg", pen.value=0, Q=6)
Warning message:
In BINSEG(sumstat, pen = pen.value, cost_func = costfunc, minseglen = minseglen,  :
  The number of changepoints identified is Q, it is advised to increase Q to make sure changepoints have not been missed.
>
But if I increase Q I get an error:
> fit7 <- changepoint::cpt.mean(rnorm(10), penalty="Manual", method="BinSeg", pen.value=0, Q=7)
Error in BINSEG(sumstat, pen = pen.value, cost_func = costfunc, minseglen = minseglen,  :
  Q is larger than the maximum number of segments 6
>
so that brings up two questions:
Thanks!
Toby
there appears to be a typo in the error message:
legnth --> length
Line 394 in 355e340
thanks for the package!
hi again @rkillick, after pulling current master that includes your changes from #45 , I now see
> changepoint::cpt.mean(c(1,2,4), penalty="Manual", method="BinSeg", pen.value=0, Q=4)@param.est
Error in BINSEG(sumstat, pen = pen.value, cost_func = costfunc, minseglen = minseglen,  :
  Q is larger than the length of the data length
> changepoint::cpt.mean(c(1,2,4), penalty="Manual", method="BinSeg", pen.value=0, Q=5)@param.est
Error in BINSEG(sumstat, pen = pen.value, cost_func = costfunc, minseglen = minseglen,  :
  Q is larger than the maximum number of segments 4
>
I was expecting these two errors to be the same. And I would have expected it to say the max number of segments it 3 (because there are 3 data points). Also the error "Q is larger than the max number of segments" may be confusing because Q is documented as "The maximum number of changepoints"
hi @rkillick am I correct that changepoint package will no longer support SegNeigh method?
If that is the case, can we copy the old SegNeigh code to a new/different R package? (maybe as a GSOC project for next summer, which could also implement SNIP algorithm from Maidstone paper?)
I realize that it is slow but for small data and number of segments it is fast enough, and useful for teaching and comparison purposes.
I would like to continue using SegNeigh for teaching, because it is much easier to explain/understand than the penalized methods (PELT etc).
Hello,
I am trying to get the diagnostic plot of a model. I have tried the example that is in the source code
library(changepoint)

# Generate cpt.range object
testdata <- changepoint::ftse100$V2
obj.cpt.range <- cpt.var(testdata, method = "PELT",
                         penalty = "CROPS", pen.value = c(5, 500))

# For code coverage
plot(obj.cpt.range, diagnostic = TRUE)
plot(obj.cpt.range, diagnostic = TRUE, type = "h")
However, I am getting the following error and no plot is shown.
In doTryCatch(return(expr), name, parentenv, handler) :
"diagnostic" is not a graphical parameter
Could you please help?
Thanks!
Hi,
I am currently using the changepoint package in R in detecting changepoints in the mean and variance of a rainfall time series.
I would like to ask how can I estimate the statistical significance of the detected change points?
Are the detected change points already significant?
The data can be downloaded here:
https://www.dropbox.com/s/bihcvdlnac3agaa/clim.csv?dl=0
Im using the following commands to get the changepoints.
b=cpt.meanvar(test,"Manual",pen.value="1.5*log(n)",method="BinSeg",Q=2,test.stat="Normal")
I have read the manual and tutorial from this link:
http://members.cbio.mines-paristech.fr/~thocking/change-tutorial/RK-CptWorkshop.html
But it did not mention about the significance of the changepoints.
I''ll appreciate any help.
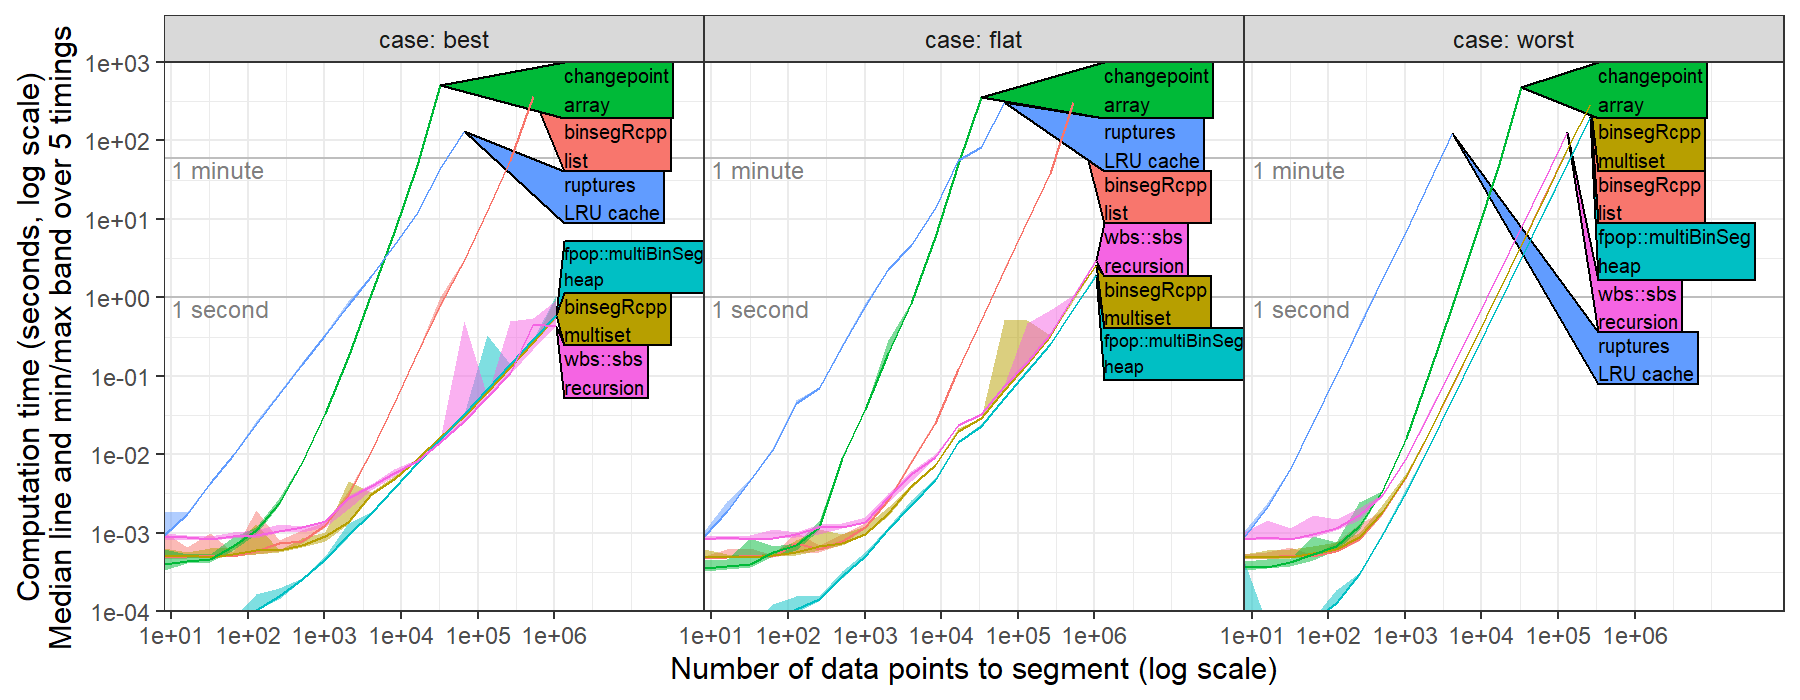
hi @rkillick I computed timings of changepoint::cpt.mean(method="Binseg") for the L2 loss (square loss, normal change in mean with constant variance), https://github.com/tdhock/binseg-model-selection#22-mar-2022
I simulated several data sets with number of data points N in { 2^2=4, ..., 2^20 = 1,048,576 } and I set max.changes = N/2-1, then ran binary segmentation, see https://github.com/tdhock/binseg-model-selection/blob/main/figure-timings-data.R for details.
I observed timings consistent with cubic O(N^3) asymptotic time complexity, whereas worst case should be quadratic O(N^2) and best case should be log linear O(N log N).
Hi,
Thanks for making changepoint a reality - I'm working on incorporating CP analyses into an automated workflow, and have run into a hurdle where the changepoint object returns one more changepoint locations than the list dat@cpts (which I'd like to use to be able to call the locations directly). Do you know if cpt.meanvar will always return the last x value as a changepoint? If so I can just drop the last one off :)
Some test data and what I found below:
dat <- structure(list(year = c(1L, 10L, 12L, 13L, 15L, 17L, 18L, 21L,
                        23L, 27L, 28L, 30L, 31L, 32L, 34L, 36L, 37L, 43L, 44L, 45L, 46L,
                        48L, 54L, 56L, 57L, 58L, 59L, 60L, 63L, 64L, 65L, 66L, 67L, 69L,
                        72L, 73L, 75L, 77L, 79L, 80L, 81L, 82L, 83L, 88L, 89L, 93L, 94L,
                        95L, 96L, 99L), y = c(-0.836247895854167, -0.281515072256679,
                                              -1.2041565129159, -0.341733562626997, -0.22443054331351, -0.278243927230703,
                                              -1.11263119068763, -0.768059438398383, -1.17445897461462, -0.0361278849478118,
                                              0.411890405056926, -1.1485944259541, -0.336876178849371, 0.12681057713124,
                                              -0.822892022065589, 0.164746929314433, -0.783690505991563, 0.268570875657203,
                                              0.138437680330203, -1.28643782070759, -0.467179444479306, 0.195410974540062,
                                              0.750195218719275, 1.0891030421355, 1.53362699396825, 2.32472169344723,
                                              2.46537793967258, 2.29575330229392, 3.59285078678843, 3.4609489157655,
                                              2.81818188382646, 3.60825335152284, 3.8231490511793, 4.98036157847448,
                                              5.53682320406975, 5.53604703286923, 5.99850440998717, 6.47301278466759,
                                              7.32191166231776, 7.21508917164472, 7.08528732127764, 8.40882212751775,
                                              8.18201440766599, 8.39834613047969, 9.70178451135652, 10.3869938287989,
                                              10.5494304469316, 11.529563715218, 10.8894989335741, 12.2573114191883
                        )), row.names = c(NA, -50L), class = c("tbl_df", "tbl", "data.frame"
                        ))

test <- cpt.meanvar(dat$y,penalty="Manual",pen.value=(2*log(length(dat$y))),method="BinSeg",Q=10,test.stat="Normal",class=TRUE,
            param.estimates=TRUE)

test
returns:
Changepoint Locations : 22 24 28 33 38 41 44
while
test@cpts
returns:
[1] 22 24 28 33 38 41 44 50
Good morning,
I have a question regarding the application of CUSUM in combination with Binary Segmentation. I read on the manual that this is suggested when it's not possible to make assumptions regarding the distribution of the data. Could you please suggest me a source where I can find the theoretical background on this?
I have already checked the material indicated in Page (1954) but the assumptions in that case are stronger.
Thanks a lot for your help,
SR
I tried detect change points in R. I've ran following MWE in R.
``
library(changepoint)
mydata = c(2000, 2100, 2400, 2000, 4500, 4000, 10000, 12000, 11000, 10000 ,10500, 12000, 10000, 5000, 4000, 4500, 5100, 3800, 4100, 4500)
cpoints=cpt.mean(mydata, penalty='Manual', pen.value='100000000*diffparam', method="PELT", class=TRUE)
plot(cpoints,cpt.width=3,cpt.col='red')
cpts(cpoints)
param.est(cpoints)
``
I am expecting 3 changepoints (same in graph). However, cpts(cpoints) returns only two detected change points. On the other hand, param.est(cpoints) returns three results. Am I missing something?
In the cpt class man page you say that the date slot is the “date and time the changepoint analysis was run”. However, in the following code the date slot reads as the date that I installed the package:
library("changepoint")
a <- new("cpt")
a@date ## "Sun Aug 11 04:01:03 2019"
b <- cpt.mean(rnorm(100))
b@date ## "Sun Aug 11 04:01:03 2019"
Hello,
I am using this software to detect changepoints in gene coverage data. In my case, I do not know how many change points are present in my data. Most of the time the data might not even have a "real" checkpoint. Could you please tell me how to understand the confidence of a cut-point? Is there a p-value of something that I can check?
Thank you.
hi @rkillick I'm running your implementation of binary segmentation, and I'm wondering what it means when there are zeros in the cpts.full matrix? I expected that all entries of the cpts.full matrix should be between 1 and the number of data points, so is this a bug? For example,
> changepoint::cpt.mean(1:4, method="BinSeg", Q=3)@cpts.full
     [,1] [,2] [,3]
[1,]    0   NA   NA
[2,]    0    0   NA
[3,]    0    0    0
In this case I get all zeros, which is highly unexpected. I expected the first changepoint to be at 2, then the next two to be at 1 and 3.
Another example is
> changepoint::cpt.mean(1:8, method="BinSeg", Q=3)@cpts.full
     [,1] [,2] [,3]
[1,]    4   NA   NA
[2,]    4    2   NA
[3,]    4    2    0
The output above shows that the first two changepoints are as expected. However the third changepoint is zero whereas I expected it should be 6.
thanks for the very nice package!
I was a little mislead by the statement "A changepoint is denoted as the first observation of the new segment / regime." in ?cpt.mean
I interpreted this as meaning that a changepoint at 100 means that there is a change between 99 and 100. But it seems that in fact it means there is a change between 100 and 101?
I'm trying to use the function on a ts object of 78 monthly observations but I get the Data must have atleast 2 observations to fit a changepoint model error when I do so.
The problem is in single.mean.norm, where dim(data) in line 4 returns [1] 78 1, and so ncol() is used on line 8 to calculate the number of observations instead of length() on line 5. On my ts object, ncol() returns 1, throwing the error incorrectly.
Hi again @rkillick I just wrote a project idea wiki page about a new R package for binary segmentation, https://github.com/rstats-gsoc/gsoc2021/wiki/Binary-segmentation
Would you be willing to co-mentor that project next summer? If so could you please add your info under the Mentors section on that page? (also please edit the page is there is anything unclear/incorrect)
Also I created the following table which maps gfpop distribution type values to changepoint loss function names, is that correct?
| gfpop type | changepoint cost | description |
|---|---|---|
| mean | mean_norm | Normal change in mean with constant variance |
| variance | var_norm | Normal change in variance with constant mean |
| poisson | meanvar_poisson | Poisson change in mean and variance |
| exp | meanvar_exp | Exponential change in mean and variance |
| negbin | NA | Negative binomial change in mean with constant variance |
In particular is it true that change in mean for negative binomial is not yet implemented in changepoint package?
I receive the following error when trying to run cpt.mean(x, method="SegNeigh"):
Error in multiple.mean.norm(data, mul.method = method, penalty, pen.value, : MBIC penalty not implemented for SegNeigh method, please choose an alternative penalty
The error is not intuitive and I am not sure which function this is coming from (tried (barely) to located in the package R files without success).
Would be great to either fix the bug and/or update the error. If the former, note that this command (cpt.mean + SegNeigh) is highlighted in your documentation.
Thanks!
Line 41 in 8c9c280
Can't use cpt.mean cusum without warning under any parameterization. Seems like at least one call to cpt.mean with cusum should not generate a warning?
Hi
I tried to set a small Q value with cpt.mean((x, method ="SegNeigh)" but this resulted into an error?
library(changepoint)
cpt.mean(rnorm(1000), Q = 2, penalty = "None", method  ="SegNeigh")
library(changepoint)
#> Loading required package: zoo
#>
#> Attaching package: 'zoo'
#> The following objects are masked from 'package:base':
#>
#>     as.Date, as.Date.numeric
#> Successfully loaded changepoint package version 2.2.2
#>  NOTE: Predefined penalty values changed in version 2.2.  Previous penalty values with a postfix 1 i.e. SIC1 are now without i.e. SIC and previous penalties without a postfix i.e. SIC are now with a postfix 0 i.e. SIC0. See NEWS and help files for further details.
cpt.mean(rnorm(1000), Q = 2, penalty = "None", method  ="SegNeigh")
#> Warning in cpt.mean(rnorm(1000), Q = 2, penalty = "None", method =
#> "SegNeigh"): SegNeigh is computationally slow, use PELT instead
#> Warning in segneigh.mean.norm(c(1.63028668584271, -0.467352865871377,
#> 0.950512411920853, : The number of segments identified is Q, it is advised
#> to increase Q to make sure changepoints have not been missed.
#> Error in (function (cl, name, valueClass) : assignment of an object of class "numeric" is not valid for @'cpts.full' in an object of class "cpt.range"; is(value, "matrix") is not TRUE
Created on 2018-10-15 by the reprex package (v0.2.0).
Thanks!
Matthieu
Hi Rebecca,
Thanks for this package. I am trying to detect the changepoints in my data using cpt.mean. However, I found that the scale of the datapoints has large effect on the result (see the dummy example below). I am wondering how I can find the right scale (since I can always scale-up/down the datapoints by a factor). Any suggestions? Thanks.
Yupeng
library(changepoint)
set.seed(1)
x=c(rnorm(100,0,1),rnorm(100,10,1))
cpt.mean(x/100,penalty="Asymptotic",pen.value=0.05,method="PELT")
cpt.mean(x,penalty="Asymptotic",pen.value=0.05,method="PELT")
I noticed that the scaling of the data matters, which seems undesirable (and unnecessary).
For example:
set.seed(51)
true_mean = rep(c(-0.2,0.1,1,-0.5,0.2,-0.5,0.1,-0.2),c(137,87,17,49,29,52,87,42))
genomdat = list(x = rnorm(500, sd=0.2) + true_mean, true_mean=true_mean)
The cpt.mean default does not find any changepoints:
genomdat.cp = cpt.mean(genomdat$x,method="PELT")
plot(genomdat.cp)
But if we multiply the data by 10 we find many changepoints.
genomdat.cp = cpt.mean(10*genomdat$x,method="PELT")
plot(genomdat.cp)
I speculate that perhaps the cost function (log-likelihood) implicitly assumes the variance
is 1?
Incidentally to this, while digging around the code to see if I could understand the issue, I
noticed that some places in the code
use "norm.mean" whereas others use "mean.norm". I'm not sure that was intended?
Matthews-MacBook-Air-2:changepoint stephens$ grep norm.mean src/*
src/BinSeg_one_func_minseglen.c:     char **cost_func; //Descibe the cost function used i.e. norm.mean.cost (change in mean in normal distributed data)
src/BinSeg_one_func_minseglen.c:  {"norm.mean", mll_mean},
src/BinSeg_one_func_minseglen.c:  {"norm.meanvar", mll_meanvar},
Matthews-MacBook-Air-2:changepoint stephens$ grep mean.norm src/*
src/BinSeg_one_func_minseglen.c:   else if (strcmp(*cost_func,"mean.norm")==0){
src/BinSeg_one_func_minseglen.c:   else if (strcmp(*cost_func,"mean.norm.mbic")==0){
src/PELT_one_func_minseglen.c:   else if (strcmp(*cost_func,"mean.norm")==0){
src/PELT_one_func_minseglen.c:   else if (strcmp(*cost_func,"mean.norm.mbic")==0){
According to https://cran.r-project.org/web/packages/changepoint/index.html
Depends: R (≥ 3.0)
It is not mentioned that higher R version is recommended.
On running with R version 3.0.2 (from Ubuntu package) I encountered
cpt.meanvar(data)
Error in checkData(data) : could not find function "anyNA"
According to http://www.r-statistics.com/2014/04/r-3-1-0-is-released/
New function anyNA(), a version of any(is.na(.)) which is fast for atomic vectors, based on a proposal by Tim Hesterberg. (Wish of PR#15239.)
So it is not present in 3.0.
Code was from https://www.gwern.net/Google%20Alerts
hey again @rkillick I'm using cpt.meanvar in class next week and I noticed that it can sometimes return segment variance of zero,
> changepoint::cpt.meanvar(c(0,0,4,5), penalty="Manual", method="PELT", pen.value=0)@param.est
$mean
[1] 0.0 4.5

$variance
[1] 0.00 0.25
I assume you are minimizing the negative log likelihood is that correct? In that case the cost of this model should be -Inf, right? Would it be possible to return the cost value, please? (it would be helpful)
In this case the variance is estimated as zero because there are two consecutive data points which have the same value.
I notice that you enforce minseglen=2 -- is this an effort to avoid segments of zero variance? i.e. only allow models which are "well-defined" in the sense that they have a finite log likelihood value?
If so you may consider an adaptive approach, by either using a run-length encoding/weights prior to running the algo OR by not allowing segments of zero variance during the algo.
FYI I used PELT above but the problem seems to affect SegNeigh as well.
I'm working with version 2.2.2 from CRAN and version 2.3.1 from GitHub. For both, the plot functionality is not working.
# change in mean
y=c(rnorm(100,0,1),rnorm(100,5,1))
ansmean=cpt.mean(y)
plot(ansmean,cpt.col='blue')

Error in as.double(y) :
  cannot coerce type 'S4' to vector of type 'double'
Thanks for a great job with the package.
Thanks for the great work on this package!
The behavior of changepoint::logLik.cpt() is problematic for three reasons:
double instead of an object of class logLik, and thus the resulting object doesn't have the attributes that logLik objects should have.This means that other generic functions already defined in stats like AIC() and BIC() don't work as expected.
library(changepoint)
#> Loading required package: zoo
#>
#> Attaching package: 'zoo'
#> The following objects are masked from 'package:base':
#>
#>     as.Date, as.Date.numeric
#> Successfully loaded changepoint package version 2.2.4
#>  See NEWS for details of changes.
x <- cpt.meanvar(wave.c44137, penalty = "AIC")

# current behavior
logLik(x)
#>      -2*logLik -2*Loglike+pen
#>       215528.5       215532.5
str(logLik(x))
#>  Named num [1:2] 215529 215533
#>  - attr(*, "names")= chr [1:2] "-2*logLik" "-2*Loglike+pen"
AIC(x)
#> Error in UseMethod("logLik"): no applicable method for 'logLik' applied to an object of class "cpt"
BIC(x)
#> Error in UseMethod("logLik"): no applicable method for 'logLik' applied to an object of class "cpt"
Created on 2024-04-03 with reprex v2.1.0
I think it would be better if changepoint::logLik.cpt() returned a logLik object with the appropriate attributes and values. Something like this should do the trick:
x <- changepoint::cpt.meanvar(changepoint::wave.c44137, penalty = "AIC")

logLik.cpt <- function(object, ...) {
  y <- changepoint::likelihood(object) |>
    suppressWarnings()
  ll <- -y[1] / 2
  attr(ll, "df") <- length(object@cpts)
  attr(ll, "nobs") <- length(object@data.set)
  class(ll) <- "logLik"
  return(ll)
}

# preferred behavior
logLik(x)
#> 'log Lik.' -107764.3 (df=2)
str(logLik(x))
#> Class 'logLik' : -107764 (df=2)
attributes(logLik(x))
#> $names
#> [1] "-2*logLik"
#>
#> $df
#> [1] 2
#>
#> $nobs
#> [1] 63651
#>
#> $class
#> [1] "logLik"
AIC(x)
#> [1] 215532.5
BIC(x)
#> [1] 215550.7
Created on 2024-04-03 with reprex v2.1.0
According to the documentation:
A changepoint is denoted as the first observation of the new segment / regime.
However, it looks like the cpt.mean functions return the last index of each segment. For example:
> x <- c(rnorm(n=10, 100), rnorm(n=10, 50))
> cpx <- cpt.mean(x)
> cpts(cpx)
> [1] 10
The tenth element is the last element of the series generated from a normal distribution with mean of 100. The eleventh element is the first element of the new segment with a mean of 50, right?
Hi, killick
I have completed detecting changepoints for my data. Following your guide, I should do the assumption check according to this website http://members.cbio.mines-paristech.fr/~thocking/change-tutorial/RK-CptWorkshop.html#checking-assumptions-if-time-allows.
You provide two methods, one is segment check and the other is residual check. Any differences between these two checks? I want to know which one should I choose? Or should I do both these two checks?
Thanks!
Jiangchao
Hello,
A warning is raised when using logLik on "cpt" class object returned from cpt.meanvar when method=SegNeigh, stating "Not changed to be -2logLik". I believe -2logLik is returned.
Hello,
When using cpt.meanvar with method=SegNeigh and sumstat = Poisson or Exp it appears an error is raised when Q > (length(data)+2)/2.
With sumstat = Poisson or Exp, I believe Q can be as large as length(data) since a segment of length 1 is possible.
Hi,
I have a quick question: why isn't it possible to use the PELT algorithm with the CUSUM statistics? What would you suggest to use for PELT when it's not possible to make any assumption on the distribution of the data?
Thanks,
SR
I noticed this specifically inside of cpt.var, but I imagine it applies to all other places that you check for 1D-ness via is.null(dim(x)).
If you make a vector then coerce it to an array, it gets a dim method. As a result in your checks for for 1D-ness in the package n becomes NULL for 1D- arrays and a missing where TRUE/FALSE needed error is thrown.
A solution would be to add a second check like:
is.null(dim(x)) || length(dim(x)) == 1
library(changepoint)
v <- rnorm(10)
a <- as.array(v)
cpt.var(v) # works
cpt.var(a)
## Error in if (n < 4) { : missing value where TRUE/FALSE needed
R version 4.2.0 Patched (2022-04-26 r82266)
Platform: x86_64-pc-linux-gnu (64-bit)
Running under: Ubuntu 22.04.1 LTS

Matrix products: default
BLAS:   /opt/R/R-latest/lib/R/lib/libRblas.so
LAPACK: /opt/R/R-latest/lib/R/lib/libRlapack.so

locale:
 [1] LC_CTYPE=en_US.UTF-8       LC_NUMERIC=C
 [3] LC_TIME=en_US.UTF-8        LC_COLLATE=en_US.UTF-8
 [5] LC_MONETARY=en_US.UTF-8    LC_MESSAGES=en_US.UTF-8
 [7] LC_PAPER=en_US.UTF-8       LC_NAME=C
 [9] LC_ADDRESS=C               LC_TELEPHONE=C
[11] LC_MEASUREMENT=en_US.UTF-8 LC_IDENTIFICATION=C

attached base packages:
[1] stats     graphics  grDevices utils     datasets  methods   base

loaded via a namespace (and not attached):
 [1] zoo_1.8-10        processx_3.7.0    compiler_4.2.0    R6_2.5.1
 [5] cli_3.3.0         tools_4.2.0       glue_1.6.2        grid_4.2.0
 [9] changepoint_2.2.3 callr_3.7.0       ps_1.7.0          pak_0.3.0.9000
[13] lattice_0.20-45
Add functionality to CROPS that allows someone to use "Inf" as an upper limit so that c(0,Inf) can be specified such that the whole range of segmentations is calculated.
Another option that would be nice is if someone could (additionally?) specify Q as the number of changepoints they are interested in and then CROPS would continue, trying an increasing range of penalties until the Q or (Q-1,Q+1) are identified. Recall that there is no guarantee that there will be a solution with Q changes exactly.
In class_input.R
if(method=="PELT"){
ncpts.max(ans)=Inf
}
should the maximum number of changepoints be n/minseglen?
Dear developer,
Thank you for this useful package!
pelt <- cpt.meanvar(mydata$height, test.stat = "Poisson", method = "BinSeg")
cpts(dis.pelt)
I have two questions:
(1) how can I get the represented value for each following segment?:
0-2140
2142 - 2517
2519 - 3179
3181 - 5000
(2) how can I put these value of the plot? Maybe some parameter in plot(pelt) ?
Best
I don't know if you will consider this a bug or not, but it baffled me for a while, so I'd figured I would report it.
data <- tidychangepoint::CET |>
  as.ts()

library(changepoint)
#> Loading required package: zoo
#>
#> Attaching package: 'zoo'
#> The following objects are masked from 'package:base':
#>
#>     as.Date, as.Date.numeric
#> Successfully loaded changepoint package version 2.2.4
#>  See NEWS for details of changes.

x <- cpt.meanvar(data, method = "PELT")
x@cpts
#> [1]  55  57 309 311 330 362
logLik(x)
#>      -2*logLik -2*Loglike+pen
#>           -Inf           -Inf

y <- cpt.meanvar(data, method = "PELT", minseglen = 3)
y@cpts
#> [1] 237 330 362
logLik(y)
#>      -2*logLik -2*Loglike+pen
#>       619.9626       656.9956
Created on 2024-04-04 with reprex v2.1.0
The problem occurs here, because there is a segment of length 2 with 0 variance, and thus the likelihood computation returns -Inf.
It seems weird to me that the algorithm works, but the logLik() returns -Inf. If not an error, perhaps at least a warning should be thrown?
Currently the data is extracted from the time series object and the extra information e.g. Years the observations were taken, is deleted. This should be kept, especially for plotting purposes.
Once done, thanks go to Catherine Buckland.
Hi,
First of all, changepoint and its derived libraries are great, thanks for releasing them!
In particular, I quite like the capability of EnvCpt to fit piecewise linear trends and knowing it calls the changepoint library I was looking to replace the former directly with latter in my scripts.
However, I noticed the cpt.reg class is currently commented out in cpt.R (changepoint v2.3) and it'd be helpful to get clarity on a couple of points, if possible:
For the Normal assumption with unknown mean, assuming the length of the time series is at least 2, cpt.var should allow segments of length 1. This would rarely make any difference in practice, but in theory, I don't think there's anything wrong with segments of length 1.
install.packages("changepoint")
error information
Error: package or namespace load failed for ‘changepoint’ in library.dynam(lib, package, package.lib):
 shared object ‘changepoint.so’ not found
Error: loading failed
Execution halted
ERROR: loading failed
any solutions for this ?
A declarative, efficient, and flexible JavaScript library for building user interfaces.
🖖 Vue.js is a progressive, incrementally-adoptable JavaScript framework for building UI on the web.
TypeScript is a superset of JavaScript that compiles to clean JavaScript output.
An Open Source Machine Learning Framework for Everyone
The Web framework for perfectionists with deadlines.
A PHP framework for web artisans
Bring data to life with SVG, Canvas and HTML. 📊📈🎉
JavaScript (JS) is a lightweight interpreted programming language with first-class functions.
Some thing interesting about web. New door for the world.
A server is a program made to process requests and deliver data to clients.
Machine learning is a way of modeling and interpreting data that allows a piece of software to respond intelligently.
Some thing interesting about visualization, use data art
Some thing interesting about game, make everyone happy.
We are working to build community through open source technology. NB: members must have two-factor auth.
Open source projects and samples from Microsoft.
Google ❤️ Open Source for everyone.
Alibaba Open Source for everyone
Data-Driven Documents codes.
China tencent open source team.