simonmoulds / lulcc Goto Github PK
View Code? Open in Web Editor NEWland use change modelling in R
License: GNU General Public License v3.0
land use change modelling in R
License: GNU General Public License v3.0


Hi everybody,
I've traced an issue when trying the function PredictionList after running it for a random forest model of classification type.
First of all, I think that the correct way to represent the absence--presence of a land type in a pixel as a response variable is as a factor for the glm, rpart and random forest predictive models. On the contrary, in the pie example of the package, a land use type is given as numeric to the predictive models. Thing is that in the three predictive models' respective packages it is specified that in cases as with the 0--1 absence--presence of a specific land type in each pixel, this response variable must be specified as a factor. For example, if you specify the presence of a land type as a factor variable, the random forest model is run as of classification type, returning also a 2 x 2 confusion matrix. This is not the case in the pie example documented in the package, in which a regression type random forest model is built, which falsely takes the response variable as continuous, also returning different results.
Now to the issue, if you specify a land type presence response variable as factor, and you build a random forest model, the PredictionList function returns an error "ROCR currently supports only evaluation of binary classification tasks". The PredictionList function initially runs a predict function with signature "PredictiveModelList" returning "0" or "1" labels of char type predicted by the random forest model. Note that if you do it with the glm or rpart models, it will return numeric probabilities. Now, the "0"--"1" labels of type char in the PredictionList function are fed to the ROCR::prediction function which compares them with the 0--1 numeric values of the test data. I suppose then that the error arises because the two vectors are of different type, and hence the 0--1 labels cannot be compared since they are taken as different labels (two labels from the char type, and two other labels from the numeric type).
I can think of two immediate workarounds: (1) edit the predict function with signature "PredictiveModelList" for the random forest models, to return numeric probabilities as for the glm and rpart models, instead of returning 0--1 char type labels; or (2) change the type of the 0--1 labels from char to numeric inside the PredictionList function.
I suggest using the first workaround (1), not only in order to return probabilities for the random forest models, as with the glm and rpart, but also because this predict function with signature "PredictiveModelList" can be used elsewhere. For example, as is now, you can't use this function for making suitability maps with random forest models of classification type, since it returns 0--1 values only, but you need probabilities for the maps.
The only edit needed in the predict function with signature "PredictiveModelList" is to replace this block:
if (inherits(mod, "randomForest")) {
    out[[i]] <- predict(object = mod, newdata = newdata,
                   type = "response", ...)
}
with this block
if (inherits(mod, "randomForest")) {
    out[[i]] <- predict(object = mod, newdata = newdata,
                   type = "prob", ...)[, 2]
}
I hope this helps!
Hi all,
Thank you so much for the excellent lulcc package. I am attempting to use the crossTabulate function to calculate gain and loss metrics as described by Pontius et al. in their 2004 paper (full pdf available via that link).
I have been able to calculate all of the metrics except for $$ Gij $$ (and its partner statistic $$ Lij $$). I was wondering if anyone might be able to provide some clarification on this calculation? I have generated a crosstab from Time period 1 to Time period 2.
The LaTeX equation is:
It should be a few relatively straightforward matrix operations, but I'm a bit stuff.
I would be happy to open a PR with this and the other metrics once I have sorted this out!
Hello,
Many thanks to Simon, and to the rest of contributors, for this novel and necessary addition to the R environment!
I can't work around an issue regarding input for the CluesModel function. In specific, I'm including a NeighbRasterStack object for its neighb parameter, and also a numeric with neighbourhood decision rules for its nb.rules parameter. I receive the error: "Error in .local(obs, ef, models, ...) : rule should be provided for each neighbourhood map".
I'm attaching a script based on the pie example of the package. In the documented example in the package material, the nb object created isn't used in the CluesModel (line 36 in the attached script); related, there is no input for the parameters neighb and nb.rules of the CluesModel. I'm including the nb object and the related decision rules in lines 52 and 55 of the attached script, but it seems that the length of the nb.rules vector doesn't match the number of neighbourhood layers of the nb object, which is obviously equal to 3. I've tried different formats and lengths for nb.rules, unsuccessfully though...
I guess I'm missing something due to my inexperience, but could you elucidate?
Many thanks!
githubQuestion.txt
I believe there is a flexibility issue when it comes to handling requests of data inputs at different timesteps.
According to the tutorial, the function getPredictiveModelInputData takes on timestep t as an argument. If I understand the code and the documentation correctly it passes t to as.data.frame.ObsLulcRasterStack and as.data.frame.ExpVarRasterList which then calls the hidden function .getExpVarRasterList. This functions works by indexing the layers of the different stacks of variables in ExpVarRasterList objects.
The tutorial seems to suggest that if the timesteps I inputed when creating my ObsLulcRasterStack object are 0, 6, 12, I could also input them in my call to getPredictiveModelInputData , such as:
train.data = getPredictiveModelInputData(obs=obs.lu,
                     ef=vars.lu,
                     cells=part.obs.lu[["train"]],
                     t=6) # or t = 0, or t = 12
This results is a message error (from .getExpVarRasterList) :
Error in .getExpVarRasterList(x@maps, t) :
  invalid t: dynamic explanatory variables, but no data for this time
The problems comes from the fact that .getExpVarRasterList looks up the index of the layers in the rasterStack with index <- t + 1 and maps[[i]] <- s[[index]] . The call to the function above won't work with instances of t that do not correspond to the index of the rasterstacks.
Changing the function call to match the stacks indices...
train.data = getPredictiveModelInputData(obs=obs.lu,
                     ef=vars.lu,
                     cells=part.obs.lu[["train"]],
                     t=1) # or t = 0, or t = 2
...generates the appropriate error message from as.data.frame.ObsLulcRasterStack:
no observed map at time 't': using setting t = 0 insteadAm I missing something of do you agree this should be fixed? I see three ways:
t, i.e. rank(maps@t) ; and modify .getExpVarRasterList so it matches the rank of the layers in the rasterstacks with the rank in the timesteps. Indeally, we could add a slot in the object definition of ObsLulcRasterStack objects that stores that rank (or index).t = c(1,2,3) when they define their ObsLulcRasterStack objects, but we loose the original intent to be able to keep the number of years (or months, or whatever) between timesteps as an implicit input.t = c(0,1,2) and t = c(0,6,12) works regardless (which would be a mix of the solutions above and my preferred solution)In addition we could consider having the fact that getPredictiveModelInputData takes on timestep t as an argument to be documented in the man page. Also the fact that the data corresponding to the first timestep is the default output.
I'd love to be able to contribute and offer a fix but I do not feel completely confident yet in about if this is indeed recognized as an issue and about which solution should be favored.
This package has been a truly priceless help for my master's thesis. It has allowed me to understand the basics of land use change modelling, and served as a great introduction to more advance R features for me. I would love to give back to this package and the author(s) behind it by becoming a more substantial contributor.
More than that, I really believe in the mission of the package: make LUC modeling more accessible and more transparent. After a full year of reading LUC modelling papers, I have come to think it is really needed and worth pursuing. This is why I think an awesome goal would be for this package to be part of the ROpenSci initiative. I would be very excited and motivated to start working toward that goal!
I understand this might be a lot to ask, but I am ready to put a considerable effort into this. I see so much potential with this package, it would make me sad to not try and achieve it. I see many ways to integrate other packages (R being full of powerful modelling and machine learning packages) and really think this package could become a truly major reference in LUC statistical modelling.
I have a lot of ideas to improve the package and would love to work toward implementing them:
/lulcc the parent directory and change the name of the repo to lullc. This would allow to use devtools::install_github("simonmoulds/lulcc") on the repo which is pretty nice! It would also help facilitate contributions greatly!sf package ReadMe page! https://github.com/r-spatial/sfRMarkDown. This would be very easy as there is already so much that is already written from the package Author's GMD paper and the demo written by the author.testthat package) and examples. This would improve the package reliability as we continue development. We could even set up Continuous Integration with Travis.#TODO tags have been left (a fun coding exercise and I say this with no sarcasm because I find it very interesting)I have done a few of these things with my "toy package" rgovcan (link), but not all of them. I would therefore welcome the opportunity to hone by development skills!
We have land use data (data from the Plum Island) from 3 years, say 1985, 1991 and 1999, and we would like the predict the future land use map for 2005. We predict it with the following code:
dmd <- approxExtrapDemand(obs=obs, tout=14:20)
clues.rules <- matrix(data=1, nrow=3, ncol=3, byrow=TRUE)
clues.parms <- list(jitter.f=0.0002,
                    scale.f=0.000001,
                    max.iter=1000,
                    max.diff=50,
                    ave.diff=50)
clues.model <- CluesModel(obs=obs,
                          ef=ef,
                         models=glm.models,
                         time=14:20,
                         demand=dmd,
                         elas=c(0.2,0.2,0.2),
                         rules=clues.rules,
                         params=clues.parms)
clues.model <- allocate(clues.model)
clues.model
And we got:
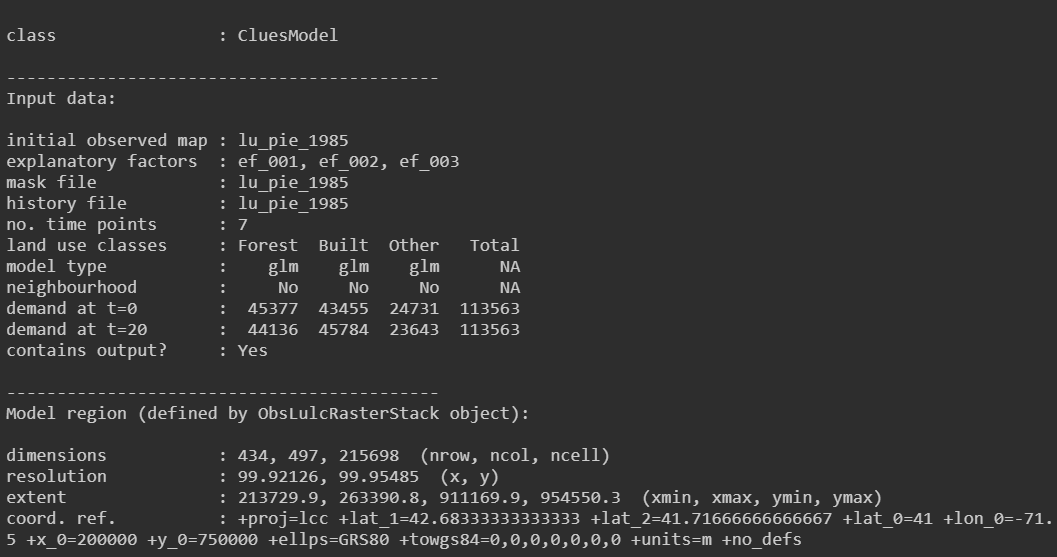
Does it means that the prediction for 2005(t=20) is based on map of 1985( t = 0)? Can we prediction the land use for 2005(t=20) based on map of 1999?
Cran version is 1.0.4, while current source code version in 1.0.2. I have noticed differences between the CRAN bundle and this github version. For instance, the code was differing for crossTabulate (which I fixed). Is there more updates to be merged into the current github source code so that we are on par with CRAN 1.0.4?
when i run the ObsLulcRasterStack function .it will get the wrong problem "Error in slot(value, what) :
no slot of name "srs" for this object of class "RasterStack""
A declarative, efficient, and flexible JavaScript library for building user interfaces.
🖖 Vue.js is a progressive, incrementally-adoptable JavaScript framework for building UI on the web.
TypeScript is a superset of JavaScript that compiles to clean JavaScript output.
An Open Source Machine Learning Framework for Everyone
The Web framework for perfectionists with deadlines.
A PHP framework for web artisans
Bring data to life with SVG, Canvas and HTML. 📊📈🎉
JavaScript (JS) is a lightweight interpreted programming language with first-class functions.
Some thing interesting about web. New door for the world.
A server is a program made to process requests and deliver data to clients.
Machine learning is a way of modeling and interpreting data that allows a piece of software to respond intelligently.
Some thing interesting about visualization, use data art
Some thing interesting about game, make everyone happy.
We are working to build community through open source technology. NB: members must have two-factor auth.
Open source projects and samples from Microsoft.
Google ❤️ Open Source for everyone.
Alibaba Open Source for everyone
Data-Driven Documents codes.
China tencent open source team.