![]()


TCC1 is a R/Bioconductor package provides a series of functions for performing differential expression (DE) analysis from RNA-seq count data using a robust normalization strategy (called DEGES).
The basic idea of DEGES is that potential differentially expressed genes (DEGs) among compared samples should be removed before data normalization to obtain a well-ranked gene list where true DEGs are top-ranked and non-DEGs are bottom ranked. This can be done by performing the multi-step normalization procedures based on DEGES (DEG elimination strategy) implemented in TCC.
TCC internally uses functions provided by edgeR2, DESeq23, and baySeq4 . The multi-step normalization of TCC can be done by using functions in the four packages.
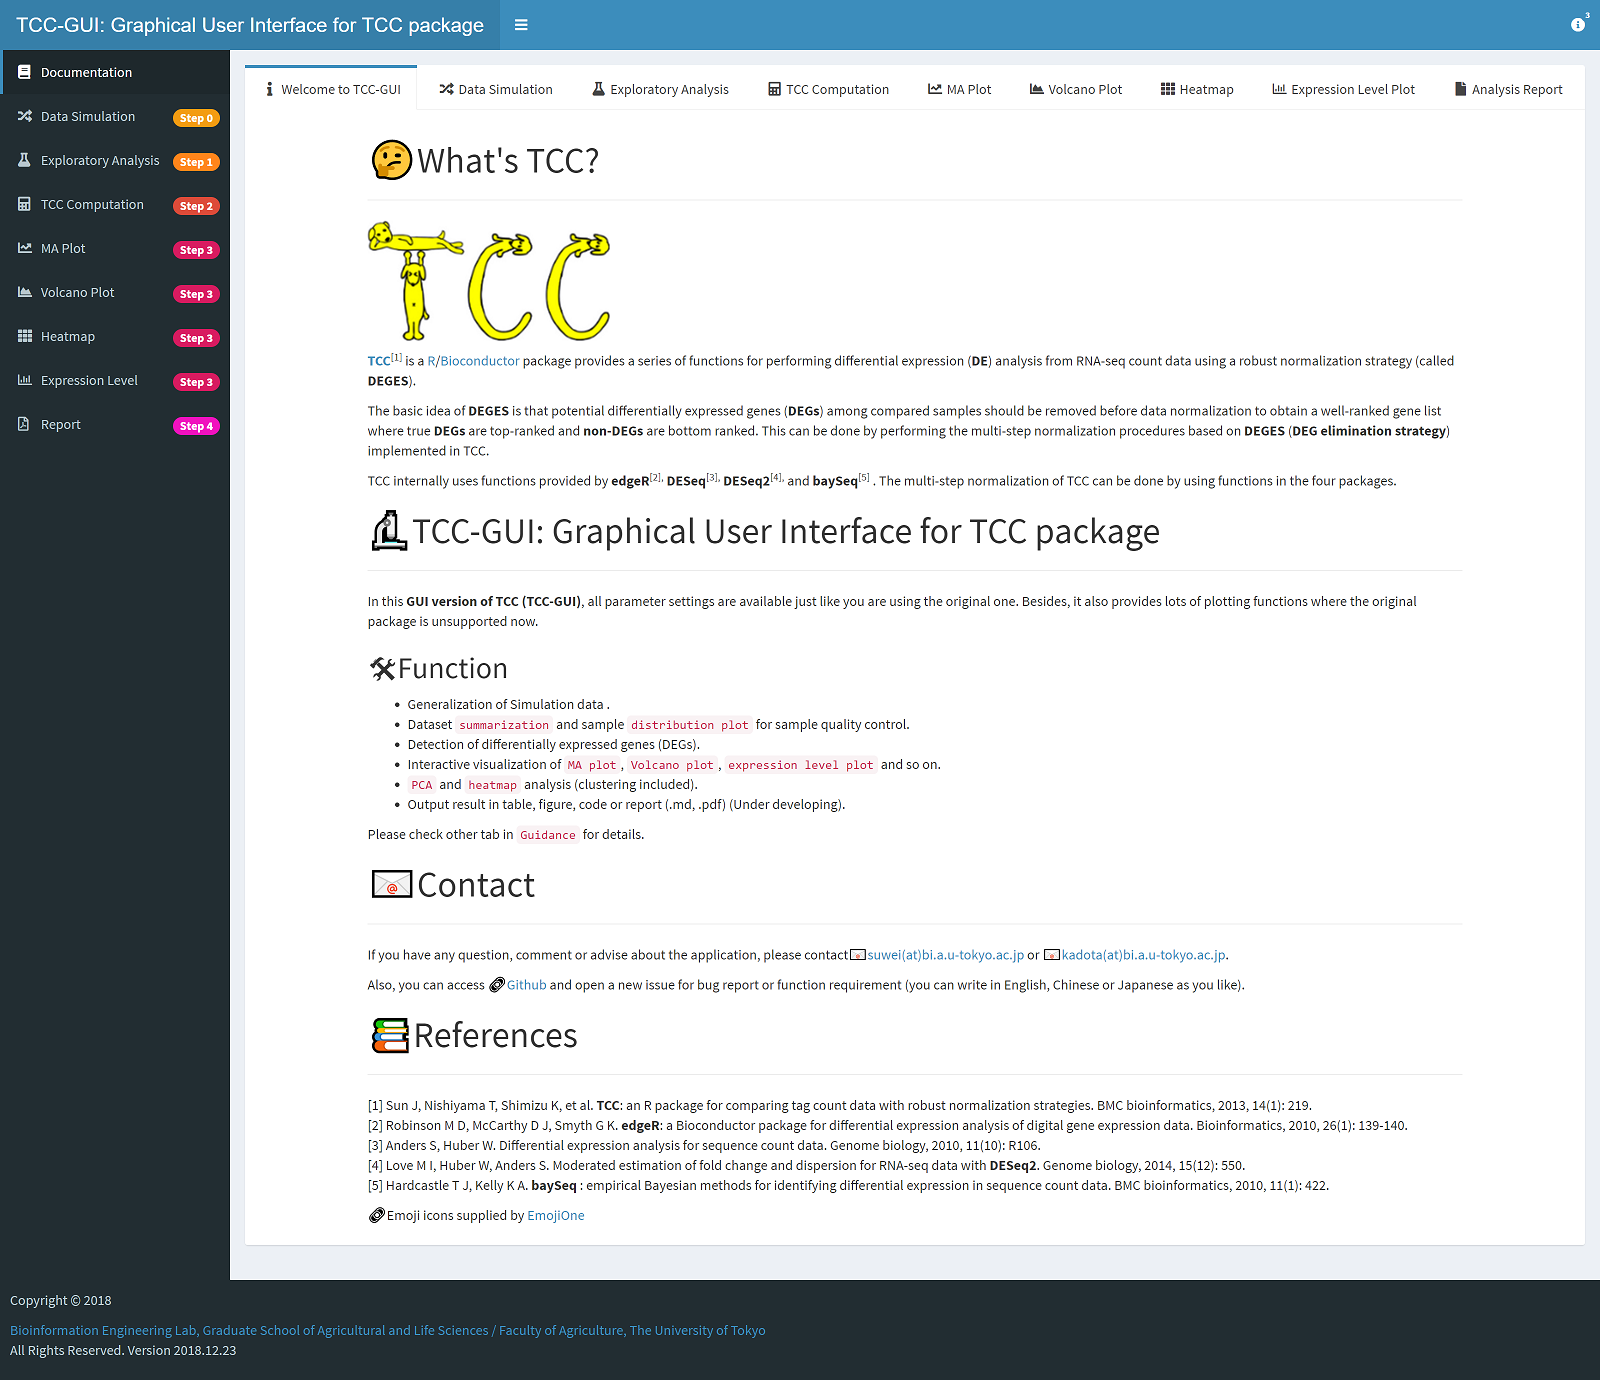
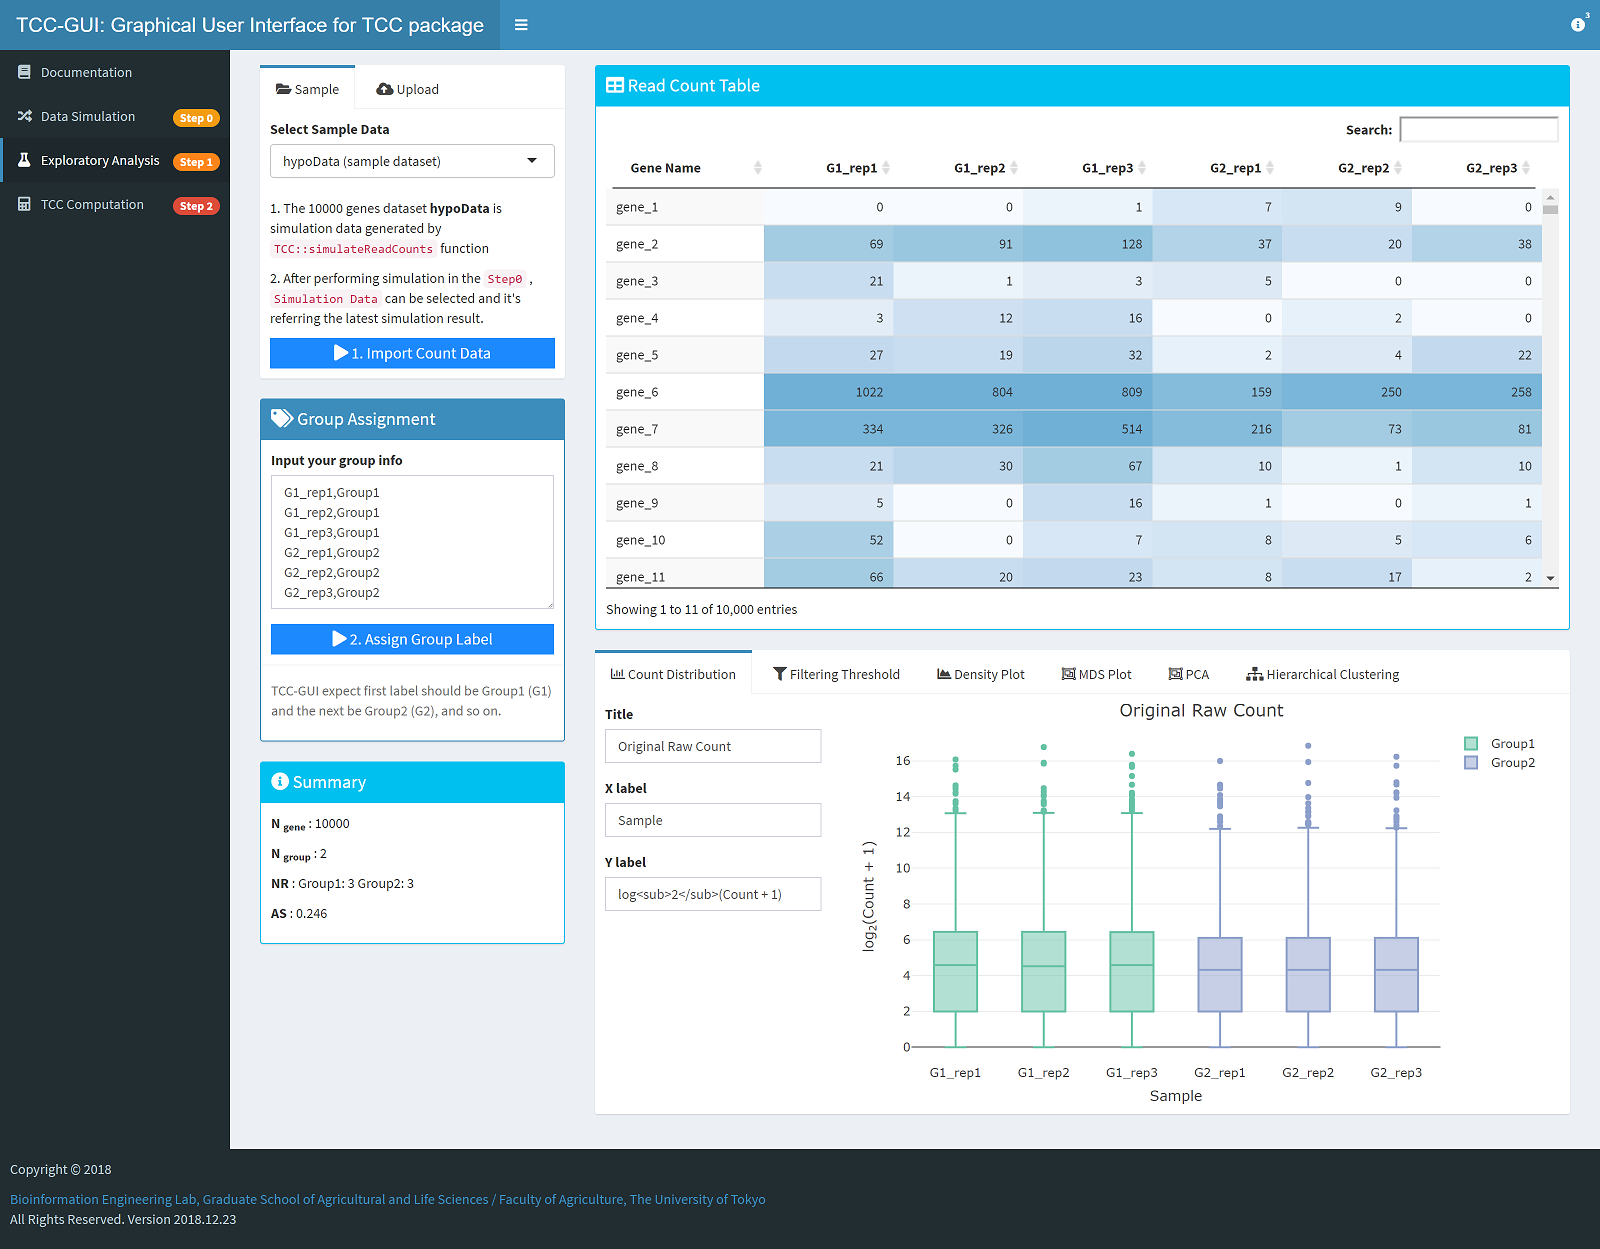
In this GUI version of TCC (TCC-GUI), all parameter settings are available just like you are using the original one. Besides, it also provides lots of plotting functions where the original package is unsupported now.
Tips: Development is now undergoing, some functions and features may be changed in the final version.
| Simulation Data Generation | Exploratory Analysis |
|---|---|
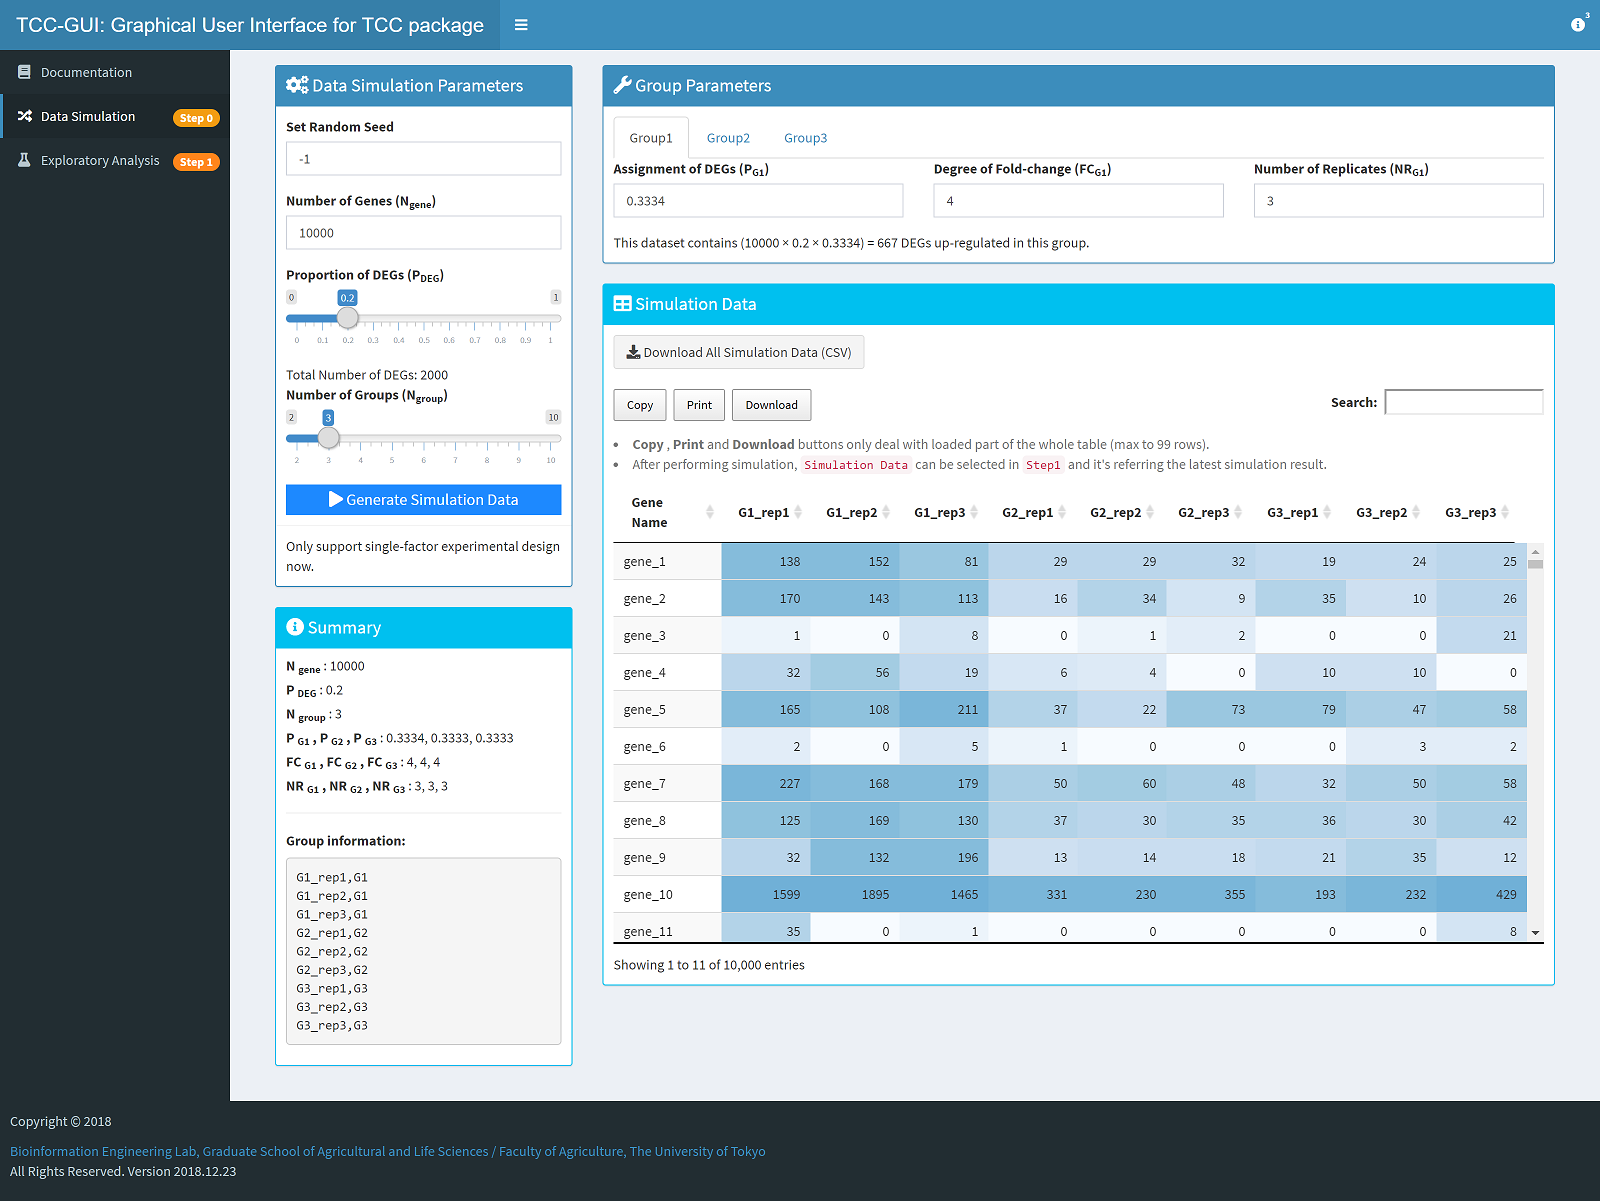 |
 |
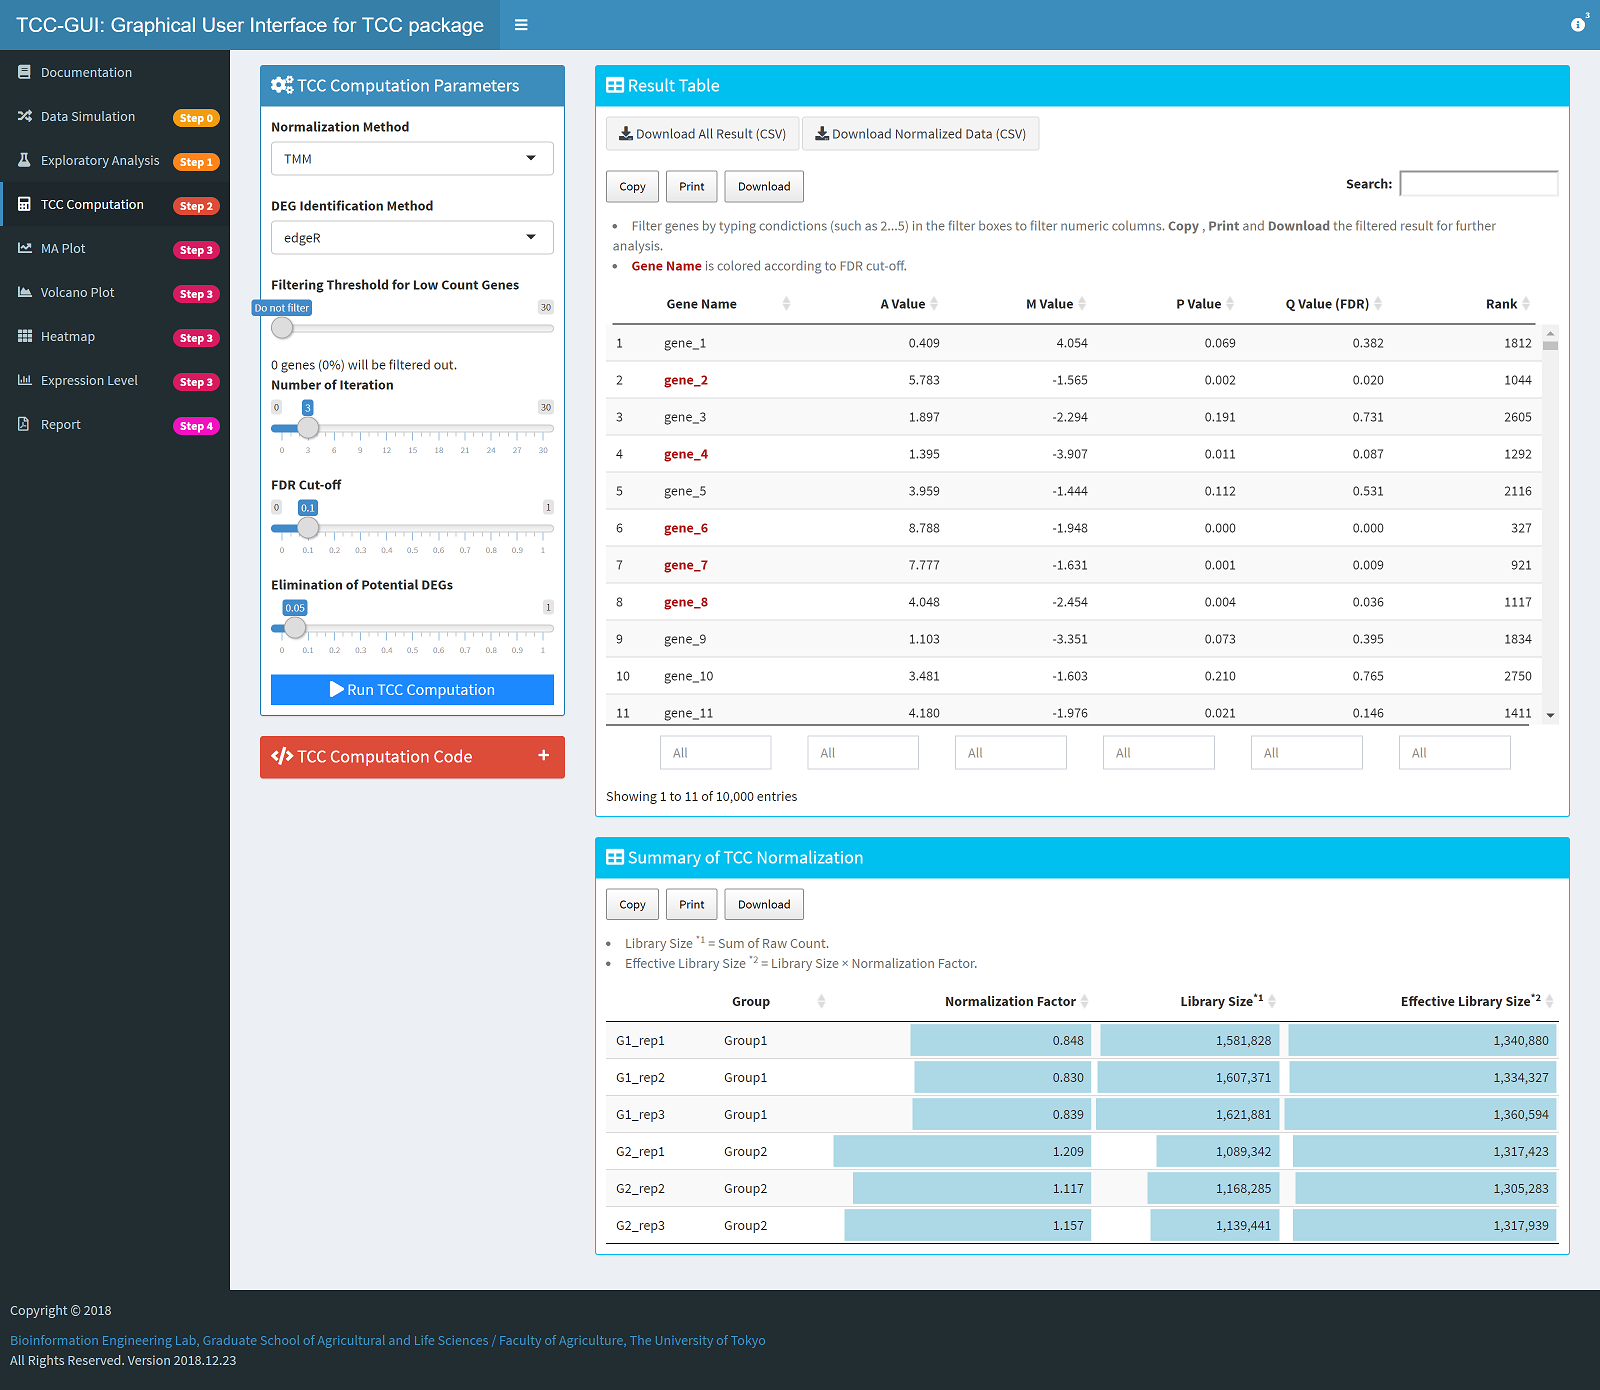
TCC Computation |
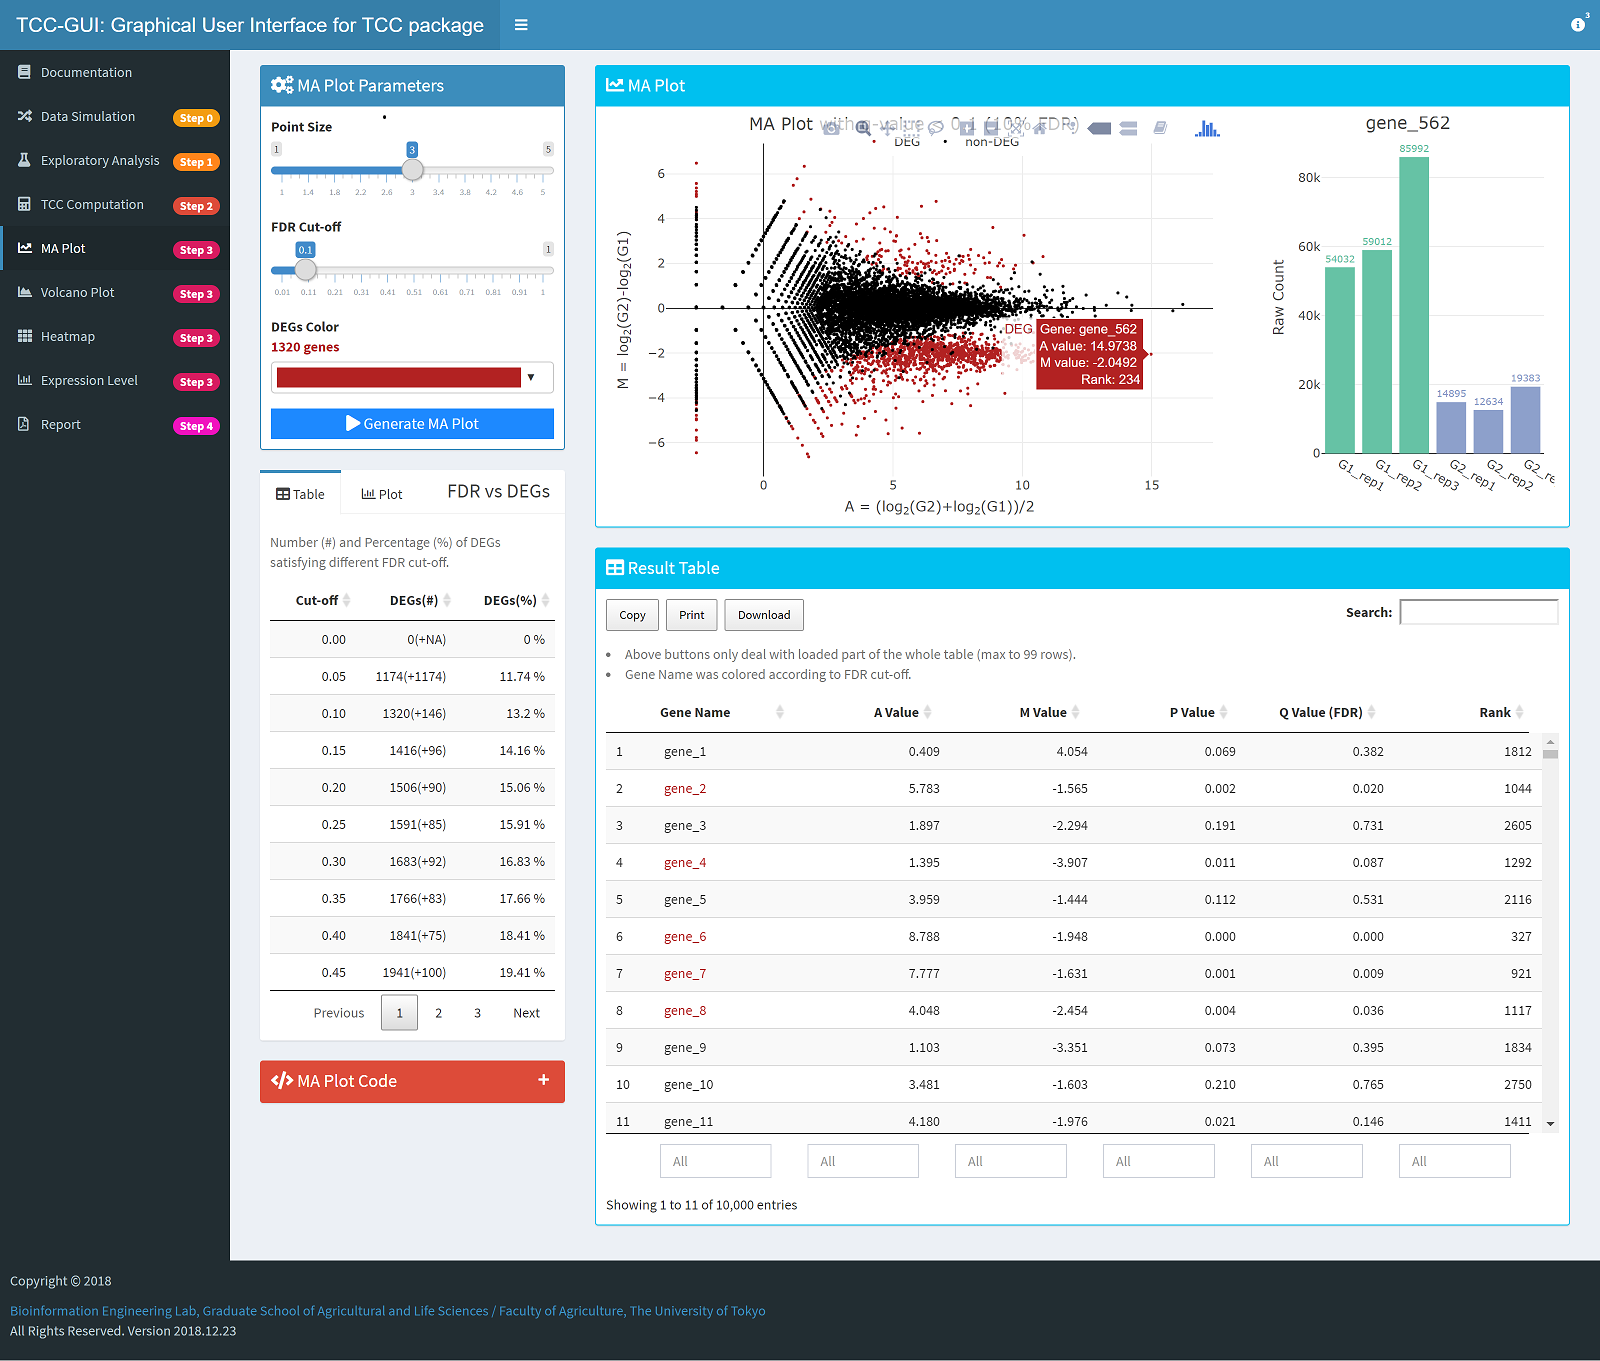
MA Plot Generation |
 |
 |
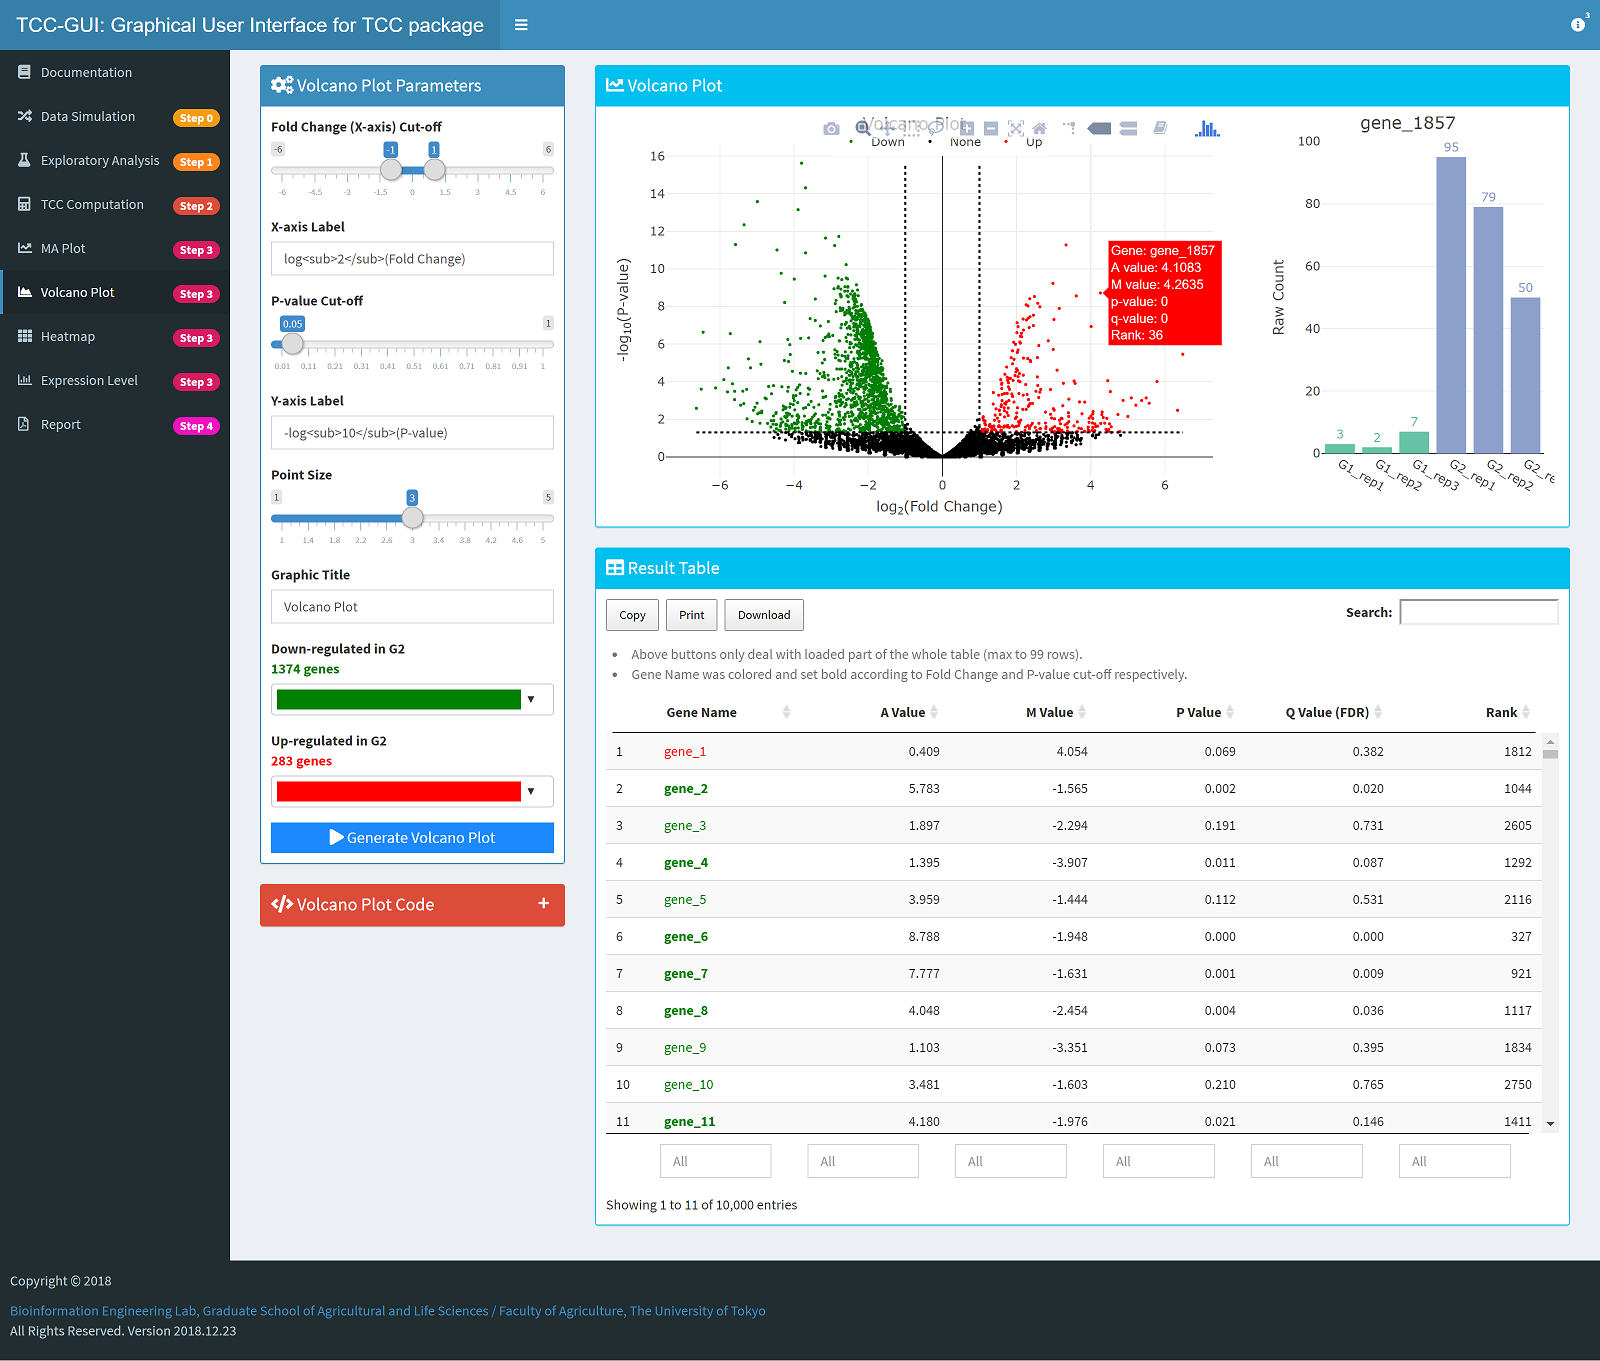
Volcano Plot Generation |
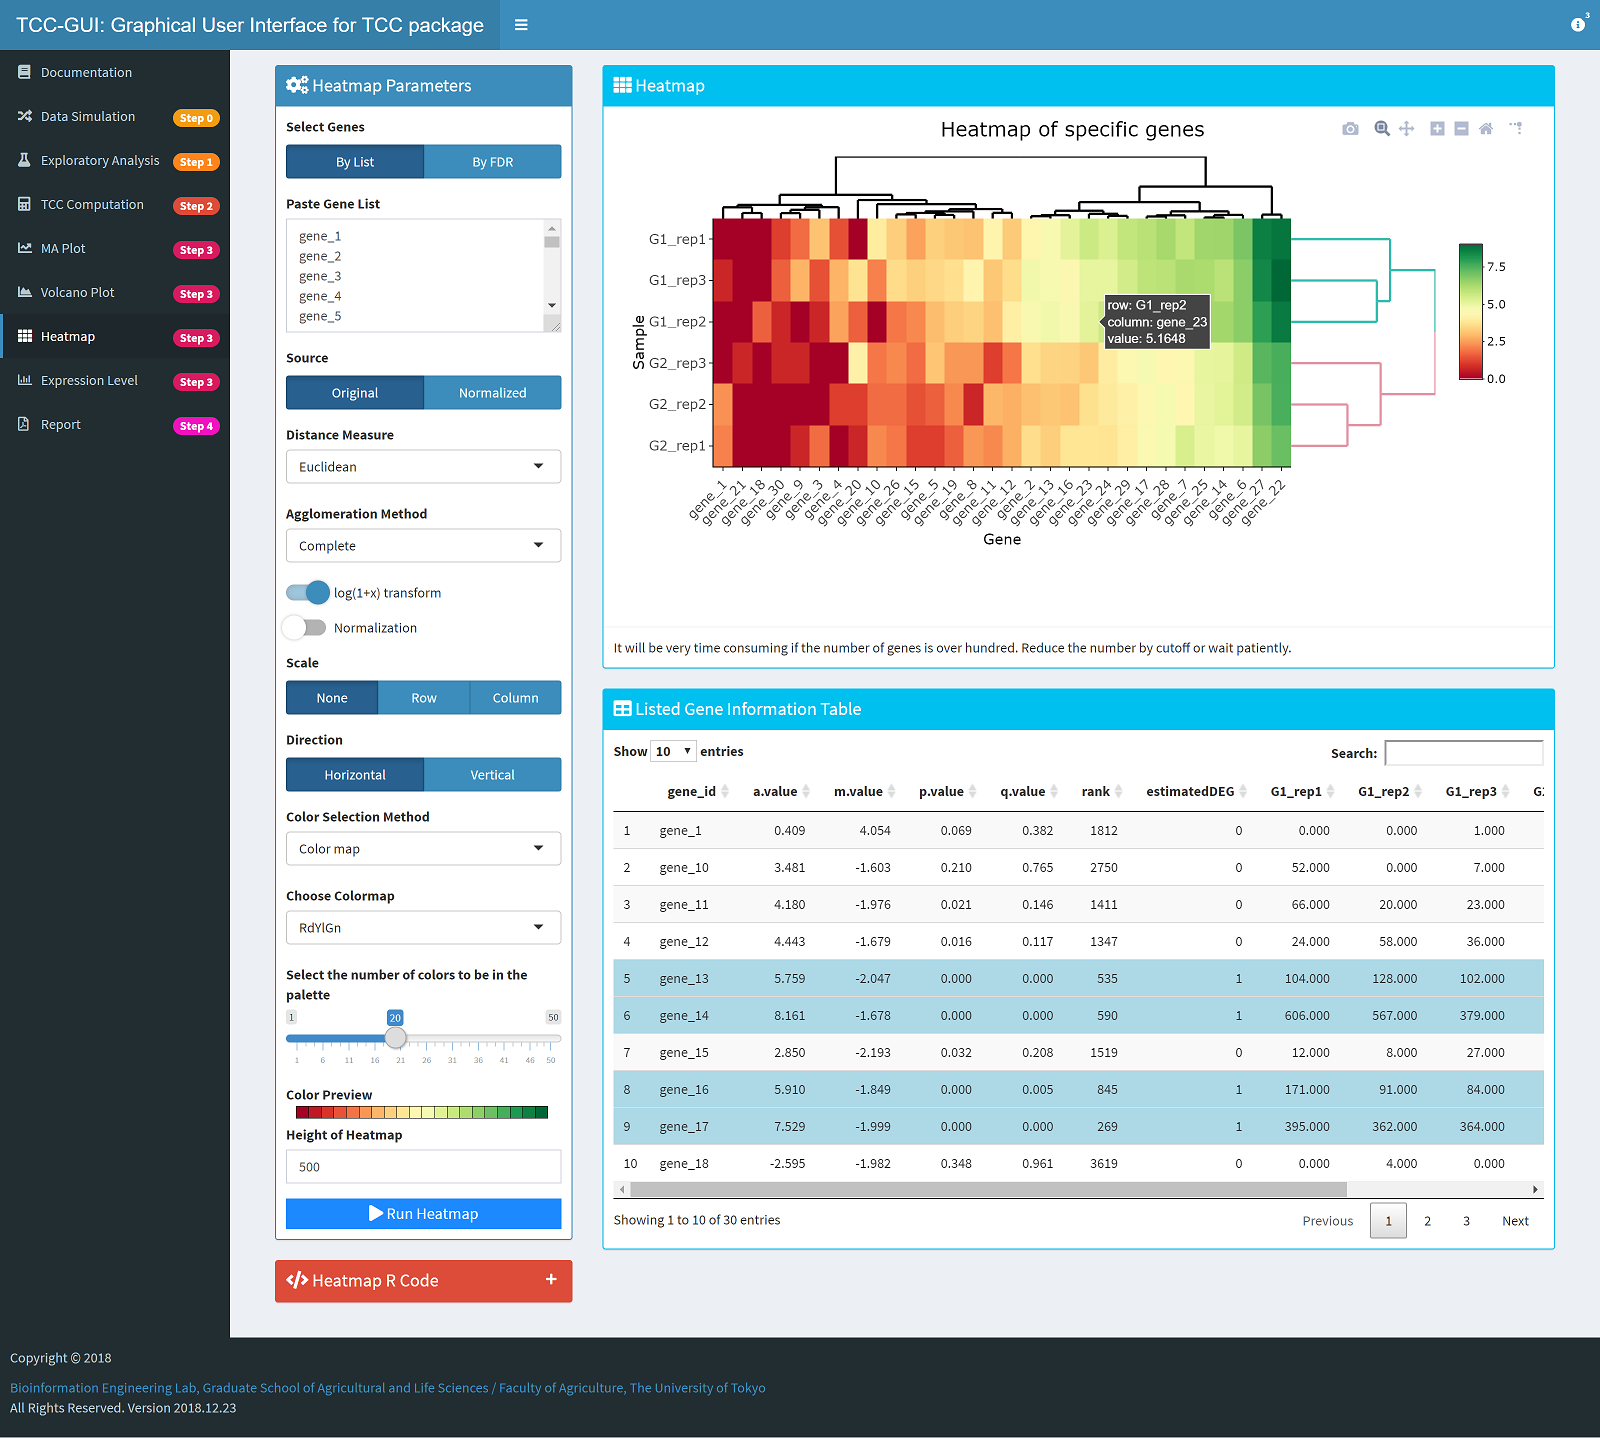
Heatmap Generation |
 |
 |
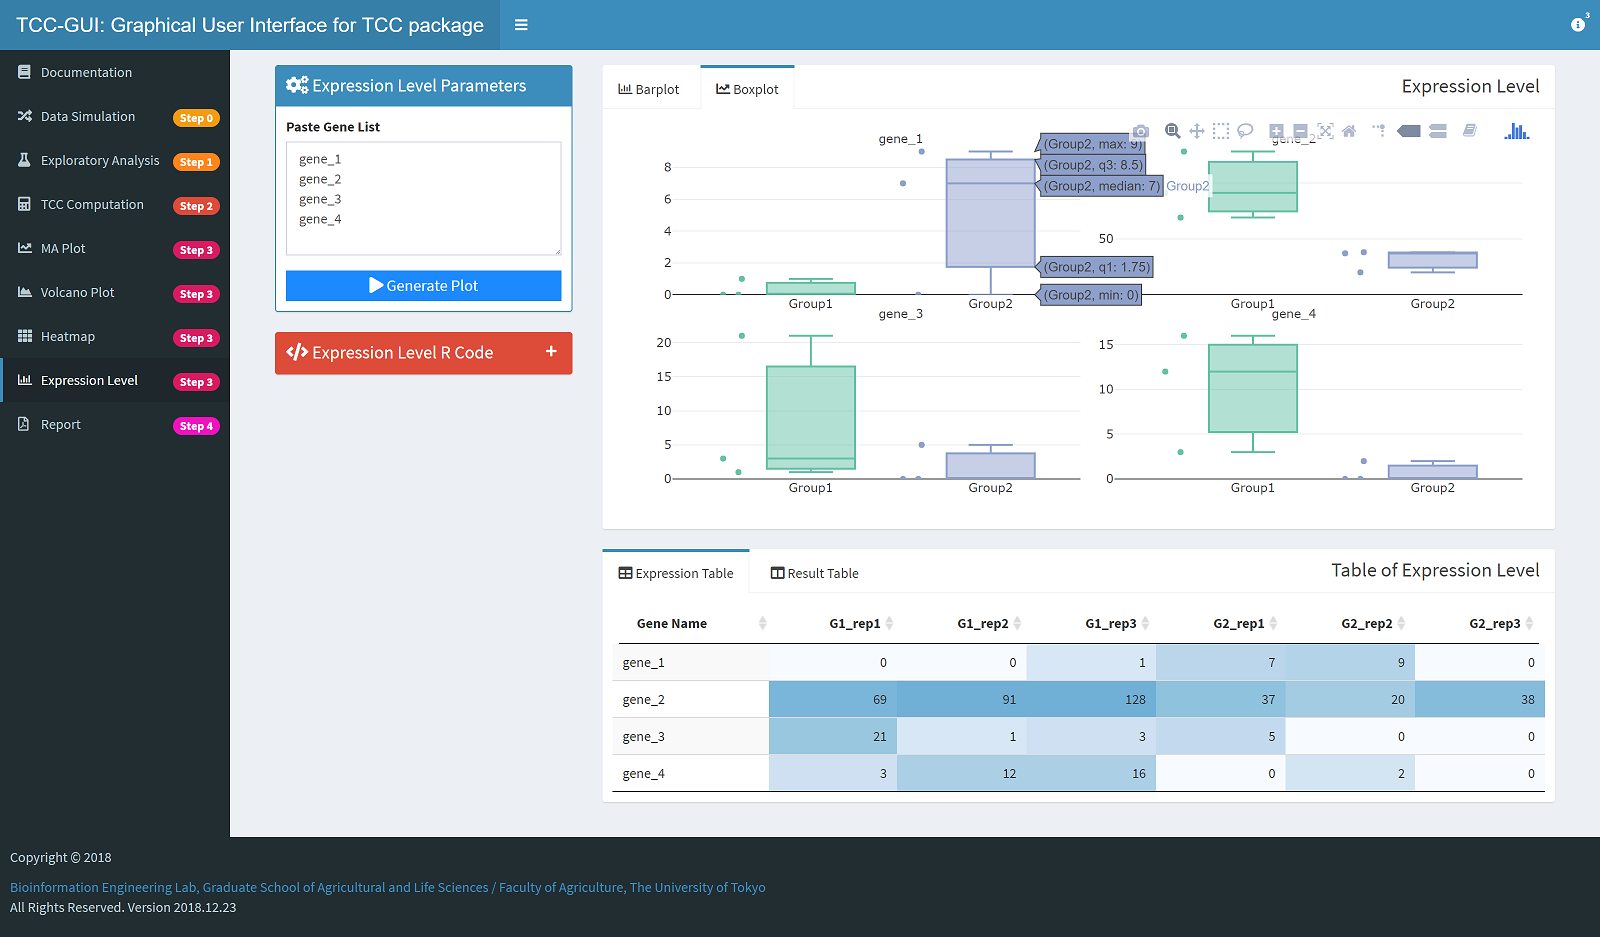
Expression Level Plot Generation |
Report Generation |
 |
 |
Access TCC-GUI hosted by shinyapps.io. Due to the limitations of the free version of shinyapps, you may not be able to use the tool in some cases, in which case you may consider downloading the source code and launch the tool in a your machine (see below).
If you are familiar with git, Method 1 is highly recommended.
-
Use the command below to clone the source code to your local directory. We assume you already know how to clone a project using Git from the command line, if not please refer to Git Basics - Getting a Git Repository.
git clone https://github.com/swsoyee/TCC-GUI.git ~/Desktop/TCC-GUI -
When you open this project (just double click
TCC-GUI.Rproj) in R at first time, the following message will be print in console, and the packagerenvwill be install automatically (if not, please installrenvmanually or create a issue for help). Next, userenv::restore()to install all other packages which are needed.# Bootstrapping renv 0.17.0 -------------------------------------------------- * Downloading renv 0.17.0 ... OK (downloaded binary) * Installing renv 0.17.0 ... Done! * Successfully installed and loaded renv 0.17.0. Installing BiocManager [1.30.20] ... OK [linked cache in 0.36 milliseconds] * Installed 1 package in 9 milliseconds. * Project '~/Desktop/TCC-GUI' loaded. [renv 0.17.0] * One or more packages recorded in the lockfile are not installed. * Use `renv::status()` for more details. > renv::restore() The following package(s) will be updated: ...
-
If you are using
RStudio, just open theui.R,server.Rorglobal.RinTCC-GUIdirectory, and click theRun Appbutton to launch the application. Or use the commend below to complete the same thing.shiny::runApp(appDir = "TCC-GUI")
For more information, please refer to the wiki.
-
Click
Codebutton on the top of this page, then clickDownload ZIP; -
Unzip the file to your working directory;
-
Double click
TCC-GUI.Rprojto open the project; -
Make sure the
renvpackage is install automatically (also see Method 1 step 2); -
Run the code to launch the application (according to your structure of working directory it may be different).
# install packages by using renv
renv::restore()

# run the command and launch the application
shiny::runApp(appDir = "TCC-GUI")
If you are using RStudio, there will be a
Run Appbutton in the souce code file panel when you open fileui.R,server.Rorglobal.R. Click the button and TCC-GUI will be launched.
If the above method still does not work, please try the old version installation method below or feel free to contact us.
Old Installation Method
Make sure that you have already installed those packages in your environment.
shiny, shinydashboard, shinyWidgets, plotly, dplyr, TCC, DT, heatmaply, markdown, rmarkdown, data.table, tidyr, RColorBrewer, utils, knitr, cluster, shinycssloaders, shinyBS, renv, MASS.
If any package is missing, Please run the following command in your RStudio and it will install all packages automatically.
# Check "BiocManager"
if (!requireNamespace("BiocManager", quietly = TRUE))
    install.packages("BiocManager")

# Package list
libs <- c("shiny", "shinydashboard", "shinyWidgets", "plotly", "dplyr", "DT", "heatmaply", "tidyr","utils","rmarkdown","data.table","RColorBrewer", "knitr", "cluster", "shinycssloaders", "shinyBS", "renv", "MASS", "TCC")

# Install packages if missing
for (i in libs){
  if( !is.element(i, .packages(all.available = TRUE)) ) {
     BiocManager::install(i, suppressUpdates=TRUE)
  }
}Run the following command to launch TCC-GUI in your local environment, then it will download TCC-GUI automatically from github and launch.
shiny::runGitHub("TCC-GUI", "swsoyee", subdir = "TCC-GUI", launch.browser = TRUE)This method always download the source code from github before launching, so maybe you can try to download all the source code by yourself and launch it.
- Click
Clone or downloadbutton on the top of this page, then clickDownload ZIP; - Unzip the file to your working directory (use
getwd()to know your working directory); - Run the code of launching (according to your structure of working directory it may be different).
shiny::runApp("TCC-GUI", launch.browser = TRUE)If you have any question about TCC-GUI, simply create a issue for help (prefer) or send E-mail to us. We will answer your question as soon as possible.
If you have use TCC-GUI in your work, please cite the original paper and consider to give this repository a ⭐Star!
TCC-GUI: a Shiny-based application for differential expression analysis of RNA-Seq count data
Wei Su, Jianqiang Sun, Kentaro Shimizu and Koji Kadota
BMC Research Notes 2019 12:133
https://doi.org/10.1186/s13104-019-4179-2 | © The Author(s) 2019
Received: 14 January 2019 | Accepted: 11 March 2019 | Published: 13 March 2019
- Sun J, Nishiyama T, Shimizu K, et al. TCC: an R package for comparing tag count data with robust normalization strategies. BMC bioinformatics, 2013, 14(1): 219.
- Robinson M D, McCarthy D J, Smyth G K. edgeR: a Bioconductor package for differential expression analysis of digital gene expression data. Bioinformatics, 2010, 26(1): 139-140.
- Love M I, Huber W, Anders S. Moderated estimation of fold change and dispersion for RNA-seq data with DESeq2. Genome biology, 2014, 15(12): 550.
- Hardcastle T J, Kelly K A. baySeq : empirical Bayesian methods for identifying differential expression in sequence count data. BMC bioinformatics, 2010, 11(1): 422.
Please note that the TCC-GUI project is released with a Contributor Code of Conduct. By contributing to this project, you agree to abide by its terms.