Giter VIP home page Giter VIP logo

zhaw-patterns-trends-semester_project's Introduction

Proposal for Semester Project

Patterns & Trends in Environmental Data / Computational Movement Analysis Geo 880

Semester: FS22
Data: Wild Boar Movement Data
Title: Spatial Analyses of wild boars data regarding on psycological patterns
Student 1: Jonas Michael Windisch
Student 2: Johannes Quente

Abstract

The following project work deals with given wild-boar data and examine the movement patterns of (at least) four individuals. The movement patterns have been analyzed regarding possible behavioural constraints that are being looked for due to additional underlaying shape-format datasets like (settlements, streets and different land use categories). Further the data is being compared on the different properties of the individuals, like the activity (day-night, pace).

Research Questions

The research question been asked is: How can the different environments (settlements, streets and different land use categories) been contextualized with the activity-patterns of the wild boar-data. How can this be conceptualized, modelled and further implemented in suitable visualizations to show behavioral patterns given to a certain environmental context and help to answer questions like “What does wild boar fear?” or “What are the behavioral constraints of wild boars?”.

Results / products

We do expect some kind of special heat maps, like behavioral patterns regarding (resting time, running (pace), feeding, hourly activity patterns) in relation to different environmental contexts (settlements, streets and different land use categories). Therefore, we can potentially derive some kind of psychological patterns of wild boar and estimate ratings like “the most ruthless wild boar”, “the fastest wild boar", “the most fearful wild boar", given that e.g. settlements are generally a stress factor for animals. Cross-scale movement analysis of speed, turning angles, sinuosity.

Data

For this project we need the following data: wild boar data given by the course administration of Patterns & Trends in Environmental Data, areal statistics data & orthoimages given by swisstopo (open access) and Topographic Vector Maps given by geovite.ethz.ch (open access). The orthoimages are given as a tif file, the other are given as vector dataset.

Analytical concepts

After importing all the data, we explore our data. Then a 10 m buffer zone is created around all human-made artificial objects (settlements, streets, etc.). Next, the trajectories of the wild boars are compared with the received artificial objects: How close do the wild boar approximate the settlements? The land use categories and the trajectories are plotted on an orthoimage to visualize where and how long the wild boars stays in certain location. With a heat map the daily schedule of the wild boar movement can be shown.

R concepts

It is expected that the R packages used in the lessons are sufficient (readr, dplyr, ggplot2, sf, terra, lubridate, etc.). We create a RStudio Project and are up-loading and committing our progress on github (https://github.com/windijon/ZHAW-Patterns-Trends-Semester-Project.git).

Risk analysis

Timemangement could be a problem due to other duties. Plan B: Only answering part-questions.

Questions?

--> Which packages do you recommend? --> Is this too abitious? --> How related has this project to be regarding secondary literatur?

zhaw-patterns-trends-semester_project's People

Contributors

quasto-sketc avatar windijon avatar

Watchers

 avatar

zhaw-patterns-trends-semester_project's Issues

Activate GitHub Pages

Hi there!

I see that you are working on your semester project 😄

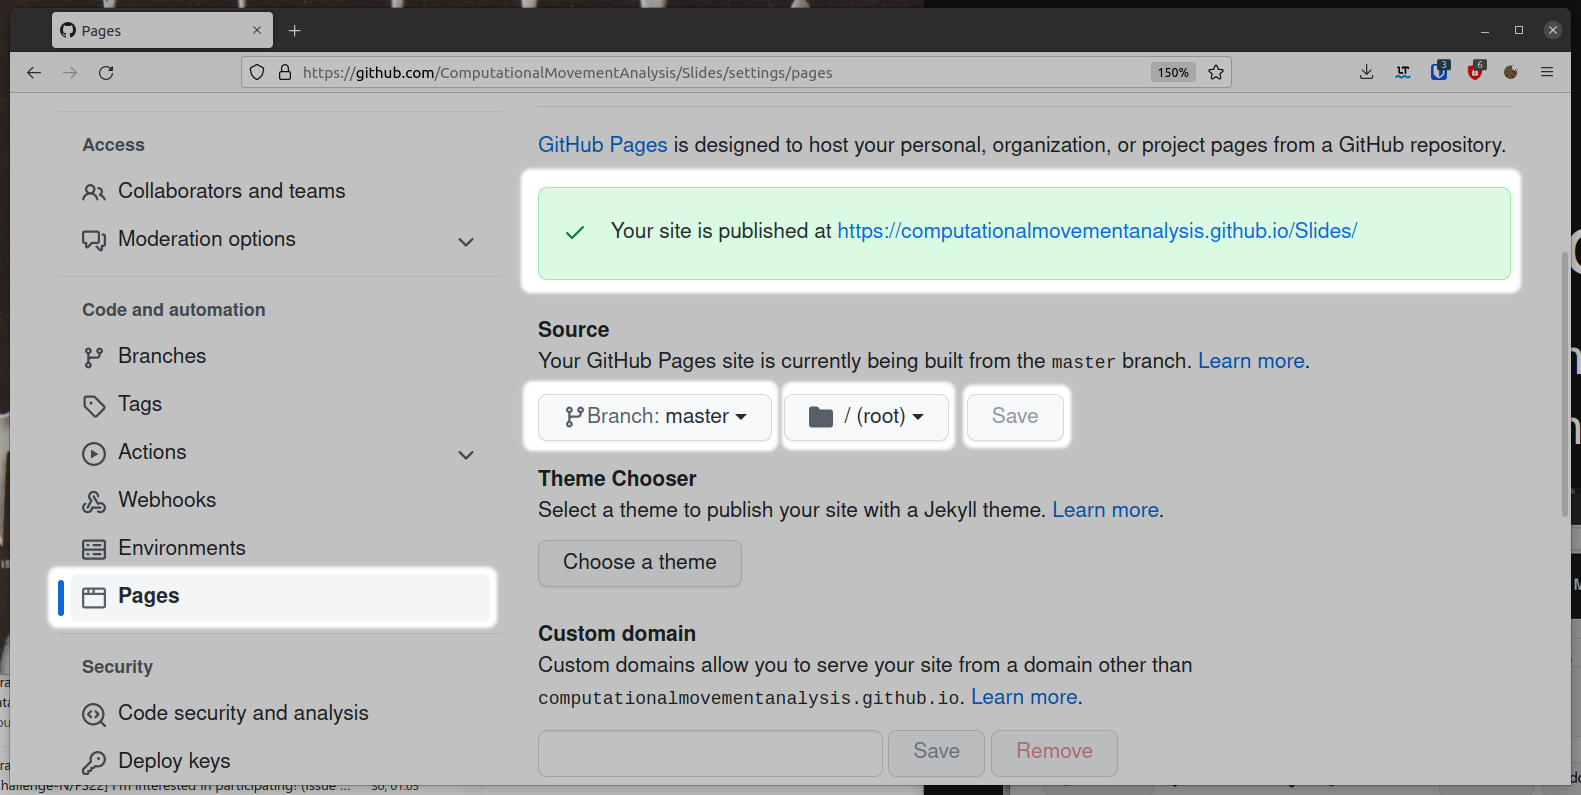
I've noticed that you haven't yet activated GitHub Pages on your repo. Can you do this? All you need to do is go to the settings of your repo, go the tab "Pages" and activate GitHub Pages by choosing your branch (main or master) and then the folder root (see screenshot below). The green box will appear if you click on save.

If you have any questions, please book a session with me via https://calendly.com/rata-zhaw/

gh-pages

tabes in your report

This can also be expressed in numbers:
```{r message = FALSE, warning = FALSE, results='hide', fig.show = TRUE}
ws_newyear_speed %>%
group_by(TierName) %>%
subset(select=-c(E,N)) %>%
summarise(mean = mean(speed, na.rm =TRUE))
ws_newyear_steplength %>%
group_by(TierName) %>%
subset(select=-c(E,N)) %>%
summarise(mean = mean(steplength, na.rm =TRUE))
# !
ws_newyear_net_displacement %>%
group_by(TierName) %>%
summarise(mean = mean(net_displacement, na.rm =TRUE))
```

I don't think it's reasonable to show the same data twice (once as a boxplot, once as a table). But if you do want to create a table, pipe your tibble into a knitr::kabel(), e.g.:

 ws_newyear_speed %>% 
   group_by(TierName) %>% 
   subset(select=-c(E,N)) %>% 
-   summarise(mean = mean(speed, na.rm =TRUE))
+   summarise(mean = mean(speed, na.rm =TRUE)) %>%
+   knitr::kabel()

Commit your html files!

Please keep in mind that we need to read a written report in order to evaluate your project (as an example, have a look at this report from last year, which we also had linked to on moodle). This means that you will need to commit and push the output from your .Rmd file, which it seems you haven't done till now.

Do not wait till the submission date for this step! After activating GitHub pages (see #1) and pushing your html outputs, have a look at your report which will be hosted on:

https://windijon.github.io/ZHAW-Patterns-Trends-Semester_Project/Test-Area.html or
https://windijon.github.io/ZHAW-Patterns-Trends-Semester_Project/Johannes_Test_Area.html

Have a look at this URL and check if you are satisfied with your result. By the way, you can make your output cleaner by adding the following lines to the top of your Rmarkdown file:

knitr::opts_chunk$set(echo = FALSE)       # hides code
knitr::opts_chunk$set(warning = FALSE)    # hides warnings
knitr::opts_chunk$set(message = FALSE)    # hides messages

As a reminder, here is the slide with the requirements concerning your report:

image

Correct file?

You have multiple Rmd Files in your repo, which one will hold the project report?

Recommend Projects

  • React photo React

    A declarative, efficient, and flexible JavaScript library for building user interfaces.

  • Vue.js photo Vue.js

    🖖 Vue.js is a progressive, incrementally-adoptable JavaScript framework for building UI on the web.

  • Typescript photo Typescript

    TypeScript is a superset of JavaScript that compiles to clean JavaScript output.

  • TensorFlow photo TensorFlow

    An Open Source Machine Learning Framework for Everyone

  • Django photo Django

    The Web framework for perfectionists with deadlines.

  • D3 photo D3

    Bring data to life with SVG, Canvas and HTML. 📊📈🎉

Recommend Topics

  • javascript

    JavaScript (JS) is a lightweight interpreted programming language with first-class functions.

  • web

    Some thing interesting about web. New door for the world.

  • server

    A server is a program made to process requests and deliver data to clients.

  • Machine learning

    Machine learning is a way of modeling and interpreting data that allows a piece of software to respond intelligently.

  • Game

    Some thing interesting about game, make everyone happy.

Recommend Org

  • Facebook photo Facebook

    We are working to build community through open source technology. NB: members must have two-factor auth.

  • Microsoft photo Microsoft

    Open source projects and samples from Microsoft.

  • Google photo Google

    Google ❤️ Open Source for everyone.

  • D3 photo D3

    Data-Driven Documents codes.