Giter VIP home page Giter VIP logo

zhaw-patterns-trends-semester_project's Issues

Commit your html files!

Please keep in mind that we need to read a written report in order to evaluate your project (as an example, have a look at this report from last year, which we also had linked to on moodle). This means that you will need to commit and push the output from your .Rmd file, which it seems you haven't done till now.

Do not wait till the submission date for this step! After activating GitHub pages (see #1) and pushing your html outputs, have a look at your report which will be hosted on:

https://windijon.github.io/ZHAW-Patterns-Trends-Semester_Project/Test-Area.html or
https://windijon.github.io/ZHAW-Patterns-Trends-Semester_Project/Johannes_Test_Area.html

Have a look at this URL and check if you are satisfied with your result. By the way, you can make your output cleaner by adding the following lines to the top of your Rmarkdown file:

knitr::opts_chunk$set(echo = FALSE)       # hides code
knitr::opts_chunk$set(warning = FALSE)    # hides warnings
knitr::opts_chunk$set(message = FALSE)    # hides messages

As a reminder, here is the slide with the requirements concerning your report:

image

Activate GitHub Pages

Hi there!

I see that you are working on your semester project ๐Ÿ˜„

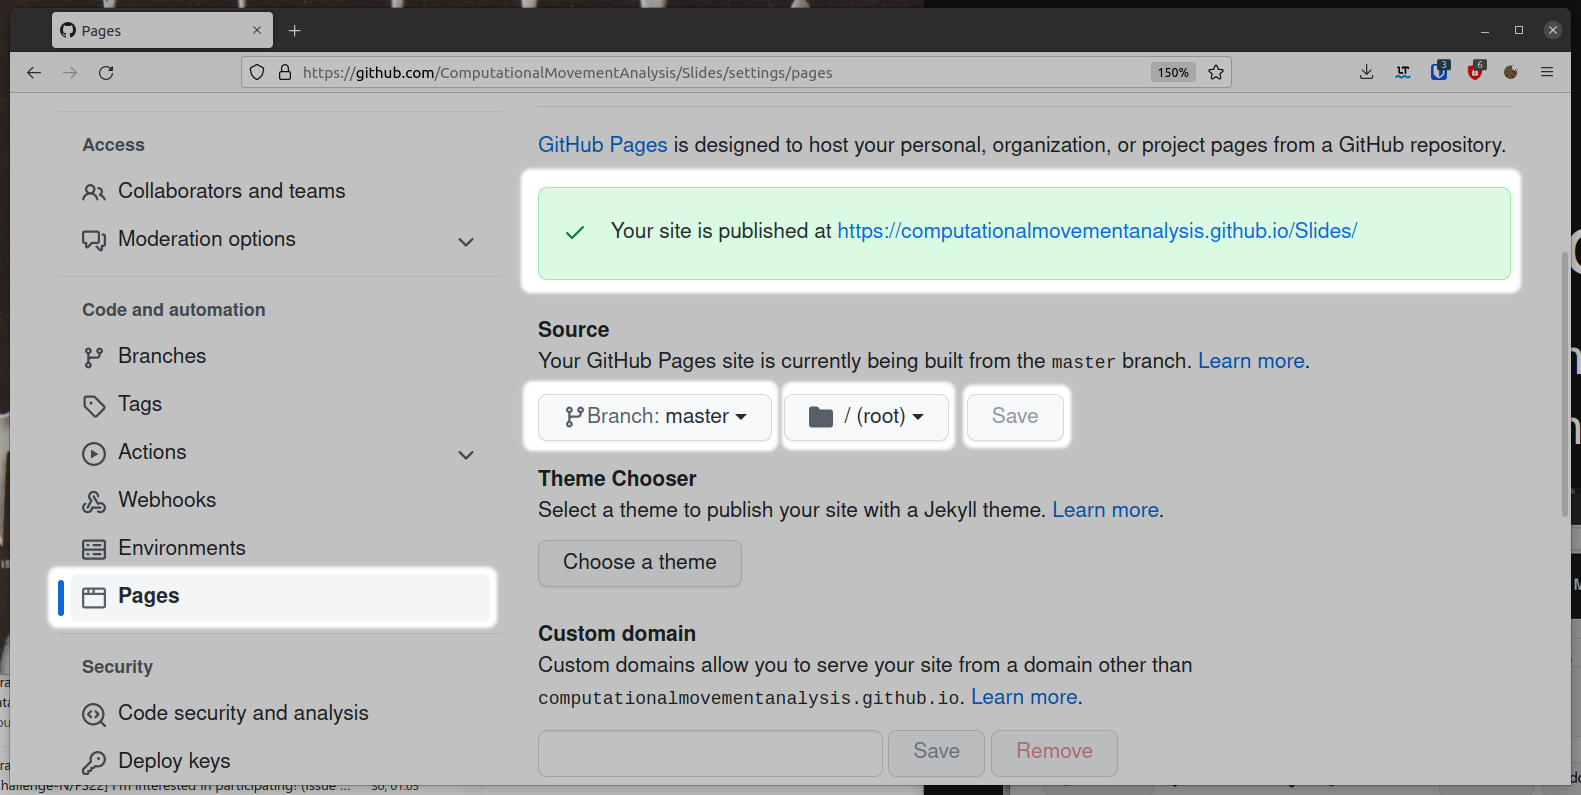
I've noticed that you haven't yet activated GitHub Pages on your repo. Can you do this? All you need to do is go to the settings of your repo, go the tab "Pages" and activate GitHub Pages by choosing your branch (main or master) and then the folder root (see screenshot below). The green box will appear if you click on save.

If you have any questions, please book a session with me via https://calendly.com/rata-zhaw/

gh-pages

tabes in your report

This can also be expressed in numbers:
```{r message = FALSE, warning = FALSE, results='hide', fig.show = TRUE}
ws_newyear_speed %>%
group_by(TierName) %>%
subset(select=-c(E,N)) %>%
summarise(mean = mean(speed, na.rm =TRUE))
ws_newyear_steplength %>%
group_by(TierName) %>%
subset(select=-c(E,N)) %>%
summarise(mean = mean(steplength, na.rm =TRUE))
# !
ws_newyear_net_displacement %>%
group_by(TierName) %>%
summarise(mean = mean(net_displacement, na.rm =TRUE))
```

I don't think it's reasonable to show the same data twice (once as a boxplot, once as a table). But if you do want to create a table, pipe your tibble into a knitr::kabel(), e.g.:

 ws_newyear_speed %>% 
   group_by(TierName) %>% 
   subset(select=-c(E,N)) %>% 
-   summarise(mean = mean(speed, na.rm =TRUE))
+   summarise(mean = mean(speed, na.rm =TRUE)) %>%
+   knitr::kabel()

Correct file?

You have multiple Rmd Files in your repo, which one will hold the project report?

Recommend Projects

  • React photo React

    A declarative, efficient, and flexible JavaScript library for building user interfaces.

  • Vue.js photo Vue.js

    ๐Ÿ–– Vue.js is a progressive, incrementally-adoptable JavaScript framework for building UI on the web.

  • Typescript photo Typescript

    TypeScript is a superset of JavaScript that compiles to clean JavaScript output.

  • TensorFlow photo TensorFlow

    An Open Source Machine Learning Framework for Everyone

  • Django photo Django

    The Web framework for perfectionists with deadlines.

  • D3 photo D3

    Bring data to life with SVG, Canvas and HTML. ๐Ÿ“Š๐Ÿ“ˆ๐ŸŽ‰

Recommend Topics

  • javascript

    JavaScript (JS) is a lightweight interpreted programming language with first-class functions.

  • web

    Some thing interesting about web. New door for the world.

  • server

    A server is a program made to process requests and deliver data to clients.

  • Machine learning

    Machine learning is a way of modeling and interpreting data that allows a piece of software to respond intelligently.

  • Game

    Some thing interesting about game, make everyone happy.

Recommend Org

  • Facebook photo Facebook

    We are working to build community through open source technology. NB: members must have two-factor auth.

  • Microsoft photo Microsoft

    Open source projects and samples from Microsoft.

  • Google photo Google

    Google โค๏ธ Open Source for everyone.

  • D3 photo D3

    Data-Driven Documents codes.