Giter VIP home page Giter VIP logo

yulab-smu / treedata-book Goto Github PK

View Code? Open in Web Editor NEW
99.0 9.0 50.0 352.71 MB

:books: a complete reference book for treeio, tidytree and ggtree packages

Home Page: https://www.amazon.com/Integration-Manipulation-Visualization-Phylogenetic-Computational-ebook/dp/B0B5NLZR1Z/

HTML 40.32% Makefile 0.18% R 1.13% TeX 58.35% CSS 0.04%
tidytree treeio ggtree visualization data-import data-manipulation phylogeny

treedata-book's Introduction

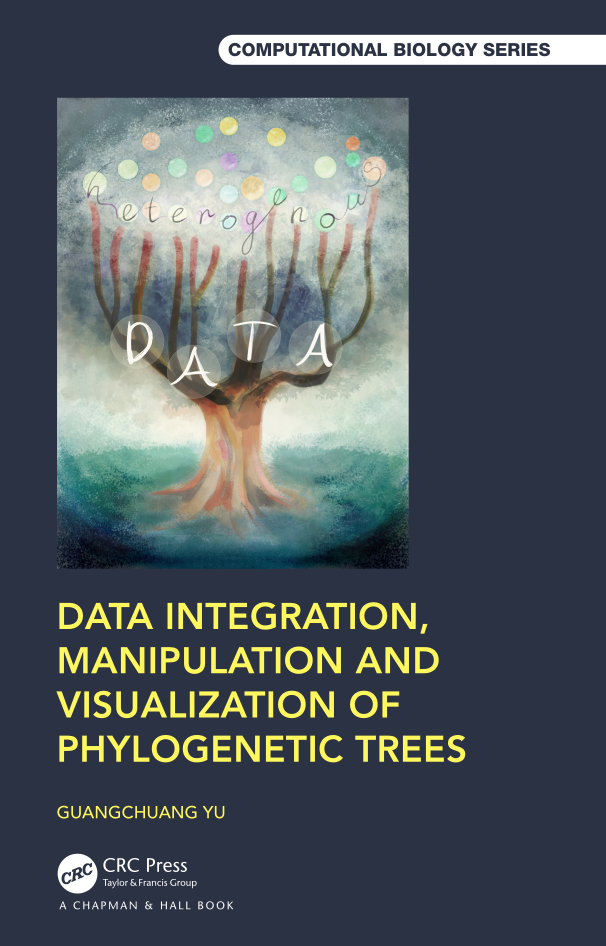
Data Integration, Manipulation and Visualization of Phylogenetic Trees

The book gives comprehensive overviews of phylogenetic tree data integration, manipulation and visualization using a suite of R packages, tidytree, treeio, ggtree and ggtreeExtra. The book has been published by Chapman & Hall/CRC. You can also find it on Amazon.

treedata-book's People

Contributors

778055611 avatar boltomli avatar emberwhirl avatar guangchuangyu avatar mjchen1996 avatar sanl20 avatar wenlitang avatar xiangpin avatar xzj-14035 avatar

Stargazers

 avatar  avatar  avatar  avatar  avatar  avatar  avatar  avatar  avatar  avatar  avatar  avatar  avatar  avatar  avatar  avatar  avatar  avatar  avatar  avatar  avatar  avatar  avatar  avatar  avatar  avatar  avatar  avatar  avatar  avatar  avatar  avatar  avatar  avatar  avatar  avatar  avatar  avatar  avatar  avatar  avatar  avatar  avatar  avatar  avatar  avatar  avatar  avatar  avatar  avatar  avatar  avatar  avatar  avatar  avatar  avatar  avatar  avatar  avatar  avatar  avatar  avatar  avatar  avatar  avatar  avatar  avatar  avatar  avatar  avatar  avatar  avatar  avatar  avatar  avatar  avatar  avatar  avatar  avatar  avatar  avatar  avatar  avatar  avatar  avatar  avatar  avatar  avatar  avatar  avatar  avatar  avatar  avatar  avatar  avatar  avatar  avatar  avatar  avatar

Watchers

 avatar  avatar  avatar  avatar  avatar  avatar  avatar  avatar  avatar

treedata-book's Issues

Example 4.3.5 error: Error in UseMethod("nodeid"): no applicable method for 'nodeid' applied to an object of class "phylo"

Hello. I have the following versions installed

  • ggtree: ‘2.3.0.991’
  • treeio: ‘1.13.0’
  • tidytree: ‘0.3.3’

but I'm still getting the following error

Error in UseMethod("nodeid"): no applicable method for 'nodeid' applied to an object of class "phylo"

when running the example in 4.3.5:

library(ggtree)
library(treeio)
library(tidytree)

anole.tree<-read.tree("http://www.phytools.org/eqg2015/data/anole.tre")
svl <- read.csv("http://www.phytools.org/eqg2015/data/svl.csv",
    row.names=1)
svl <- as.matrix(svl)[,1]
fit <- phytools::fastAnc(anole.tree,svl,vars=TRUE,CI=TRUE)

td <- data.frame(node = nodeid(anole.tree, names(svl)),
               trait = svl)
nd <- data.frame(node = names(fit$ace), trait = fit$ace)

d <- rbind(td, nd)
d$node <- as.numeric(d$node)
tree <- full_join(anole.tree, d, by = 'node')

ggtree(tree, aes(color=trait), layout = 'circular', 
        ladderize = FALSE, continuous = TRUE, size=2) +
    scale_color_gradientn(colours=c("red", 'orange', 'green', 'cyan', 'blue')) +
    geom_tiplab(hjust = -.1) + xlim(0, 1.2) + theme(legend.position = c(.05, .85)) 

How can I fix this?

ylim2() does not appear in the ggtree package in R.

Hi Professor Yu.

I am always being a fan of ggtree, and try to used it whenever I can.
I was trying to use the ylim2() function to plot my tree with other plot next to it. However, ylim2 doesn't appear in the ggtree package. I am using the ggtree version 2.0.1.

Maybe I am looking in the wrong direction. Thank you for the help and this great package!.

Melody

EDIT: I found the newest version. I was using the old one. As I though, I was looking in the wrong direction. Thank you for your constantly effort in this amazing package!

Change spelling of `geom_hilight`

Hi @GuangchuangYu,

I was following along in your treedata-book to refresh my ggtree-skills. Thank you for this very valuable resource.

During this read, I stumbled on the layer function geom_hilight (Chapter 4), which is used to highlight a clade. However, I believe that geom_hilight is misspelled and should be changed to geom_highlight. See for example this recourse.

Thank you for considering this change and the development of the packages.

Regards,
Sander

geom_balance position

Hey Yu,

Thanks for your great job on ggtree.
I wanna change the position of geom_balance but there's no positional arg. Is it possible to solve it?

Best,
Yun

Error build 12_ggtree_utilities.Rmd

The issue line [aplot::plot_list(p1, p2, tag_levels = "A", widths = c(0.6, 0.4))
](

plot_list(p1, p2, tag_levels="A", widths=c(.6, .4))
)

I already tried remotes::install_github("YuLab-SMU/aplot")

Quitting from lines 5778-5786 (treedata.Rmd)
Error: No method for merging list into element_text
Backtrace:
     █
  1. ├─bookdown::render_book("index.Rmd", "bs4_book")
  2. │ └─bookdown:::render_cur_session(...)
  3. │   └─rmarkdown::render(main, output_format, ..., clean = clean, envir = envir)
  4. │     └─knitr::knit(knit_input, knit_output, envir = envir, quiet = quiet)
  5. │       └─knitr:::process_file(text, output)
  6. │         ├─base::withCallingHandlers(...)
  7. │         ├─knitr:::process_group(group)
  8. │         └─knitr:::process_group.block(group)
  9. │           └─knitr:::call_block(x)
 10. │             └─knitr:::block_exec(params)
 11. │               └─knitr:::eng_r(options)
 12. │                 ├─knitr:::in_dir(...)
 13. │                 └─knitr:::evaluate(...)
 14. │                   └─evaluate::evaluate(...)
 15. │                     └─evaluate:::evaluate_call(...)
 16. │                       ├─evaluate:::timing_fn(...)
 17. │                       ├─base:::handle(...)
 18. │                       ├─base::withCallingHandlers(...)
 19. │                       ├─base::withVisible(eval(expr, envir, enclos))
 20. │                       └─base::eval(expr, envir, enclos)
 21. │                         └─base::eval(expr, envir, enclos)
 22. └─aplot::plot_list(p1, p2, tag_levels = "A", widths = c(0.6, 0.4))
 23.   └─patchwork:::`&.gg`(...)
 24.     └─base::lapply(...)
 25.       └─patchwork:::FUN(X[[i]], ...)
 26.         └─ggplot2:::`+.gg`(p, e2)
 27.           └─ggplot2:::add_ggplot(e1, e2, e2name)
 28.             ├─ggplot2::ggplot_add(object, p, objectname)
 29.             └─ggplot2:::ggplot_add.theme(object, p, objectname)
 30.               └─ggplot2:::add_theme(plot$theme, object)
 31.                 ├─ggplot2::merge_element(t2[[item]], t1[[item]])
 32.                 └─ggplot2:::merge_element.default(t2[[item]], t1[[item]])
 33. ```

Transfer to ropensci-books org?

Hi @GuangchuangYu, I see that this is a book concerning an rOpenSci package and was therefore wondering whether you'd like to transfer it to the ropensci-books organization.

E.g. drake manual https://github.com/ropensci-books/drake with the rendered book in the gh-pages branch

URL https://books.ropensci.org/drake/

The advantages are getting such a pretty URL and being listed in https://books.ropensci.org/ You'd retain admin rights on your book repo.

There's absolutely no obligation!

cc @jeroen (who set up the ropensci-books org)

Example files

Hi,
I found your treedata-book and found it useful.

Although, as I am new to R and what I usually find most irritating when looking at examples of different code is that the input file is never posted. My input file, for example a csv with SNP data may look different to the one you use depending on what you've used to generate the SNP data with.

What I think would be great is to actually show what your input files that you use in your different examples look like. Even better if you would want to include the files that you've used in your examples and then a new user could try and replicate using your files first before moving onto their own files!

Great book though!

colourblind save figures

Dear Guangchuang Yu,

Your book on ggtree is amazing! It helped me a lot to make nice figures. Many thanks for making this openly available.

One thing I would recommend is to change the colour scheme in Figure 4.14. This figure is impossible to read for colourblind people. Having a colour gradient from dark green to red looks completely homogeneous to colourblind people. It would be great if you could change that so that people using your book will not copy the example and propagate the use of colour schemes that are not colourblind-save. Else, most figures I looked at are beautiful and mostly colourblind save.

Best,
Joana

error when plotting tree with data, please help

Hi,

I was trying to plot an ML tree with data based on the example here:https://yulab-smu.top/treedata-book/chapter7.html#ggtree_object , chapter: 7.1 mapping data to the tree strucutre

And to start, I was following the script that is given in the webpage but I’m getting errors, it seems not to recognize my metadata.

I am attaching the tree and the metadata and my code .

Can you help me?

Thank you,

Carla

tree.nwk

(Miami_VP01-BL-D-4Seq-1_Freq_31.4546304957905:0.0391764546,((((((((Miami_VP01-BL-D-4Seq-2_Freq_7.97474275023386:0.0180673245,(Miami_VP01-BL-D-4Seq-4_Freq_7.20299345182413:0.0288746301,Miami_VP01-BL-D-4Seq-7_Freq_3.99906454630496:0.0093703420)100:0.0186559944)98:0.0106905559,Miami_VP01-BL-D-4Seq-5_Freq_5.00467726847521:0.0204139776)92:0.0102525246,(Miami_VP01-BL-D-4Seq-3_Freq_14.9672591206735:0.0233094297,Miami_VP01-BL-D-4Seq-6_Freq_4.09260991580917:0.0116586417)94:0.0125728907)71:0.0019297308,(((Miami_VP01-R-3Seq-1_Freq_40.9963116858864:0.0080173189,(Miami_VP01-R-3Seq-4_Freq_10.6494234091227:0.0061503988,Miami_VP01-R-3Seq-5_Freq_4.99556468555955:0.0144382491)80:0.0018165748)52:0.0000010000,((Miami_VP01-R-3Seq-2_Freq_8.14230356225781:0.0079434585,Miami_VP01-R-3Seq-3_Freq_21.1261029926701:0.0059381860)42:0.0000010000,Miami_VP01-R-3Seq-6_Freq_4.38862692002428:0.0039596553)31:0.0000010000)50:0.0000010000,Miami_VP01-R-3Seq-7_Freq_2.59582613567393:0.0182658096)74:0.0022617194)88:0.0076715780,Miami_VP01-R-3Seq-8_Freq_3.4035202390401:0.0000010000)81:0.0019624401,Miami_VP01-R-3Seq-9_Freq_3.69298286568:0.0039527218)96:0.0169191950,(((((((Miami_VP01-BL-R-1Seq-1_Freq_24.7746243739566:0.0085585132,Miami_VP01-BL-R-1Seq-2_Freq_6.91151919866444:0.0042164778)28:0.0000010000,Miami_VP01-BL-R-1Seq-6_Freq_16.974958263773:0.0020997551)6:0.0000010000,(Miami_VP01-BL-R-1Seq-4_Freq_3.87312186978297:0.0000010000,Miami_VP01-BL-R-1Seq-5_Freq_5.66944908180301:0.0000010000)65:0.0000010000)5:0.0000010000,(Miami_VP01-BL-R-1Seq-7_Freq_27.7529215358932:0.0042320651,Miami_VP01-BL-R-1Seq-8_Freq_2.43739565943239:0.0020956728)27:0.0000010000)28:0.0000010000,Miami_VP01-BL-R-1Seq-3_Freq_7.18530884808013:0.0063358778)82:0.0018083868,Miami_VP01-BL-R-1Seq-9_Freq_4.41402337228715:0.0045438562)100:0.0616779797,(((((Miami_VP01-R-2Seq-1_Freq_29.8493267257346:0.0282875513,Miami_VP01-R-2Seq-9_Freq_7.49361766030936:0.0044904112)81:0.0018040480,((Miami_VP01-R-2Seq-2_Freq_9.83130600190219:0.0019812472,Miami_VP01-R-2Seq-6_Freq_8.52980928067277:0.0084323992)90:0.0063325096,Miami_VP01-R-2Seq-4_Freq_5.57140711818591:0.0061799056)44:0.0000010000)61:0.0000010000,(Miami_VP01-R-2Seq-3_Freq_8.99033888972318:0.0125674004,Miami_VP01-R-2Seq-5_Freq_21.3445462281624:0.0147813306)67:0.0019949554)89:0.0084176437,Miami_VP01-R-2Seq-7_Freq_5.03579115983381:0.0040679009)84:0.0104814500,Miami_VP01-R-2Seq-8_Freq_3.34885117885568:0.0134109984)81:0.0051375462)95:0.0142570091)93:0.0110711000,Miami_VP01-BL-D-4Seq-8_Freq_13.4471468662301:0.0042512688)57:0.0012129753,Miami_VP01-BL-D-4Seq-9_Freq_11.8334892422825:0.0093601630);

metadata.csv

name,condition,frequency
Miami_VP01-BL-D-4Seq-1_Freq:31.4546304957905,Baseline DNA,31.5
Miami_VP01-BL-D-4Seq-2_Freq:7.97474275023386,Baseline DNA,8
Miami_VP01-BL-D-4Seq-3_Freq:14.9672591206735,Baseline DNA,15
Miami_VP01-BL-D-4Seq-4_Freq:7.20299345182413,Baseline DNA,7.2
Miami_VP01-BL-D-4Seq-5_Freq:5.00467726847521,Baseline DNA,5
Miami_VP01-BL-D-4Seq-6_Freq:4.09260991580917,Baseline DNA,4.1
Miami_VP01-BL-D-4Seq-7_Freq:3.99906454630496,Baseline DNA,4
Miami_VP01-BL-D-4Seq-8_Freq:13.4471468662301,Baseline DNA,13.4
Miami_VP01-BL-D-4Seq-9_Freq:11.8334892422825,Baseline DNA,11.8
Miami_VP01-BL-R-1Seq-1_Freq:24.7746243739566,Baseline RNA,24.8
Miami_VP01-BL-R-1Seq-2_Freq:6.91151919866444,Baseline RNA,6.9
Miami_VP01-BL-R-1Seq-3_Freq:7.18530884808013,Baseline RNA,7.2
Miami_VP01-BL-R-1Seq-4_Freq:3.87312186978297,Baseline RNA,3.9
Miami_VP01-BL-R-1Seq-5_Freq:5.66944908180301,Baseline RNA,5.7
Miami_VP01-BL-R-1Seq-6_Freq:16.974958263773,Baseline RNA,17
Miami_VP01-BL-R-1Seq-7_Freq:27.7529215358932,Baseline RNA,27.8
Miami_VP01-BL-R-1Seq-8_Freq:2.43739565943239,Baseline RNA,2.4
Miami_VP01-BL-R-1Seq-9_Freq:4.41402337228715,Baseline RNA,4.4
Miami_VP01-R-2Seq-1_Freq:29.8493267257346,After culture no co-culture RNA,29.8
Miami_VP01-R-2Seq-2_Freq:9.83130600190219,After culture no co-culture RNA,9.8
Miami_VP01-R-2Seq-3_Freq:8.99033888972318,After culture no co-culture RNA,9
Miami_VP01-R-2Seq-4_Freq:5.57140711818591,After culture no co-culture RNA,5.6
Miami_VP01-R-2Seq-5_Freq:21.3445462281624,After culture no co-culture RNA,21.3
Miami_VP01-R-2Seq-6_Freq:8.52980928067277,After culture no co-culture RNA,8.5
Miami_VP01-R-2Seq-7_Freq:5.03579115983381,After culture no co-culture RNA,5
Miami_VP01-R-2Seq-8_Freq:3.34885117885568,After culture no co-culture RNA,3.3
Miami_VP01-R-2Seq-9_Freq:7.49361766030936,After culture no co-culture RNA,7.5
Miami_VP01-R-3Seq-1_Freq:40.9963116858864,After culture co-culture RNA,41
Miami_VP01-R-3Seq-2_Freq:8.14230356225781,After culture co-culture RNA,8.1
Miami_VP01-R-3Seq-3_Freq:21.1261029926701,After culture co-culture RNA,21.1
Miami_VP01-R-3Seq-4_Freq:10.6494234091227,After culture co-culture RNA,10.6
Miami_VP01-R-3Seq-5_Freq:4.99556468555955,After culture co-culture RNA,5
Miami_VP01-R-3Seq-6_Freq:4.38862692002428,After culture co-culture RNA,4.4
Miami_VP01-R-3Seq-7_Freq:2.59582613567393,After culture co-culture RNA,2.6
Miami_VP01-R-3Seq-8_Freq:3.4035202390401,After culture co-culture RNA,3.4
Miami_VP01-R-3Seq-9_Freq:3.69298286568,After culture co-culture RNA,3.7

CODE

library(ggtree)
x <- read.tree("tree.nwk")
info <- read.csv("metadata.csv")
p <- ggtree(x) %<+% info + xlim(-.1, 4)
plot(p)
p2 <- p +
geom_tippoint(aes(shape = condition, color = condition, size = frequency) +
theme(legend.position = "right")) #+ scale_size_continuous(range = c(3, 10)))

plot(p2)
Ladderize=FALSE doesn't work

Reading through Chapter 4, I can't seem to get geom_tree(ladderize = F) working, reprex:

library("treeio")
#> treeio v1.10.0  For help: https://yulab-smu.github.io/treedata-book/

library("ggtree")
#> ggtree v2.0.1  For help: https://yulab-smu.github.io/treedata-book/

nwk <- system.file("extdata", "sample.nwk", package="treeio")
tree <- read.tree(nwk)

ggplot(tree, aes(x, y)) + geom_tree(ladderize = F) + theme_tree()
#> Warning: Ignoring unknown parameters: ladderize

Error in 5.2.2 Highlight clades with geom_hilight() - still does not work

Hi Guangchuang,

I have updated everything to the latest versions, and sorry the code is still not working:

ggtree version 2.2.4

R.version
_
platform x86_64-apple-darwin17.0
arch x86_64
os darwin17.0
system x86_64, darwin17.0
status
major 4
minor 0.2
year 2020
month 06
day 22
svn rev 78730
language R
version.string R version 4.0.2 (2020-06-22)
nickname Taking Off Again

## using external data
d <- data.frame(node=c(17, 21), type=c("A", "B"))
ggtree(tree) + geom_hilight(data=d, aes(node=node, fill=type))

Error in (function (node, mapping = NULL, fill = "steelblue", alpha = 0.5,  : 
  unused argument (data = list(c(17, 21), c("A", "B")))
## using data stored in tree object
x <- read.nhx(system.file("extdata/NHX/ADH.nhx", package="treeio"))
ggtree(x) + geom_hilight(mapping=aes(subset = node %in% c(10, 12), fill = S)) +
  scale_fill_manual(values=c("steelblue", "darkgreen"))

Error in structure(list(node = node, fill = fill, alpha = alpha, extend = extend,  : 
  argument "node" is missing, with no default

Could you please shed any light on why my code is not working?

Many thanks!

Failed download from PhyloPic.org

Dear Dr.Yu
I am using your wonderful tree-book to create a figure for a paper. I look forward to your response to this question.

#Question:
I received a Warning message when I tried to retrieve PhyloPics from the database.

Error in download_url(path) :
Failed to download http://phylopic.org/assets/images/submissions/7e9286b9-0e49-46c2-88f6-218291fb06a4.512.png (HTTP 404)

I used the code below:

newick <- "(Homo_sapiens:0.029752,(((Xenopus_tropicalis:0.096645,Caenorhabditis_elegans:0.647764):0.030884,Danio_rerio:0.100106):0.064097,Gallus_gallus:0.029353):0.024960,Mus_musculus:0.018171);"

tree <- read.tree(text=newick)

d <- ggimage::phylopic_uid(tree$tip.label)

ggtree(tree) %<+% d + geom_tiplab(aes(image=uid), geom="phylopic", offset=2.5) + geom_tiplab(aes(label=label), offset = .2) + xlim(NA, 7) + scale_color_viridis_d()

Error in 5.2.2 Highlight clades with geom_hilight()

The "Using external data" section has code to highlight clades and make a legend (figures 5.4 E and F).

However this code does not work:

## using external data
d <- data.frame(node=c(17, 21), type=c("A", "B"))
ggtree(tree) + geom_hilight(data=d, aes(node=node, fill=type))

I get an error saying:

Error in (function (node, mapping = NULL, fill = "steelblue", alpha = 0.5,  : 
  unused argument (data = list(c(17, 21), 1:2))

geom_hilight() does not take the argument 'data'.

When I also run this code:

x <- read.nhx(system.file("extdata/NHX/ADH.nhx", package="treeio"))
ggtree(x) + geom_hilight(mapping=aes(subset = node %in% c(10, 12), fill = S)) +
  scale_fill_manual(values=c("steelblue", "darkgreen"))

I get a similar error:

Error in structure(list(node = node, fill = fill, alpha = alpha, extend = extend,  : 
  argument "node" is missing, with no default

Recommend Projects

  • React photo React

    A declarative, efficient, and flexible JavaScript library for building user interfaces.

  • Vue.js photo Vue.js

    🖖 Vue.js is a progressive, incrementally-adoptable JavaScript framework for building UI on the web.

  • Typescript photo Typescript

    TypeScript is a superset of JavaScript that compiles to clean JavaScript output.

  • TensorFlow photo TensorFlow

    An Open Source Machine Learning Framework for Everyone

  • Django photo Django

    The Web framework for perfectionists with deadlines.

  • D3 photo D3

    Bring data to life with SVG, Canvas and HTML. 📊📈🎉

Recommend Topics

  • javascript

    JavaScript (JS) is a lightweight interpreted programming language with first-class functions.

  • web

    Some thing interesting about web. New door for the world.

  • server

    A server is a program made to process requests and deliver data to clients.

  • Machine learning

    Machine learning is a way of modeling and interpreting data that allows a piece of software to respond intelligently.

  • Game

    Some thing interesting about game, make everyone happy.

Recommend Org

  • Facebook photo Facebook

    We are working to build community through open source technology. NB: members must have two-factor auth.

  • Microsoft photo Microsoft

    Open source projects and samples from Microsoft.

  • Google photo Google

    Google ❤️ Open Source for everyone.

  • D3 photo D3

    Data-Driven Documents codes.