epezent / implot Goto Github PK
View Code? Open in Web Editor NEWImmediate Mode Plotting
License: MIT License
Immediate Mode Plotting
License: MIT License


I was thinking of adding a function which performs the exact same operation as a double click on a graph to fit the data but as a function call, thoughts? Should be a simple addition (If not already in and I've somehow missed it)
Could also include a new enum to specific which axes you want to fit specifically
enum ImPlotAxis_{
X_AXIS,
Y1_AXIS,
Y2_AXIS,
Y3_AXIS,
ALL
}
Simple function declaration with default to do all
ImPlot::FitData(ImPlotAxis_ axis = ImPlotAxis_::ALL);I am getting the above error on the sprintf statements with vc(v142) compiler and c++17. Please add the following directive _CRT_SECURE_NO_WARNING to disable the warning but ideally, we should remove the sprintf with other safer options.
Hi,
After last refactor, I got the following compilation errors with gcc 9.3.0:
implot_items.cpp:247:20: error: specializing member ‘ImPlot::MaxIdx<short unsigned int>::Value’ requires ‘template<>’ syntax
  247 | const unsigned int MaxIdx<unsigned short>::Value = 65535;
      |                    ^~~~~~~~~~~~~~~~~~~~~~
implot_items.cpp:248:20: error: specializing member ‘ImPlot::MaxIdx<unsigned int>::Value’ requires ‘template<>’ syntax
  248 | const unsigned int MaxIdx<unsigned int>::Value   = 4294967295;
      |                    ^~~~~~~~~~~~~~~~~~~~
Regards,
Congratulations on the amazing library! (I noticed it was linked from Hackernews and Reddit recently, hence possibly influx of users)
As discussed earlier, I feel like using a distinct namespace e.g. ImPlot may be easier for users to find/distinguish among functions provided by this library (because it has many functions).
If anything we could imagine that large features of ImGui with many entry points could want adopt the same idea but there are none so far (Tables API being the closest and many of its function are prefixed ImGui::TableXXX for that reason).
Just spotted this library as I needed some plotting tools with imgui. I like the work. I made the following changes to allow dynamic resizing of windows and I wonder.
For implot.h-file
/// Set the axes limits of this plot
void SetPlotLimits(ImPlotLimits limits, int y_axis=-1);
For implot.cpp-file
void SetPlotLimits(ImPlotLimits limits, int y_axis_in) {
    IM_ASSERT_USER_ERROR(y_axis_in >= -1 && y_axis_in < MAX_Y_AXES, "y_axis needs to between -1 and MAX_Y_AXES");
    IM_ASSERT_USER_ERROR(gp.CurrentPlot != NULL, "GetPlotLimits() Needs to be called between BeginPlot() and EndPlot()!");
    const int y_axis = y_axis_in >= 0 ? y_axis_in : gp.CurrentPlot->CurrentYAxis;

    ImPlot& plot = *gp.CurrentPlot;
    plot.XAxis.Range = limits.X;
    plot.YAxis[y_axis].Range = limits.Y;
}
I am new to imgui so I do not know how to include the ImGuiCond statements here.
Use case: resizing by numbers from a text-box or slider. This requires seeing the plot before knowing what to do with the ImPlotRange. Example code added after an EndPlot() call to demonstrate usefulness:
ImPlotLimits range = ImGui::GetPlotLimits();
bool change=false;
change |= ImGui::InputFloat("X min", &range.X.Min, 0, 0, "%g");
change |= ImGui::InputFloat("X max", &range.X.Max, 0, 0, "%g");
change |= ImGui::InputFloat("Y min", &range.Y.Min, 0, 0, "%g");
change |= ImGui::InputFloat("Y max", &range.Y.Max, 0, 0, "%g");
if (change) ImGui::SetPlotLimits(range);
edit: update code to version from yesterday (warning, no testing of last function!)
My favorite type of chart, although I have no idea how one could implement this and it might be out of scope.
Here's some pretty good examples of sankey diagrams: https://www.iea.org/sankey/#?c=World&s=Balance
The above functions used in the demo is causing issues on c++11/17 compilers. A trivial fix is to use the new style headers but that violates Dear ImGui's strict compliance with pre c++11 feature set.
Any ideas other than keeping a separate fork for C++11?
ImPlot has rapidly grown to almost 5000 LOC across all of its source files. While this is by no means large, implot.cpp is becoming a bit of a pain to navigate and maintain. I anticipate that this will become more challenging as the library grows. I'm considering splitting the source files in a manner similar to ImGui:
implot.h - no change
implot_internal.h - struct declarations and inline helper functions used internally by cpp files.
implot.cpp - code related to creating Plot axes and maintaining their state (i.e. BeginPlot/EndPlot) and misc user API
implot_items.cpp - implementation and helpers related to plotting and rendering items (e.g. PlotLines, PlotBars etc)
implot_demo.cpp - no change
I'd like to get thoughts from our usual contributors and users. Specifically:
implot_internal.h to extend/modify ImPlot if it were designed that way?Hello,
For those who are using vcpkg, you can now build Implot directly from it : microsoft/vcpkg@4425bf3
I hope this will help. :)
In PlotEx()
    // find data extents
    if (gp.FitThisFrame) {
        for (int i = 0; i < count; ++i) {
            ImPlotPoint p = getter(i);
            FitPoint(p);
        }
    }
is not handling the case of constant y values where result of FitPoint() will return gp.ExtentsX.Min and gp.ExtentsX.Max equal. This will stuck scrolling and Y resizing interaction.
First of all thanks for this great library!
I have a few issues related to the static global variable gp
I use a custom allocator and static globals init/deinit order is not guaranteed, and so my app will crash at exit cos my custom allocator (that imgui and in turn implot uses) will be destroyed before the gp.
Also within ImPlotContext destructor the call to SetColormap will access gp! that is a bug...
I am hacking the library to fix my needs but I wonder if a more clean design would be a better option for everyone's use?
Cheers
Evan requested I share the alternative input map we use in our application. Frankly, the new input mapping feature is pretty self explanatory. But here it is all the same.
Some comments:
// Set ImPlot's input mapping to more closely mirror the rest of our application
{
    ImPlotInputMap& i = ImPlot::GetInputMap();

    i.PanButton = ImGuiMouseButton_Middle;
    i.PanMod = ImGuiKeyModFlags_None;

    i.BoxSelectButton = ImGuiMouseButton_Left;
    i.BoxSelectMod = ImGuiKeyModFlags_None;
    i.BoxSelectCancelButton = ImGuiMouseButton_Right;

    i.QueryButton = ImGuiMouseButton_Right;
    i.QueryMod = ImGuiKeyModFlags_None;
    i.QueryToggleMod = ImGuiKeyModFlags_Ctrl;

    i.ContextMenuButton = ImGuiMouseButton_Middle;

    i.HorizontalMod = ImGuiKeyModFlags_Alt;
    i.VerticalMod = ImGuiKeyModFlags_Shift;
}
Big thanks to Evan for adding custom input map support to ImPlot.
In the Drag and Drop window, data stops appearing about one third from the left.
The same happens in Realtime plots
would be cool to see how this works
there's actually a plotting demo here, too: https://github.com/jnmaloney/WebGui
Although a small feature. I think this gives user a better way for seeing and comparing the value instead of showing the value at a fixed position .
Here is an example for the same .

We could also provide value getters for the user for these tooltips . So that they can show different values on hover .
Like if someone wants to see some stats which they don't want to plot but see the values w.r.t to x axis . They could add those in the getters .
Under investigation... The issue is on circular buffer rollover

There have been a few issues recently that would suggest we need to move from using float to double for plot coordinate values (at least internally for axis ranges and pixel conversions). Namely this relates to precision needed when zooming (#34 , #33 (comment)). Additionally, I know there's many of us in the science/robotics fields that may have double precision data as opposed to gaming devs using single precision.
I've made some progress on the double branch and would appreciate another set of eyes on it. There's a chance I overlooked a few important casts or something to that effect. Note that the precision can be reverted by changing typedef double ImPlotFloat; at the top of implot.h to float.
I have not made double versions of each PlotXXX function yet. I see two paths forward here:
ImPlotFloat typedef and explicitly use double internally. Expose both double and float versions of all our API functions. Data passed as float will be converted to double before being transformed to pixel space. My initial testing suggests this incurs around a 5% slowdown, which seems acceptable.ImPlotFloat typedef and allow the user to choose their floating point precision. The signatures of all API functions will take ImPlotFloat* etc. This would mean less code to maintain, with the downside being users can't mix/match double and float data in the same application (easily).Thoughts?
Hi there, love the library :) I wanted to ask if anyone is aware of Rust bindings being created for implot, similar to the ones for imgui itself (https://github.com/Gekkio/imgui-rs)?
If not, I'd like to step up and start working on that - I'd probably ask the folks over at imgui-rs about their approach and if any coordination should be done with that project.
First, thanks for this awesome lib, I love it.
I am using implot to build a homebrew performance profiler / time series visualizer.
The current charts of implot can plot metrics well, and what I am missing is gantt chart, or event chart, as shown by the following screeshot, from https://github.com/Celtoys/Remotery:

Is is possible to have this kind of feature in implot, I believe it will benefit other users as well.
There is a memory leak in BenchmarkItem in implot_demo.cpp. The Data pointer is freed with delete even though it points to an array. Please use delete[] or switch to a std::vector if you can.
This error showed up immediately when running Cppcheck on the code.
Both PlotBars and PlotHeatmap could benefit from the ability to add custom tick labels at specific locations (actually, this is a useful feature in general). The API function(s) for this would likely have to precedeBeginPlot due to the order in which plot-bounding boxes are calculated. Something like this might work:
SetNextPlotTickLabelsX(const char** labels, float* values, int n);
SetNextPlotTickLabelsY(const char** labels, float* values, int n, int y_axis = 0);
We would have to consider whether this should add to or override the default tick labels. Thoughts?
I can reproduce a crash in the implot drag & drop demo:
This is the crash:
↪ ./example_sdl_opengl3
Assertion failed: (i < Size), function operator[], file ../../imgui.h, line 1326.
fish: './example_sdl_opengl3' terminated by signal SIGABRT (Abort)
OSX 10.14.16, running example_sdl_opengl3. I'm using today's imgui master branch.
Hi,
I found the new version is much slower than 60.
How can I accelerate it? Thanks
iI thing this was triggered when droping #include imgui_internal.h which was including math.h
C:\LuaGL\gitsources\anima\LuaJIT-ImGui\cimplot\implot\implot_demo.cpp: In member function 'void {anonymous}::RollingData
::AddPoint(float, float)':
C:\LuaGL\gitsources\anima\LuaJIT-ImGui\cimplot\implot\implot_demo.cpp:50:22: error: 'fmodf' was not declared in this sco
pe
         float xmod = fmodf(x, Span);
                      ^~~~~
How to achieve HiDPI scaling with Pie Charts ?

Ubuntu 20.04
Resolution: 3840x2160
Scaling factor: 2
1.) Minor ticks should not suddenly become major ticks, but gradually blend into major ticks. New minor ticks should blend in out of completely transparent ones. This will look much nicer when you do zooming, especially very rapid zooming. The point is not to have sudden changes in an image
2.) Add very mild animation on zooming - instead of sudden changes in zoom, zoom in gradually, starting at very fast speed, and slowing down when reaching zoom target, play the whole animation within 0.5-0.8second so it is still as sharp and responsive and not annoying. Also put it on a flag
3.) When zooming in, amount of digits for each tick grows and at some point they start to overlap.

I suggest skipping outputting text for ticks which will overlap with previous tick, with preference for major ticks of course.
Announcements of changes and new features will be posted here. Click Subscribe to the right to receive updates!
Your library is truly awesome, congrats!
When it come to C++ libraries, most of the time there is most of the time no easy way to get a working demonstration. First, you have to download the code setup the build environment, etc. There, C++ is lagging behind some other languages, especially on the web.
However, emscripten can help a lot in this case. In order to tryr to fill this gap, I spent a few hours this afternoon in order to make an online demo of your library.
It is live here, and the source code for this demo is on github.
Here are some screenshots:
implot demo:

source code browser with access to the different demos:

It runs at 120 fps, except for the benchmark (which I suspect is blocked because it may consume too much memory)
If you are interested, you could may be use this in order to add an interactive demo in your Readme. Feel free to deploy the wasm files on any server of your choice.
Thanks
Do we need to really support logical combination of markers like (ImPlotMarker_Circle | ImPlotMarker_Square) ?
If not we can directly have a jump table [ImPlotMarker_XXX has to indexed on element number instead of bits ]
template <typename Transformer, typename Getter>
inline void RenderMarkers(Getter getter, Transformer transformer, ImDrawList& DrawList, bool rend_mk_line, ImU32 col_mk_line, bool rend_mk_fill, ImU32 col_mk_fill) {
    static void (*marker_table[])(ImDrawList&, const ImVec2&, float s, bool, ImU32, bool, ImU32, float) = { MarkerCircle, MarkerSquare, MarkerDiamond , MarkerUp , MarkerDown , MarkerLeft, MarkerRight, MarkerCross, MarkerPlus, MarkerAsterisk};


    for (int i = 0; i < getter.Count; ++i) {
        ImVec2 c = transformer(getter(i));
        if (gp.BB_Plot.Contains(c)) {
            marker_table[gp.Style.Marker](DrawList, c, gp.Style.MarkerSize, rend_mk_line, col_mk_line, rend_mk_fill, col_mk_fill, gp.Style.MarkerWeight);
            // TODO: Optimize the loop and if statements, this is atrocious
            /*if (HasFlag(gp.Style.Marker, ImPlotMarker_Circle))
                MarkerCircle(DrawList, c, gp.Style.MarkerSize, rend_mk_line, col_mk_line, rend_mk_fill, col_mk_fill, gp.Style.MarkerWeight);
            if (HasFlag(gp.Style.Marker, ImPlotMarker_Square))
                MarkerSquare(DrawList, c, gp.Style.MarkerSize, rend_mk_line, col_mk_line, rend_mk_fill, col_mk_fill, gp.Style.MarkerWeight);
            if (HasFlag(gp.Style.Marker, ImPlotMarker_Diamond))
                MarkerDiamond(DrawList, c, gp.Style.MarkerSize, rend_mk_line, col_mk_line, rend_mk_fill, col_mk_fill, gp.Style.MarkerWeight);
            if (HasFlag(gp.Style.Marker, ImPlotMarker_Up))
                MarkerUp(DrawList, c, gp.Style.MarkerSize, rend_mk_line, col_mk_line, rend_mk_fill, col_mk_fill, gp.Style.MarkerWeight);
            if (HasFlag(gp.Style.Marker, ImPlotMarker_Down))
                MarkerDown(DrawList, c, gp.Style.MarkerSize, rend_mk_line, col_mk_line, rend_mk_fill, col_mk_fill, gp.Style.MarkerWeight);
            if (HasFlag(gp.Style.Marker, ImPlotMarker_Left))
                MarkerLeft(DrawList, c, gp.Style.MarkerSize, rend_mk_line, col_mk_line, rend_mk_fill, col_mk_fill, gp.Style.MarkerWeight);
            if (HasFlag(gp.Style.Marker, ImPlotMarker_Right))
                MarkerRight(DrawList, c, gp.Style.MarkerSize, rend_mk_line, col_mk_line, rend_mk_fill, col_mk_fill, gp.Style.MarkerWeight);
            if (HasFlag(gp.Style.Marker, ImPlotMarker_Cross))
                MarkerCross(DrawList, c, gp.Style.MarkerSize, rend_mk_line, col_mk_line, rend_mk_fill, col_mk_fill, gp.Style.MarkerWeight);
            if (HasFlag(gp.Style.Marker, ImPlotMarker_Plus))
                MarkerPlus(DrawList, c, gp.Style.MarkerSize, rend_mk_line, col_mk_line, rend_mk_fill, col_mk_fill, gp.Style.MarkerWeight);
            if (HasFlag(gp.Style.Marker, ImPlotMarker_Asterisk))
                MarkerAsterisk(DrawList, c, gp.Style.MarkerSize, rend_mk_line, col_mk_line, rend_mk_fill, col_mk_fill, gp.Style.MarkerWeight);*/
        }
    }
}I was wondering if there is something to support time in dd/mm/yy and hours:minutes: seconds on the x-axis vs some data on the y-axis.

I have this warning compiling
C:\LuaGL\gitsources\anima\LuaJIT-ImGui\cimplot\implot\implot_demo.cpp:215:65: warning: ISO C++ forbids converting a string constant to 'char*' [-Wwrite-strings]
         static char* labels1[]   = {"Frogs","Hogs","Dogs","Logs"};
one solution is to decalre static const char* labels1[], but then also PlotPieChart should take const char* instead of just char*
Original post by @ejyanezp:
Great Job, I am having fun with your libraries, could I propose an enhacement?
For Geophysical software, we need the X-Axis labels at the top of the box of the plot. Is it possible?
Look for an example at:
http://pages.geo.wvu.edu/~wilson/geol391/3DInterp.htm
Look from the Figure 3 and beyond.
Thanks!
Hello,
Looking for some advice here...
One of our potential uses for ImPlot involves rendering many graphs vertically next to each other, per the following screen shot:
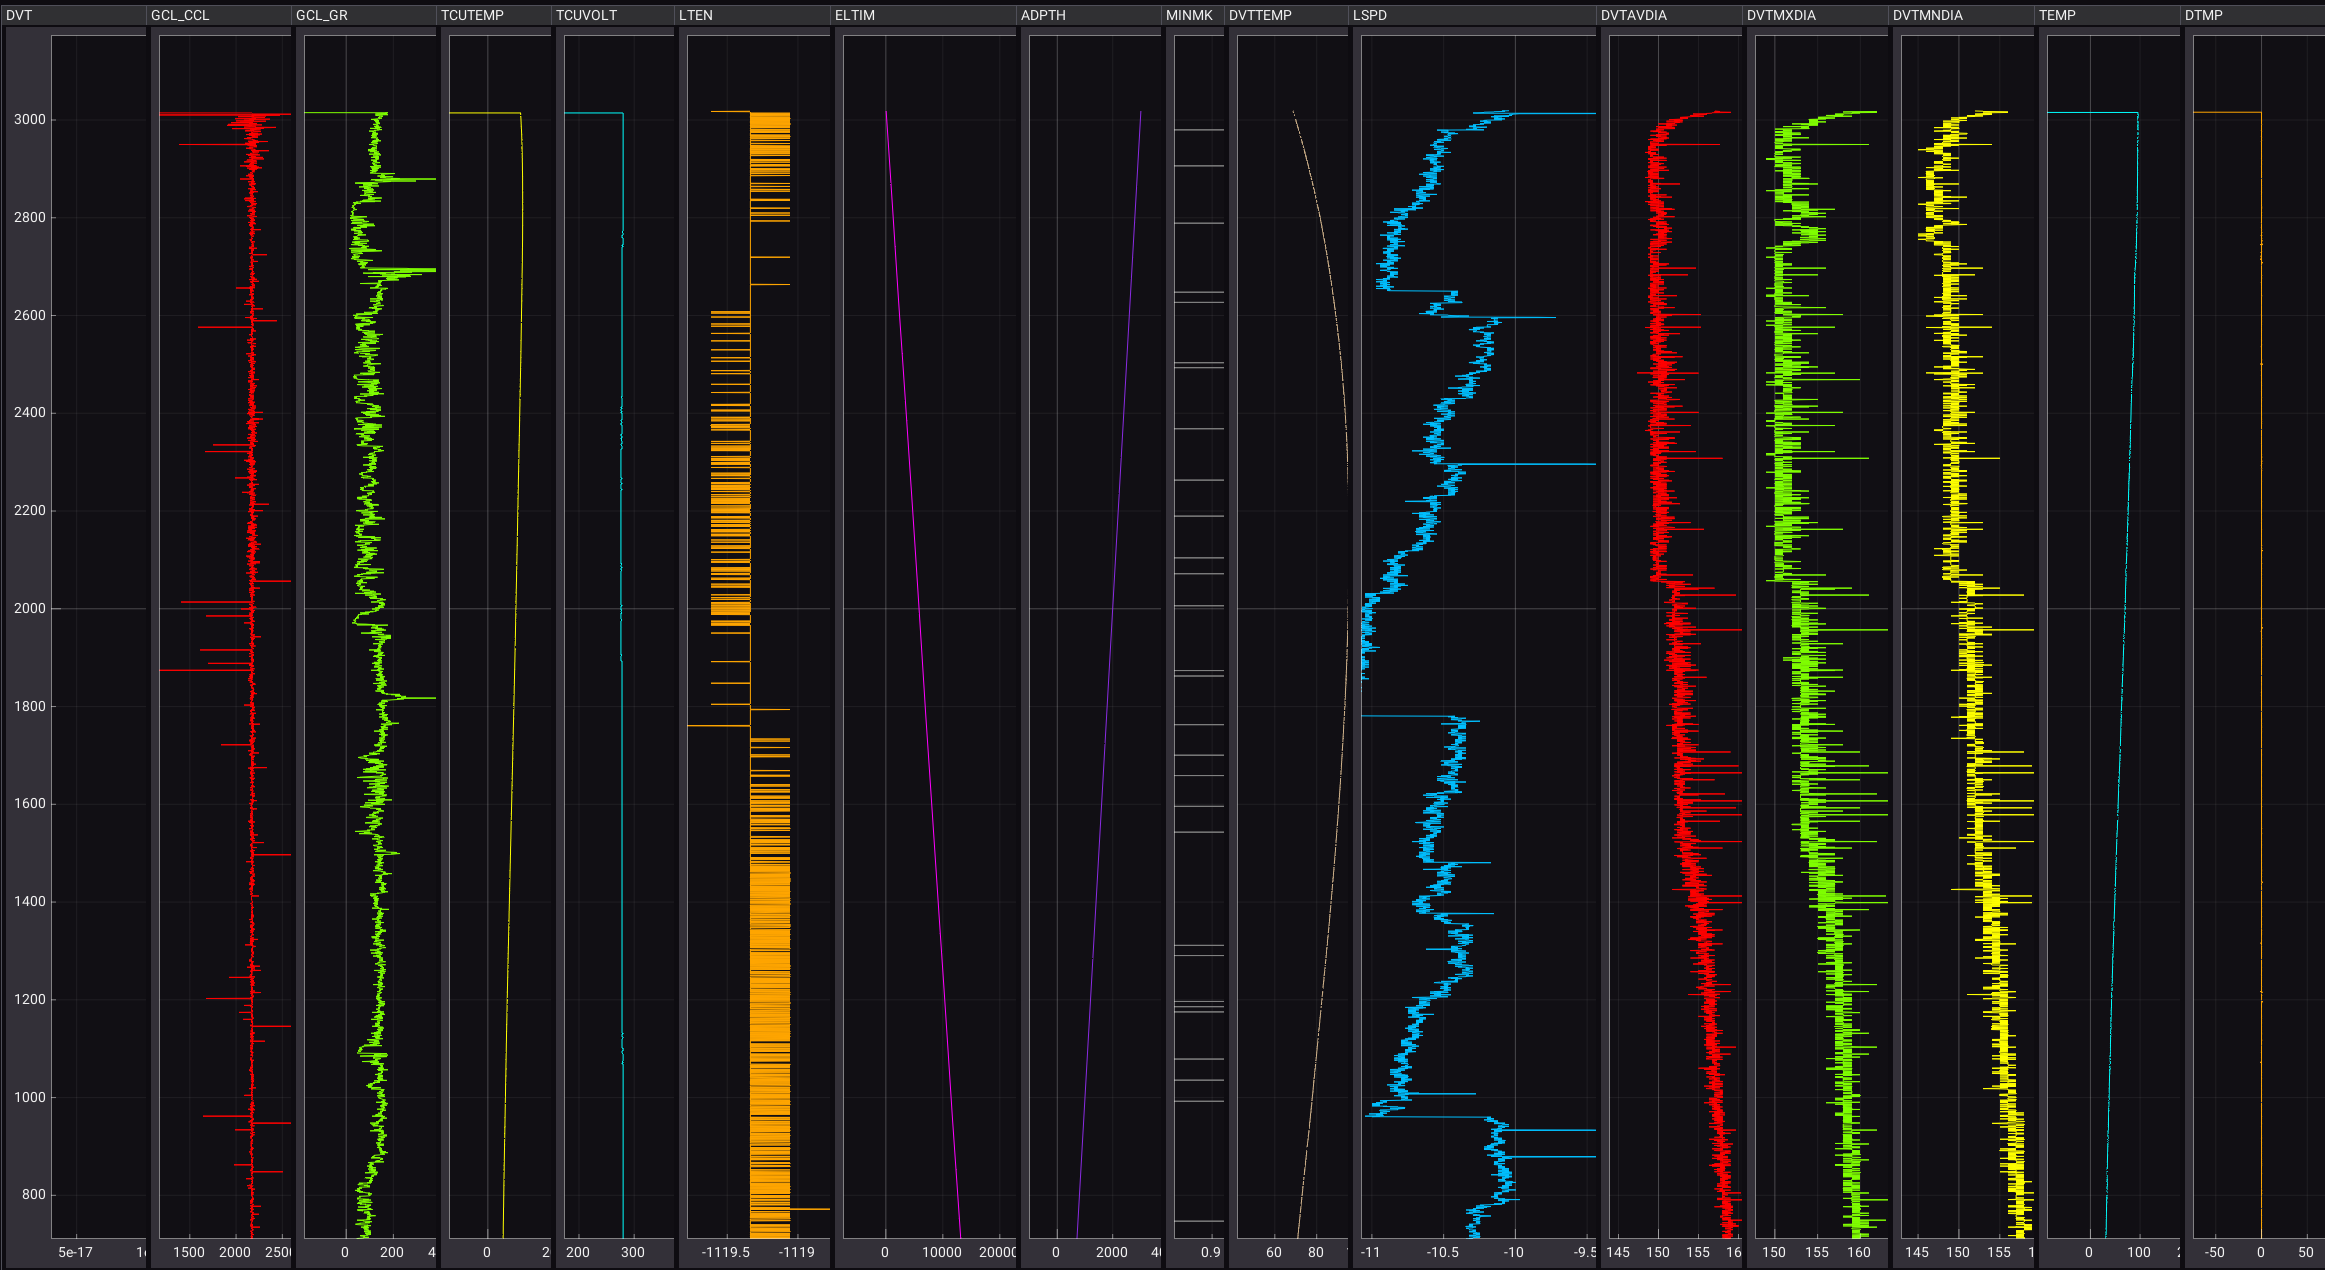
Which is a first-draft prototype mockup to reproduce functionality of a different application, which looks like this:

Now, let me acknowledge that using ImPlot to draw graphs vertically (essentially swapping X and Y and hoping things will work) could be considered 'abusing' the library outside its intended use. But since it appears that (for the most part) ImPlot happy draws multiple Y values for unique X values, we figured it's worth exploring ImPlot for this use case.
We integrated the new table branch of ImGui and use the new table layout functionality to create the multiple column "tracks", each containing one graph. Thanks to ImGui we automatically get resizing, reordering, and hiding/showing of each track. Which is pretty cool.
So I became tentatively optimistic.
The main issue where things currently fall down appears to be around double-click auto sizing (and the FitThisFrame functionality. For some reason, whenever the plot width shrinks below a certain size (like in the first screenshot above), the FitThisFrame logic appears to break down, and a double click on the graph no longer zooms to fit the entire graph.
I've stepped through ImPlot's code, and as far as I've been able to debug; all the logic around calculating the X- and Y-axis extents works as expected, as does the calculation of Mx in the UpdateTransformCache.
My hunch is that somewhere in the drawing code, gp.PixelRange is only willing to shrink to a certain point, beyond which it clamps to some kind of minimum graph width, and thus failing to fully fit the full extents of the graph's X-axis.
I'm not expecting you to debug this issue for us. Like I said, I recognize that ImPlot's primary purpose is to render traditional X-Y graphs with a horizontal layout (unfortunately that's not an option for us).
My questions are two-fold:
Specific to this issue -- without you spending time looking into this issue, do you happen to have any hunch as to why FitThisFrame might break down when a graph gets very narrow, and where I should look to debug this myself?
And more generally -- do you think using ImPlot is even a good idea here, or did we step so far outside of ImPlot's intended purpose, that we're better of writing our own bespoke graph/plot functionality? (FWIW, we already use ImPlot for several other panels in our application, that have traditional X-Y graphs, and we're very happy with it there).
Appreciate any thoughts, but I realize the open-endedness of this question, so feel free to ignore.
Thanks,
Jaap Suter
Thank you very much for the great work.
I have some question about real-time plot. I would like to make the background area of plot to be transparent.
https://github.com/epezent/implot/blob/master/implot_demo.cpp#L271
Tried to find related options or parameters but could not find out. Are there any ideas about this feature?
This is relating to the effort to bind implot and use it in GIU. Relevant GIU issue.
I've gotten some of the basics of implot bound into imgui-go already working. However one issue I ran into was that some of the enum types don't have defined values (they are enumerated automatically). This makes them hard to use via FFI. To work around this, I modified our in-tree fork to split the relevant enums out into their own header, which let me interface with it from Cgo. (implot.h cannot be directly imported into Cgo, since it doesn't understand many of the C++-isms)
There are two ways to work around this that I can think of:
I would be happy to make the needed changes and submit a PR, but I wanted to see if @epezent had a preference between the two before I do the work, or if you can think of a better way to do this.
I used the examples_sdl_opengl3 bundled with imgui and added in the implot code with
ImPlot::ShowDemoWindow() to draw the example code. This triggers a crash when compiled with -fsanitize=address on Linux and GCC 9.3.0 using implot git version
37ee2d4
=================================================================
==48757==ERROR: AddressSanitizer: global-buffer-overflow on address 0x55bf12668948 at pc 0x55bf1250ef5a bp 0x7ffeebd56060 sp 0x7ffeebd56050
READ of size 4 at 0x55bf12668948 thread T0
    #0 0x55bf1250ef59 in OffsetCalculator ../../implot.cpp:164
    #1 0x55bf1250d61e in ImPlot::SetColormap(int, int) ../../implot.cpp:3499
    #2 0x55bf12510d14 in ImPlot::ImPlotContext::ImPlotContext() ../../implot.cpp:424
    #3 0x55bf1250f062 in __static_initialization_and_destruction_0 ../../implot.cpp:524
    #4 0x55bf1250f09b in _GLOBAL__sub_I__ZN11ImPlotStyleC2Ev ../../implot.cpp:3631
    #5 0x55bf125be26c in __libc_csu_init (/home/qeed/imgui/examples/example_sdl_opengl3/example_sdl_opengl3+0x2a926c)
    #6 0x7fe54894303f in __libc_start_main (/lib/x86_64-linux-gnu/libc.so.6+0x2703f)
    #7 0x55bf123620cd in _start (/home/qeed/imgui/examples/example_sdl_opengl3/example_sdl_opengl3+0x4d0cd)

0x55bf12668948 is located 0 bytes to the right of global variable 'csizes' defined in '../../implot.cpp:3498:16' (0x55bf12668920) of size 40
SUMMARY: AddressSanitizer: global-buffer-overflow ../../implot.cpp:164 in OffsetCalculator
Shadow bytes around the buggy address:
  0x0ab8624c50d0: f9 f9 f9 f9 f9 f9 f9 f9 f9 f9 f9 f9 f9 f9 f9 f9
  0x0ab8624c50e0: f9 f9 f9 f9 f9 f9 f9 f9 f9 f9 f9 f9 f9 f9 f9 f9
  0x0ab8624c50f0: f9 f9 f9 f9 f9 f9 f9 f9 f9 f9 f9 f9 f9 f9 f9 f9
  0x0ab8624c5100: f9 f9 f9 f9 f9 f9 f9 f9 f9 f9 f9 f9 f9 f9 f9 f9
  0x0ab8624c5110: f9 f9 f9 f9 f9 f9 f9 f9 f9 f9 f9 f9 f9 f9 f9 f9
=>0x0ab8624c5120: f9 f9 f9 f9 00 00 00 00 00[f9]f9 f9 f9 f9 f9 f9
  0x0ab8624c5130: 00 00 00 00 00 00 00 00 00 00 00 00 00 00 00 00
  0x0ab8624c5140: 00 00 00 00 00 00 00 00 00 00 00 00 00 00 00 00
  0x0ab8624c5150: 00 00 00 00 00 00 00 00 f9 f9 f9 f9 f9 f9 f9 f9
  0x0ab8624c5160: f9 f9 f9 f9 f9 f9 f9 f9 f9 f9 f9 f9 f9 f9 f9 f9
  0x0ab8624c5170: f9 f9 f9 f9 f9 f9 f9 f9 f9 f9 f9 f9 f9 f9 f9 f9
Shadow byte legend (one shadow byte represents 8 application bytes):
  Addressable:           00
  Partially addressable: 01 02 03 04 05 06 07
  Heap left redzone:       fa
  Freed heap region:       fd
  Stack left redzone:      f1
  Stack mid redzone:       f2
  Stack right redzone:     f3
  Stack after return:      f5
  Stack use after scope:   f8
  Global redzone:          f9
  Global init order:       f6
  Poisoned by user:        f7
  Container overflow:      fc
  Array cookie:            ac
  Intra object redzone:    bb
  ASan internal:           fe
  Left alloca redzone:     ca
  Right alloca redzone:    cb
  Shadow gap:              cc
==48757==ABORTING
Looking at the location of the crash, the error seems to occur at line 3499
  static int csizes[ImPlotColormap_COUNT] = {10,9,9,12,11,11,11,11,11,11};
  static OffsetCalculator<ImPlotCol_COUNT> coffs(csizes);
ImPlotCol_COUNT is larger than ImPlotColormap_COUNT and thus it will overwrite memory.
The fix seems to be using ImPlotColormap_COUNT for OffsetCalculator.
Hello,
Small bug when drawing several Begin/EndPlot with different sizes : the axis are based on the canvas BB of the previous Plot.
Quick fix : in implot.cpp move the lines 936-941 ("adaptive division") after the calculation of the canvas BB line 976. Then the axis will use the correct canvas BB (not the previous one)
Thx
Hi. Thank you very much for such an amazing library!
Would you mind to implement a candlestick chart? It would be great to have a function with signature like
void PlotCandlestickChart(const char* label_id, const float* xs, const float* opens, const float* closes, const float* lows, const float* highs, int count, int offset, int stride)I have a very basic implementation which looks like this

The implementation is very straightforward and based on the error bars code, but I can share it here if you want.
Let me explain some problems I've faced here:
Please let me know if I can help somehow.
Thanks!
When plotting 1/x or similar it would be useful to have a vertical line appearing for infinite values.
Does it make sense?
To reproduce:
in the plot demo window expand custom styles and custom rendering (2entries before last one)
Drag plot from custom styles all the way down and observer that plot from custom rendering is also being dragged
My team liked your plotting extension for ImGUI and have integrated it into our project. We are looking for support for pie charts, and we hope this would not be too much work. If you provide some pointers where to start, we could look into doing a pull request.
When you have super dense plots (many points hit a pixel), you can see holes in the rasterization pattern. Consider following plot, which plots a line:
ImPlot::PlotLine("line, [](void*, int idx) { float v = float( 3.0 * idx / (1000000 - 1)); return ImVec2(v, v); }, nullptr, 1000000);
You can observe single pixels missing on a plot.
I believe it's because triangles generated for line segments do not have exactly same coordinates.
(PS. you need my million line PR for this to work)
The issue serves to continue on-going discussions from the original plotting widget that was found in mahi-gui.
I'm testing PlotShaded and i notice with metrics that culling is not working/not handled
My application has multiple visible plots. It’s really easy to drag from a data source to a particular plot, but it would also be a nice feature to be able to drag a series from the legend of one plot to another plot. API wise I'm thinking something like (between BeginPlot and EndPlot), mimicing ImGui::BeginDragDropSource():
if (ImPlot::BeginLegendDragDropSource("id")) {
  ImGui::SetDragDropPayload(...);
  // text etc for DND tooltip
  ImPlot::EndLegendDragDropSource();
}
I think a temporary workaround would be to use the legend hovered feature and detect drags, but that feels very manual and error-prone.
Tested with 218ed09
https://github.com/jpieper/implot/tree/20200511-bigplot

You can see that the more points which are culled, the further the plot gets drawn. I traced down a ways and couldn't figure out where the truncation was happening.
Moving discussions of multi-axis support to a separate issue. Previous comments below:
In heatmap I have observed that another bounds other than [0,1] is not allowing.
After checking the code this issue could be resolved by replacing the max bound set to 1 (for determining the y coordinate of p) by the max y bound as parameter in function RenderHeatmap().
Good job
A declarative, efficient, and flexible JavaScript library for building user interfaces.
🖖 Vue.js is a progressive, incrementally-adoptable JavaScript framework for building UI on the web.
TypeScript is a superset of JavaScript that compiles to clean JavaScript output.
An Open Source Machine Learning Framework for Everyone
The Web framework for perfectionists with deadlines.
A PHP framework for web artisans
Bring data to life with SVG, Canvas and HTML. 📊📈🎉
JavaScript (JS) is a lightweight interpreted programming language with first-class functions.
Some thing interesting about web. New door for the world.
A server is a program made to process requests and deliver data to clients.
Machine learning is a way of modeling and interpreting data that allows a piece of software to respond intelligently.
Some thing interesting about visualization, use data art
Some thing interesting about game, make everyone happy.
We are working to build community through open source technology. NB: members must have two-factor auth.
Open source projects and samples from Microsoft.
Google ❤️ Open Source for everyone.
Alibaba Open Source for everyone
Data-Driven Documents codes.
China tencent open source team.