Giter VIP home page Giter VIP logo

vts-browser-js's Introduction

VTS Browser JS

VTS Browser JS is a powerful JavaScript 3D map rendering engine with a very small footprint (about 163 kB of gziped JS code). It provides almost all features for web-based 3D mapping you will ever want.

VTS Browser JS is independently usable part of VTS 3D Geospatial Software Stack: a state-of-the-art, full-stack open source platform for 3D geospatial application development.

With VTS Browser JS you may combine and render diverse geospatial data in a single online map, style and display various types of geodata, render textured polygonal meshes or OBJ models, or even render topographic labels in almost any international writing system.

VTS Browser JS showcase

Features

  • part of a comprehensive open-source 3D geospatial software Stack
  • supports all modern web browsers
  • photorealistic rendering
  • geocoding API support
  • tiled, hierarchical data model
  • optimized for web-based rendering
  • supports any coordinate system
  • multiple surfaces
  • multiple bound layers on each surface
  • vector layers (geodata)
  • geodata styling and geodata interaction
  • dynamic surfaces and layer switching
  • international writing systems (e.g. Arabic, Devangaric, Chinese, Japanese, ...)
  • extensive, yet simple API (including UI extensions)
  • custom meshes, lines, polygons, icons, OBJ models, etc
  • rendering and styling of GeoJSON files
  • very small footprint (163KB minified and gzipped)
  • large set of ready-to-use data
  • open-source under BSD-2 license

Comparison to CesiumJS library

The open-source CesiumJS is an excellent JavaScript 3D mapping library which is widely used and frequently compared to VTS Browser JS. The following table might help you to identify the application scenarios where VTS Browser JS may be an alternative, or simply a straightforward software platform of choice for your project.

Feature VTS Browser JS CesiumJS
Different coordinate systems support yes limited
Dynamic tiled surfaces mixing (including glues) yes no
Multiple surfaces and multiple bound layers support (including transparent layers) yes no
Bound layers with optimized masks yes no
Out-of-the-box OSM data support with custom styling yes limited
Open-source backend components yes no
Backend data-fusion capabilities yes no
Support for international writing systems yes limited
Compact-size library (gzipped and minified) 221 KB 577 KB + Workers

Live Demos

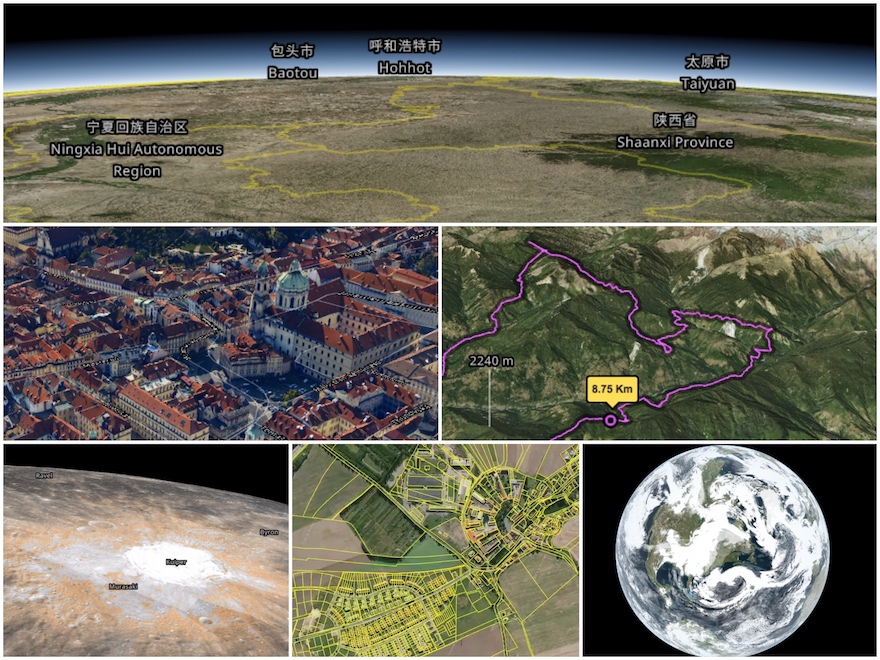
These are some of the applications built with VTS browser JS:

Examples

First steps

  1. Include The VTS browser JS library
<link rel="stylesheet"
  type="text/css" href="https://cdn.melown.com/libs/vtsjs/browser/v2/vts-browser.min.css" />
<script type="text/javascript"
  src="https://cdn.melown.com/libs/vtsjs/browser/v2/vts-browser.min.js"></script>
  1. Declare map containing element (with id map-div)
<div id="map-div" style="width:100%; height:100%;"></div>
  1. Initiate vts browser (with example map configuration)
<script>
  var browser = vts.browser('map-div', {
    map: 'https://cdn.melown.com/mario/store/melown2015/map-config/melown/VTS-Tutorial-map/mapConfig.json'
  });
</script>

Wonder where to find mapConfig.json file? See Map Configuration section.

Next steps

You can run many examples in JSFiddle.

Get the library

There is several ways how to bundle The VTS Browser JS Library into your project.

Our CDN

The easiest way to link The VTS Browser JS Library is to use the latest build (or specific version) from Melown Technologies CDN.

<link rel="stylesheet"
  href="https://cdn.melown.com/libs/vtsjs/browser/v2/vts-browser.min.css" />
<script type="text/javascript"
  src="https://cdn.melown.com/libs/vtsjs/browser/v2/vts-browser.min.js"></script>

Prebuilt

In case you do not want to build libray yourself or use our CDN, there is a link where you can find latest compiled libraries with demo examples.

NPM repository

Vts-browser-js library is in npm js repository. To add it as dependecy to your project just add it as any npm package

npm install -S vts-browser-js

Build from code

If you prefer, you may build The VTS Browser JS Library from source code.

Build system

The build system uses webpack module bundler. Typical development cycle starts with npm install for installation of dependenices. Then you usually run webpack-dev-server and build with webpack.

Install

Download and install all dependencies to local node_modules directory.

NOTE: For some dependencies, you need git available in your system.

npm install

or more advanced (if you are using new versions of NodeJS and Yarn)

yarn install

Run dev server

The development server is serving local files at http://localhost:8080.

node_modules/.bin/webpack-dev-server

And go to http://localhost:8080/demos/

Build

node_modules/.bin/webpack

The unzipped file (along with source map and CSS) is stored in build/ directory. You may now start the dev server (see lower) and open browser at http://localhost:8080 to see some demos in the demos/ directory.

Build compressed version

The compressed version - it's intended to be used in in production env. You can include in the <script ...></script> tags (along with CSS) there.

Compressed version is build in the dist/ directory.

NODE_ENV=production node_modules/.bin/webpack

Makefile

There is also Makefile available in the project directory. Referer make help to specific make targets. The Makefile is just wrapper around npm run commands (which are wrappers around webpack configuration).

Map Configuration

Map configuration contains a all information The VTS Browser JS library needs to display given map/model. Library is usually initialize with URL to mapConfig.json file which is JSON representation of Map configuration data.

The question is, where you can get your own Map Configuration. Basically you have two options:

Melown Cloud

Melown Cloud is point-and-click interface to a subset of VTS technology, operated by Melown Tecchnologies. Conveniently, Melown Cloud may be also used as a source of custom map configurations for VTS browser JS application development.

VTS 3D Geospatial Software stack

VTS Browser JS forms part of the VTS 3D Geospatial Software Stack. Running the full stack gives you complete control over your map resources, provides you with powerful data fusion capabilities and allows for closed networks or other types of off-grid deployment.

Documentation

VTS Browser JavaScript API documentation is available in our wiki:

License

See the LICENSE file for VTS Browser JS license, run webpack and check the build/3rdpartylicenses.txt file for 3rd party licenses.

How to contribute

Check out the CONTRIBUTING.md file.

vts-browser-js's People

Contributors

davidmtech avatar jachym avatar ondra-prochazka avatar skazemi avatar tomaskavan avatar

Stargazers

 avatar  avatar  avatar  avatar  avatar  avatar  avatar  avatar  avatar  avatar  avatar  avatar  avatar  avatar  avatar  avatar  avatar  avatar  avatar  avatar  avatar  avatar  avatar  avatar  avatar  avatar  avatar  avatar  avatar  avatar  avatar  avatar  avatar  avatar  avatar  avatar  avatar  avatar  avatar  avatar  avatar  avatar  avatar  avatar  avatar  avatar  avatar  avatar  avatar  avatar  avatar  avatar  avatar  avatar  avatar  avatar  avatar  avatar  avatar  avatar  avatar  avatar  avatar  avatar  avatar  avatar  avatar  avatar  avatar  avatar  avatar  avatar  avatar  avatar  avatar  avatar  avatar  avatar  avatar  avatar  avatar  avatar  avatar  avatar  avatar  avatar  avatar  avatar  avatar  avatar  avatar  avatar  avatar  avatar  avatar  avatar  avatar  avatar  avatar  avatar

Watchers

 avatar  avatar  avatar  avatar  avatar  avatar  avatar  avatar  avatar  avatar  avatar  avatar  avatar  avatar  avatar  avatar  avatar  avatar  avatar  avatar  avatar  avatar  avatar  avatar  avatar

vts-browser-js's Issues

How do I use a custom shader?

For learning purposes, I just want to draw a simple triangle in screen space. but It doesn't render anything.

Do I need to add additional Settings for 'RendingStates' or 'MapLayers'?

code link

loading page

Sorry, new to this, so not sure if this is the right place.

I'm getting issues when trying to load map from Melown cloud using the vts-browser with js.

Access to XMLHttpRequest at 'https://cdn.melown.com/vts/melown2015/terrain/global/viewfinder3/0-0-0.meta?3' from origin 'https://www.holoceneadventures.com' has been blocked by CORS policy: No 'Access-Control-Allow-Origin' header is present on the requested resource.

vts-browser.min.js:5 GET https://cdn.melown.com/vts/melown2015/terrain/global/viewfinder3/0-0-0.meta?3 403

how to find mapConfig.json file

Hi, I was researching a bit of VTS, its functionality and its eventual application. I processed my data set (DMT, DEM, trueortho, 3D shape (3d line and 3d point), 3d mesh) for two areas (two areas of the city).

I inserted tilesets into storage and created a storage view.

I encountered a problem, when I want to create an application via VTS Browser JS I need to enter a mapConfig.json file.

var browser = vts.browser('map-div', {
map: ?
});

The problem is, I'm not clear on where the json file is. I received the mentioned file via the var --map-config ulcinj.json command, but I don't know how to invoke the file.

storage view is:
{
"storage": "../stage.melown2015",

  "tilesets": [
          "ulcinj-dem"
  ],

  "credits": { },

  "boundLayers": {
        "dof":"mapproxy/melown2015/tms/ulcinj/dof/boundlayer.json"
  },

  "freeLayers": {
        "vektor_Bandere":"mapproxy/melown2015/geodata/ulcinj/vektor_Bandere/freelayer.json",
        "vektor_Zice_NN":"mapproxy/melown2015/geodata/ulcinj/vektor_Zice_NN/freelayer.json"
  },

  "view": {
          "description": "",
          "surfaces": {
                  "ulcinj-dem": ["dof"]
          },
          "freeLayers": {
                 "vektor_Bandere":{},
                 "vektor_Zice_NN":{"style":"/store/stylesheet/vektor_Zice_NN.json"}
          }
  },

  "namedViews": {},

  "position": [
          "obj",77.098897,26.527094,"float",0.000000,0.0000000,-90.000000,0.000000,1774.101391,45.000000
  ],

  "version": 1

}

and mapConfig.json is:
{
"bodies" :
{
"Earth" :
{
"atmosphere" :
{
"colorHorizon" : [ 158, 206, 255, 255 ],
"colorZenith" : [ 62, 120, 229, 255 ],
"thickness" : 100000,
"visibility" : 100000
},
"class" : "planet",
"comment" : "Earth, Sol III, M-class planet.",
"defaultGeoidGrid" : "egm96_15.gtx",
"parent" : "Sun"
},
"Sun" :
{
"class" : "star",
"comment" : "Sol, G2V main-sequence star."
}
},
"boundLayers" :
{
"dof" : "mapproxy/melown2015/tms/ulcinj/dof/boundlayer.json"
},
"credits" : {},
"freeLayers" :
{
"vektor_Bandere" : "mapproxy/melown2015/geodata/ulcinj/vektor_Bandere/freelayer.json",
"vektor_Zice_NN" : "mapproxy/melown2015/geodata/ulcinj/vektor_Zice_NN/freelayer.json"
},
"glue" : [],
"namedViews" : {},
"params" : {},
"position" :
[
"obj",
77.098896999999994,
26.527094000000002,
"float",
0,
0,
-90,
0,
1774.1013909999999,
45
],
"referenceFrame" :
{
"body" : "Earth",
"description" : "Earth, global geographic reference frame (Melown 2015)",
"division" :
{
"extents" :
{
"ll" : [ -7500000, -7500000, -7500000 ],
"ur" : [ 7500000, 7500000, 7500000 ]
},
"heightRange" : [ -12000, 9500 ],
"nodes" :
[
{
"extents" :
{
"ll" : [ -20037508.342789002, -10018754.171394 ],
"ur" : [ 20037508.342789002, 10018754.171394 ]
},
"id" :
{
"lod" : 0,
"position" : [ 0, 0 ]
},
"partitioning" :
{
"00" :
{
"ll" : [ -20037508.342799999, -9467848.3472000007 ],
"ur" : [ 20037508.342799999, 9467848.3472000007 ]
},
"01" :
{
"ll" : [ -20037508.342799999, 9467848.3471611794 ],
"ur" : [ 20037508.342799999, 10018754.171399999 ]
},
"10" :
{
"ll" : [ -20037508.342799999, -10018754.171399999 ],
"ur" : [ 20037508.342799999, -9467848.3471611794 ]
}
},
"srs" : "eqc-wgs84"
},
{
"extents" :
{
"ll" : [ -20037508.342789002, -20037508.342789002 ],
"ur" : [ 20037508.342789002, 20037508.342789002 ]
},
"externalTexture" : true,
"id" :
{
"lod" : 1,
"position" : [ 0, 0 ]
},
"partitioning" : "bisection",
"srs" : "pseudomerc"
},
{
"extents" :
{
"ll" : [ 278600, 278600 ],
"ur" : [ 3721400, 3721400 ]
},
"externalTexture" : true,
"id" :
{
"lod" : 1,
"position" : [ 0, 1 ]
},
"partitioning" : "bisection",
"srs" : "steren-wgs84"
},
{
"extents" :
{
"ll" : [ 278600, 278600 ],
"ur" : [ 3721400, 3721400 ]
},
"externalTexture" : true,
"id" :
{
"lod" : 1,
"position" : [ 1, 0 ]
},
"partitioning" : "bisection",
"srs" : "steres-wgs84"
}
]
},
"extensions" :
{
"wmts" :
{
"content" : "pseudomerc",
"projection" : "urn:ogc:def:crs:EPSG::3857",
"wellKnownScaleSet" : "urn:ogc:def:wkss:OGC:1.0:GoogleMapsCompatible"
}
},
"id" : "melown2015",
"model" :
{
"navigationSrs" : "geographic-wgs84",
"physicalSrs" : "geocentric-wgs84",
"publicSrs" : "geographic-wgs84-egm96"
},
"parameters" :
{
"metaBinaryOrder" : 5
},
"version" : 1
},
"rois" : [],
"srses" :
{
"eqc-wgs84" :
{
"comment" : "Projected, wgs84 equidistant cylindrical (epsg:4087)",
"srsDef" : "+proj=eqc +lat_ts=0 +lat_0=0 +lon_0=0 +x_0=0 +y_0=0 +ellps=WGS84 +datum=WGS84 +units=m +no_defs",
"type" : "projected"
},
"geocentric-wgs84" :
{
"comment" : "Geocentric, WGS84 (epsg:4978)",
"srsDef" : "+proj=geocent +datum=WGS84 +units=m +no_defs",
"type" : "cartesian"
},
"geographic-wgs84" :
{
"comment" : "Geographic, WGS84 (epsg:4326)",
"srsDef" : "+proj=longlat +datum=WGS84 +no_defs",
"type" : "geographic"
},
"geographic-wgs84-egm96" :
{
"comment" : "Geographic, WGS84 with EGM96 vertical (epsg:4326+5773)",
"geoidGrid" :
{
"definition" : "geographic-wgs84-egm96-geoidgrid.jpg",
"extents" :
{
"ll" : [ -180, -90 ],
"ur" : [ 180, 90 ]
},
"srsDefEllps" : "+proj=longlat +datum=WGS84 +no_defs",
"valueRange" : [ -107, 85.400000000000006 ]
},
"srsDef" : "+proj=longlat +datum=WGS84 +geoidgrids=egm96_15.gtx +vunits=m +no_defs",
"type" : "geographic"
},
"pseudomerc" :
{
"comment" : "Projected, Web/Pseudo Mecator (epsg:3857)",
"periodicity" :
{
"period" : 40075016.685578004,
"type" : "X"
},
"srsDef" : "+proj=merc +a=6378137 +b=6378137 +lat_ts=0.0 +lon_0=0.0 +x_0=0.0 +y_0=0 +k=1.0 +units=m +nadgrids=@null +wktext +no_defs",
"type" : "projected"
},
"steren-wgs84" :
{
"comment" : "Projected, UPS north (epsg:32661)",
"srsDef" : "+proj=stere +lat_0=90 +lat_ts=90 +lon_0=0 +k=0.994 +x_0=2000000 +y_0=2000000 +datum=WGS84 +units=m +no_defs",
"type" : "projected"
},
"steres-wgs84" :
{
"comment" : "Projected, UPS south (epsg:32761)",
"srsDef" : "+proj=stere +lat_0=-90 +lat_ts=-90 +lon_0=0 +k=0.994 +x_0=2000000 +y_0=2000000 +datum=WGS84 +units=m +no_defs",
"type" : "projected"
}
},
"surfaces" :
[
{
"2d" :
{
"creditsUrl" : "http://127.0.0.1:8070/mapproxy/melown2015/surface/ulcinj/dem/{lod}-{x}-{y}.credits?0",
"maskUrl" : "http://127.0.0.1:8070/mapproxy/melown2015/surface/ulcinj/dem/{lod}-{x}-{y}.mask?0",
"metaUrl" : "http://127.0.0.1:8070/mapproxy/melown2015/surface/ulcinj/dem/{lod}-{x}-{y}.2dmeta?0",
"orthoUrl" : "http://127.0.0.1:8070/mapproxy/melown2015/surface/ulcinj/dem/{lod}-{x}-{y}-{sub}.ortho?0"
},
"id" : "ulcinj-dem",
"lodRange" : [ 15, 25 ],
"meshUrl" : "http://127.0.0.1:8070/mapproxy/melown2015/surface/ulcinj/dem/{lod}-{x}-{y}.bin?0",
"metaUrl" : "http://127.0.0.1:8070/mapproxy/melown2015/surface/ulcinj/dem/{lod}-{x}-{y}.meta?0",
"navUrl" : "http://127.0.0.1:8070/mapproxy/melown2015/surface/ulcinj/dem/{lod}-{x}-{y}.nav?0",
"textureUrl" : "http://127.0.0.1:8070/mapproxy/melown2015/surface/ulcinj/dem/{lod}-{x}-{y}-{sub}.jpg?0",
"tileRange" :
[
[ 11700, 6938 ],
[ 11701, 6939 ]
]
}
],
"textureAtlasReady" : false,
"version" : 1,
"view" :
{
"description" : "",
"freeLayers" :
{
"vektor_Bandere" : {},
"vektor_Zice_NN" :
{
"style" : "/store/stylesheet/vektor_Zice_NN.json"
}
},
"surfaces" :
{
"ulcinj-dem" : [ "dof" ]
}
},
"virtualSurfaces" : []
}

I don't know if you understood what the problem was. It would mean a lot to me to answer.

distance between coords

Hi! getDistance works just fine with wgs84 Coords

Is there a way how to use API to measure a distance between the camera position and navCoords, including heights?

Different style for each point in PointArray

Hi,

We use this method in order to fill geodata object with features: geodata.addPointArray(coordsArray, 'fix', 'some-points');.
By using the above method we can define a property object per Point Array. Later we can use the property in style filter to allocate a style for all points in this array.
We would like to have a different style for each point in point array. Is this possible?
We have tried to use addPoint method for the same purpose but the rendering becomes very slow for thousand points.

Thank you in advance!

map zoom level lock

Hello ) !
I'm trying to make a smooth zoom in but at low altitude there is a visual differences between foreground and background.
https://imgur.com/a/GSfATr2

Can you advise something? Perhaps there is a method to use the same zoom level for all tiles. Of course, this will increase the load time, but for my purposes it ok.

Is it possible to use the "viewfinder-1-arc-sec" data from melown's CDN?

Hello,

In the examples, mapConfig files are loaded from melown's CDN:
https://cdn.melown.com/mario/store/melown2015/map-config/melown/VTS-Tutorial-map/mapConfig.json
with URLs relative to the CDN for glues and meta ("metaUrl" : "../../../stage/glues/melown-viewfinder-world_melown-viewfinder-1-arc-sec/{lod}-{x}-{y}.2dmeta?1", etc.).

I tried the "basic" demo from the repo, saved the mapConfig.json file next to my index and edited it. I tried changing the "../../../" paths to the CDN, but with no success. It seems like sometimes the base URL is "http://cdn.melown.com/mario/store/", sometimes it's "http://cdn.melown.com/mario/proxy/", depending on the resource.
It looks like the CORS headers are present, to allow for cross-domain access.
So a couple of questions:

  • Is it allowed (legally speaking) to use the ressources (glues and stuff) from melown's CDN or is it forbidden? The project is open-source but generating/hosting all those files must be costy, so it would make sense
  • If it is not allowed, is there a way to download the DEM and generate the glues on my own VTS-backend? Is there a documented procedure?
  • If it is allowed, how do you create a mapConfig.json file for remote access to the CDN ressources

Thanks a lot,
Fabien

RangeError in GpuGroup.prototype.copyBuffer (v2.21.8 minified)

line:

data.elementBuffer = this.copyBuffer(new Float32Array(length), buffer, index); index += data.elementBuffer.byteLength;

Uncaught RangeError: Invalid typed array length: 671088640
at new Uint8Array (<anonymous>)
at d.copyBuffer (vts-browser.min.js:formatted:26008)
at d.addRenderJob2 (vts-browser.min.js:formatted:26030)
at p.processPackedCommands (vts-browser.min.js:formatted:6053)
at p.onGeodataProcessorMessage (vts-browser.min.js:formatted:6076)
at j.processProcessingTasks (vts-browser.min.js:formatted:18507)
at j.update (vts-browser.min.js:formatted:18542)
at A.onUpdate (vts-browser.min.js:formatted:2423)

Setting camera position

Geojson data gets rendered correctly.
But spotting the points on map becomes very difficult.
Is it possible that camera directly takes us just next to our rendered point/s?
I tried to do following:

`var position = map.getCameraInfo().position;

position = [x ,y,z];`

But it doesn't help.

Double click inside panel will pan map

If a user double-clicks inside a panel created via the browser.ui.addControl() method, the map will pan to the said location. This doesn't seem to be an issue with other button or panels such as the search input box however.
Example of this: https://jsfiddle.net/be637spg/
Double-click where it says 'Nothing hovered'

Why is Melown making so many requests on a low altitude map?

Hello,

I am coming back to Melown and comparing it to other 3D viewers and something that I noted is that melown makes about 1000 requests by default for the "Hello World" example:
https://jsfiddle.net/a5rh6vnh/2/
Looking at the Network panel, it looks like Melown loads ALL the tile pyramid from Z0 to initial zoom. So it requesting all the antarctica tiles (imagery and terrain) for some reasons that I can't understand
I noticed that Cesium and iTowns have the same behaviour, so there must be a technical reason behind this I guess ....

Can you give me an explanation as to why it doesn't just load the necessary levels?

Thanks,
Fabien

Stand-alone offline example (using static assets without backend)

Thanks for this amazing open-source project!

  • Is it possible to create a standalone vts-browser-js, while having all the assets in local static files?

How does look a simplest possible mapConfig.json having a basic regular "sphere" surface instead of an ellipsoid, without a need to load any server assets (or just a few pre-generated static files - but are they required for sphere with really basic math?) and displaying a single WGS84 jpg texture file and loading over it the standard OpenStreetMap-like Mercator tiles?

This would make a perfect minimalistic use-case for the open-source project...

Is it doable with the VTS project right now?

Here is a similar example - made using Cesium:
https://webglearth.github.io/webglearth2-offline/ with all the required static files hosted on GitHub at
https://github.com/webglearth/webglearth2-offline/tree/gh-pages/v2

I see https://github.com/Melown/vts-browser-js/blob/master/demos/basic/demo.js - where all the logic is on external file https://cdn.melown.com/mario/store/melown2015/map-config/melown/VTS-Tutorial-map/mapConfig.json loading a lot of additional assets...

I have failed to prepare a simplistic prototype with VTS Browser and the documentation did not help me much... All your standard examples always refer to the cloud assets. I know I could start vtsd and your mapproxy, but for a basic offline demo, this is just a crazy overhead - if it would be possible to serve a few static files...

Could you demonstrate a similar minimalistic example, please? @davidlevinsky?

Cesium clearly is capable of similar mode. We would be keen to adopt and recommend your open-source project - especially because it runs well with our OpenMapTiles tiles. This is a first step for ensuring it is a viable lightweight open-source option to Cesium...

Thanks for any tips where to start - or for a code of a basic standalone example...

MultiPoint not rendered

In my GeoJson fetched from server only Point features are present, and they render well.

I have defined style as:

var style = {
'constants': {
'@icon-marker': ['icons', 6, 8, 18, 18]
},
'bitmaps': {
'icons': 'http://maps.google.com/mapfiles/kml/shapes/placemark_circle.png'
},

So I can see green circles rendered.

But if I replace points and instead put MultiPoint features in GeoJson, with rest unchanged,
I don't see features rendered.

What can be the cause?

Can we draw a structure (During the runtime) using VTS ?

Hi,

I just wanted to know if we can draw any objects or structures like a cube or something after the scene has been rendered on the browser. Is there any functionality available on VTS which will enable me to do so? Please Provide me with some insights regarding that.

Thank You,

map-update

Hello!
The map-update event is triggered every time after the map element has been rendered. But how do I know that the whole map (i.e. all elements) is updated?
https://imgur.com/a/RZchhyJ

Point is not visible when we zoom near the surface

Hi,

We used your example Geodata Basic (https://github.com/Melown/vts-browser-js/wiki/Examples) in order to display a point on the right lat, lon, altitude.
Our try is on: https://jsfiddle.net/alamR/jjynbpoL/13/
The problem is that the point is not visible when we zoom near the surface.
The real altitude of the point is 333m.
In our code we add this point:
geodata.addPoint([14.3836691, 50.0485568, 333],
'fix', { 'name' : 'Nice place' }, 'some-place');
But it is not visible (when we zoom near surface)! When we change the altitude around 380m then we can see it.
Have we missed something?
Thank you in advance!

Uncaught TypeError: this.ui.setControlDisplayState is not a function

On some Chrome browsers there is such an error and the map does not start:

vts-browser.min.js:5 Uncaught TypeError: this.ui.setControlDisplayState is not a function
at new b (vts-browser.min.js:5)
at new l (vts-browser.min.js:5)
at Object.r (vts-browser.min.js:5)
at startDemo (sample-app-rest.js:14)
at sample-app-rest.js:27

Panning the map via script

Greetings,

would there be a way to pan the JavaScript VTS map programmatically? With Leaftlet and Google Maps, for example, this can be achieved with their panBy functions. The VTS C++ map has also a "Pan" function as part of its Navigation, but I couldn't find something similar from the JavaScript version. Have I managed to miss it both from the API documentation and code, or is it yet to be implemented? Or would there be there something else that achieves the same functionality?

Thank you.

Uncaught RangeError: Offset is outside the bounds of the DataView

While zooming in/out with mouse I get Uncaught RangeError: Offset is outside the bounds of the DataView on the following line of code:

magic += String.fromCharCode(streamData.getUint8(stream.index, true)); stream.index += 1;

after this exception the map freezes.

here is the stack trace:
vts-browser.min.js:formatted:20137 Uncaught RangeError: Offset is outside the bounds of the DataView
at DataView.getUint8 ()
at n.parseMetatatile (vts-browser.min.js:formatted:20137)
at n.onLoaded (vts-browser.min.js:formatted:20120)
at j.processProcessingTasks (vts-browser.min.js:formatted:18504)
at j.update (vts-browser.min.js:formatted:18542)
at A.onUpdate (vts-browser.min.js:formatted:2423)
n.parseMetatatile @ vts-browser.min.js:formatted:20137
n.onLoaded @ vts-browser.min.js:formatted:20120
j.processProcessingTasks @ vts-browser.min.js:formatted:18504
j.update @ vts-browser.min.js:formatted:18542
A.onUpdate @ vts-browser.min.js:formatted:2423
requestAnimationFrame (async)
A.onUpdate @ vts-browser.min.js:formatted:2425

Slow rendering of points

Hi,

I am making use of VTS browser to render around 9k 3D points by reading GeoJSON data from a rest service. Every point is a Point feature. And I am defining my style icon as:

    'bitmaps': {
        'icons': 'http://maps.google.com/mapfiles/kml/shapes/placemark_circle.png'

Rendering is quite slow.

Is it down to use of .png or because all of the points are Point feature?

Issue while Geojson contains MultiPoint

I fetch GeoJson data from server.
When GeoJson contains Point features, all works fine.
But if I GeoJson contains only MultiPoints features, I get error as:

vts-browser.min.js:5 Uncaught TypeError: this.ui.setControlDisplayState is not a function
at new b (vts-browser.min.js:5)
at new l (vts-browser.min.js:5)
at Object.r (vts-browser.min.js:5)
at startDemo (sample-app-rest.js:14)
at sample-app-rest.js:27

At sample-app-rest.js:14, code is as:

browser = vts.browser('map-div', { map: 'https://cdn.melown.com/mario/store/melown2015/map-config/melown/VTS-Tutorial-map/mapConfig.json', position : [ 'obj', -122.018983,37.332663, 'float', 0.00, -23.00, -49.10, 0.00, 41033.50, 45.00 ] });

Why does MultiPoint cause issue?

controlMode.getCurrentController is not function

In any browser example, if you try to use the "compass" widget, you get error:

compass.js:68 Uncaught TypeError: this.browser.controlMode.getCurrentController is not a function

there is no getCurrentController defined in control-mode.js

Labels on map

Hello!
I made the labels on the map in html, used convertCoordsFromNavToCanvas to convert to the position of the labels
$ (". point." + attractions [item] .slug) .css ({"transform": "translate (" + coordX + "px," + coordY + "px)"});

But I ran into a problem. When moving and changing the viewing angle, the marks are shifted. Could you tell me what might be the reason?

Labels look like this - http://joxi.ru/4AkZRWNsoM04Y2

`
function pointsTypes() {
for (item in attractions) {
attraction = attractions[item];

    coordsCanvasPoint = [attraction.position.lng, attraction.position.lat, 'fix'];

    coordsPoint = map.convertCoordsFromNavToCanvas(coordsCanvasPoint, 'float');
    coordX = Math.round(coordsPoint[0] - 16.5);
    coordY = Math.round(coordsPoint[1] - 16.5);

    $(".point." + attractions[item].slug).css({"transform": "translate(" + coordX + "px," + coordY + "px)"});
}

}
`

Disabling terrain

Hi,

I want to render only the geometry data embedded in geoJson.
VTS seems to render default terrain too.

Can this be diabled?

With regards
Manish

Create package.json and gulpfile

  • package.json with working npm install
  • working yarn instead of npm install
  • webpack for build
  • basic unit tests
  • eslint
  • create two versions of final libs: core and core+browser
  • leave build untouched
  • start with ES6 imports

Minimum requirements melown

Hi,

What are the minimum requirements to open the mars-case-study in a chrome browser? This is the link I'm trying to open, but it takes too long to respond. It sure works, since it can be openend on another computer.
http://jetstream.signell.us:8070/mapproxy/mars-qsc/surface/mars-case-study/mars-mola-dem/?pos=obj,-77.442856,-7.249034,fix,3502.77,-78.57,-30.97,0.00,261871.59,45.00

I have a windows 10 Home device with these properties:
knipsel

Is it the computer properties that do not comply or are there any chrome settings or AdBlock settings that need to be adjusted?

Thanks a lot
Karen

Recommend Projects

  • React photo React

    A declarative, efficient, and flexible JavaScript library for building user interfaces.

  • Vue.js photo Vue.js

    🖖 Vue.js is a progressive, incrementally-adoptable JavaScript framework for building UI on the web.

  • Typescript photo Typescript

    TypeScript is a superset of JavaScript that compiles to clean JavaScript output.

  • TensorFlow photo TensorFlow

    An Open Source Machine Learning Framework for Everyone

  • Django photo Django

    The Web framework for perfectionists with deadlines.

  • D3 photo D3

    Bring data to life with SVG, Canvas and HTML. 📊📈🎉

Recommend Topics

  • javascript

    JavaScript (JS) is a lightweight interpreted programming language with first-class functions.

  • web

    Some thing interesting about web. New door for the world.

  • server

    A server is a program made to process requests and deliver data to clients.

  • Machine learning

    Machine learning is a way of modeling and interpreting data that allows a piece of software to respond intelligently.

  • Game

    Some thing interesting about game, make everyone happy.

Recommend Org

  • Facebook photo Facebook

    We are working to build community through open source technology. NB: members must have two-factor auth.

  • Microsoft photo Microsoft

    Open source projects and samples from Microsoft.

  • Google photo Google

    Google ❤️ Open Source for everyone.

  • D3 photo D3

    Data-Driven Documents codes.