Giter VIP home page Giter VIP logo

meteostat-python's Introduction

Meteostat Python Package

The Meteostat Python library provides a simple API for accessing open weather and climate data. The historical observations and statistics are collected by Meteostat from different public interfaces, most of which are governmental.

Among the data sources are national weather services like the National Oceanic and Atmospheric Administration (NOAA) and Germany's national meteorological service (DWD).

Are you looking for a hosted solution? Try our JSON API.

Installation

The Meteostat Python package is available through PyPI:

pip install meteostat

Meteostat requires Python 3.6 or higher. If you want to visualize data, please install Matplotlib, too.

Documentation

The Meteostat Python library is divided into multiple classes which provide access to the actual data. The documentation covers all aspects of the library:

Example

Let's plot 2018 temperature data for Vancouver, BC:

# Import Meteostat library and dependencies
from datetime import datetime
import matplotlib.pyplot as plt
from meteostat import Point, Daily

# Set time period
start = datetime(2018, 1, 1)
end = datetime(2018, 12, 31)

# Create Point for Vancouver, BC
location = Point(49.2497, -123.1193, 70)

# Get daily data for 2018
data = Daily(location, start, end)
data = data.fetch()

# Plot line chart including average, minimum and maximum temperature
data.plot(y=['tavg', 'tmin', 'tmax'])
plt.show()

Take a look at the expected output:

2018 temperature data for Vancouver, BC

Contributing

Instructions on building and testing the Meteostat Python package can be found in the documentation. More information about the Meteostat bulk data interface is available here.

Donating

If you want to support the project financially, you can make a donation using one of the following services:

Data License

Meteorological data is provided under the terms of the Creative Commons Attribution-NonCommercial 4.0 International Public License (CC BY-NC 4.0). You may build upon the material for any purpose, even commercially. However, you are not allowed to redistribute Meteostat data "as-is" for commercial purposes.

By using the Meteostat Python library you agree to our terms of service. All meteorological data sources used by the Meteostat project are listed here.

Code License

The code of this library is available under the MIT license.

meteostat-python's People

Contributors

clampr avatar e-hamza avatar

Stargazers

 avatar  avatar  avatar  avatar  avatar  avatar  avatar  avatar  avatar  avatar  avatar  avatar  avatar  avatar  avatar  avatar  avatar  avatar  avatar  avatar  avatar  avatar  avatar  avatar  avatar  avatar  avatar  avatar  avatar  avatar  avatar  avatar  avatar  avatar  avatar  avatar  avatar  avatar  avatar  avatar  avatar  avatar  avatar  avatar  avatar  avatar  avatar  avatar  avatar  avatar  avatar  avatar  avatar  avatar  avatar  avatar  avatar  avatar  avatar  avatar  avatar  avatar  avatar  avatar  avatar  avatar  avatar  avatar  avatar  avatar  avatar  avatar  avatar  avatar  avatar  avatar  avatar  avatar  avatar  avatar  avatar  avatar  avatar  avatar  avatar  avatar  avatar  avatar  avatar  avatar  avatar  avatar  avatar  avatar  avatar  avatar  avatar  avatar  avatar  avatar

Watchers

 avatar  avatar  avatar  avatar  avatar  avatar  avatar  avatar  avatar

meteostat-python's Issues

Meteostat 2.0.0

Version 2 of this library won't release any time soon. However, I want to start collecting some ideas for a successor of the current version. In the past year, Meteostat Python has become the heart and the soul of Meteostat. Therefore, I want to take some time to discuss potential new features and changes.

The library was well received by the open source community and is actively used on dozens of projects. Therefore, the package's next iteration should put a strong focus on performance and stability. Also, let's try to maintain backwards-compatibility as much as possible and keep things simple.

Roadmap

  • Create a next branch
  • Define structure of interfaces
  • ...
  • Write tests for everything

Concepts

V2 will feature a full rewrite of the library. But there'll only be little changes to the public API.

Package Structure

For v2 I'm planning with the same package structure we already use in v1:

  • meteostat
    • Hourly(): Wrapper for hourly time series
    • Daily(): Wrapper for daily time series
    • Monthly(): Wrapper for monthly time series
    • Normals(): Wrapper for climate normals
    • Point(): Interface for geo points
    • Stations(): Meta data for weather stations
      • meta(): Returns dictionary with meta data for specified station ID
      • nearby(): Returns list of nearby station IDs for specified coordinates
      • ...

I'm also thinking about having a single ~/.meteostat/config.json file where global configuration can be changed. Additionally, users will be able to pass a dict to every class which allows individual configuration, e.g:

from meteostat import Hourly

config = {
 'max_age': 3600
}

data = Hourly('10637', config=config)

Examples

Daily data for closest weather station:

from meteostat import Stations, Point, Daily

# Set time period
start = datetime(2018, 1, 1)
end = datetime(2018, 12, 31)

# Get closest weather station
loc = Point(49.2497, -123.1193)
station = Stations().nearby(loc, limit=1)[0]

df = Daily(station, start, end)

Caching

For v2 I suggest using an SQL database for caching. Users can pass any SQLAlchemy connection and the library stores all data in dedicated SQL tables. This would allow rapid access of data on both spatial and time axis.

That's it for now. I'll keep extending this post with more concepts in the course of the following weeks and months. Feel free to add comments and share your ideas!

TypeError: '<=' not supported between instances of 'str' and 'datetime.datetime'

While running this Python example from the official documentation:

# Import Meteostat library and dependencies
from datetime import datetime
import matplotlib.pyplot as plt
from meteostat import Point, Daily

# Set time period
start = datetime(2018, 1, 1)
end = datetime(2018, 12, 31)

# Create Point for Vancouver, BC
vancouver = Point(49.2497, -123.1193, 70)

# Get daily data for 2018
data = Daily(vancouver, start, end)
data = data.fetch()

# Plot line chart including average, minimum and maximum temperature
data.plot(y=['tavg', 'tmin', 'tmax'])
plt.show()

I get the following error:
TypeError: '<=' not supported between instances of 'str' and 'datetime.datetime'

Note: I have all the dependencies installed as requested in the doc. I didn't get this error a few days ago, I just got it today, maybe it's related to the latest version?

aggregate function

I was using the aggregate function. I checked out the documentation of this function and it says
"prcp => sum"

When I double-checked with my data, it seemed the aggregate function calculates the average instead of the sum.

changing default value for radius in class: Point

Thank you for the awesome work.
In the Point class, I see the default values:

method: str = 'nearest'

# Maximum radius for nearby stations
radius: int = 35000

# Maximum difference in altitude
alt_range: int = 350

How can we change those? Point does not take the 'radius' keyword argument, or 'method'.

Model data when no station nearby

Hi!

Congratulations for this amazing repository. I think meteostat could be greatly improved if model data is provided by default if no nearby station is found for a given data point. This happens to me trying to find data in southern Spain as stations are really scarce in some areas there. As this scenario may appear frequently in certain areas, this new feature could be really cool to add.

Clear Cache: File not found error

Discussed in #96

Originally posted by Raysyu May 23, 2022
Dear meteostat,

I'm using your API to reteive weather data and this happened.
image
I was running this locally with a small portion of the original data about 10000/17500000 rows and it's working and as I ran the original file in a server this happened.

I would assume the locaiton of 'cache' can't be foudn when executing self.clear_cache
not sure what to do but any help would be great!

TypeError: '<=' not supported between instances of 'str' and 'datetime.datetime'

Hello, I'm executing the tutorial code and recieve an error as of recent.

from datetime import datetime
import matplotlib.pyplot as plt
from meteostat import Point, Daily

start = datetime(2018, 1, 1)
end = datetime(2018, 12, 31)

vancouver = Point(49.2497, -123.1193, 70)

data = Daily(vancouver, start, end)
data = data.fetch()

data.plot(y=['tavg', 'tmin', 'tmax'])
plt.show()

And I recieve the following error message:


TypeError                                 Traceback (most recent call last)
<ipython-input-3-be58684b41f0> in <module>
     11 
     12 # Get daily data for 2018
---> 13 data = Daily(vancouver, start, end)
     14 data = data.fetch()
     15 

~/notebook_venv/lib/python3.6/site-packages/meteostat/daily.py in __init__(self, loc, start, end)
    231             self._stations = loc.index
    232         elif isinstance(loc, Point):
--> 233             stations = loc.get_stations('hourly', start, end)
    234             self._stations = stations.index
    235         else:

~/notebook_venv/lib/python3.6/site-packages/meteostat/point.py in get_stations(self, granularity, start, end)
     77 
     78         # Apply inventory filter
---> 79         stations = stations.inventory(granularity, (start, end))
     80 
     81         # Apply altitude filter

~/notebook_venv/lib/python3.6/site-packages/meteostat/stations.py in inventory(self, granularity, required)
    238             temp._stations = temp._stations[
    239                 (pd.isna(temp._stations[granularity + '_start']) == False) &
--> 240                 (temp._stations[granularity + '_start'] <= required[0]) &
    241                 (
    242                     temp._stations[granularity + '_end'] +

~/notebook_venv/lib/python3.6/site-packages/pandas/core/ops/common.py in new_method(self, other)
     63         other = item_from_zerodim(other)
     64 
---> 65         return method(self, other)
     66 
     67     return new_method

~/notebook_venv/lib/python3.6/site-packages/pandas/core/ops/__init__.py in wrapper(self, other)
    368         rvalues = extract_array(other, extract_numpy=True)
    369 
--> 370         res_values = comparison_op(lvalues, rvalues, op)
    371 
    372         return self._construct_result(res_values, name=res_name)

~/notebook_venv/lib/python3.6/site-packages/pandas/core/ops/array_ops.py in comparison_op(left, right, op)
    242 
    243     elif is_object_dtype(lvalues.dtype):
--> 244         res_values = comp_method_OBJECT_ARRAY(op, lvalues, rvalues)
    245 
    246     else:

~/notebook_venv/lib/python3.6/site-packages/pandas/core/ops/array_ops.py in comp_method_OBJECT_ARRAY(op, x, y)
     54         result = libops.vec_compare(x.ravel(), y.ravel(), op)
     55     else:
---> 56         result = libops.scalar_compare(x.ravel(), y, op)
     57     return result.reshape(x.shape)
     58 

pandas/_libs/ops.pyx in pandas._libs.ops.scalar_compare()

> TypeError: '<=' not supported between instances of 'str' and 'datetime.datetime

There seem to be a change to either pandas or meteostat that recently broke this.

I tried your suggestion from #25 but to no effect. I managed to pull year wise data by replaceing the start and end with

start = '2018'
end = '2019'

but I can't select day or month this way.

keyerror: 'distance' when running sample script on Daily

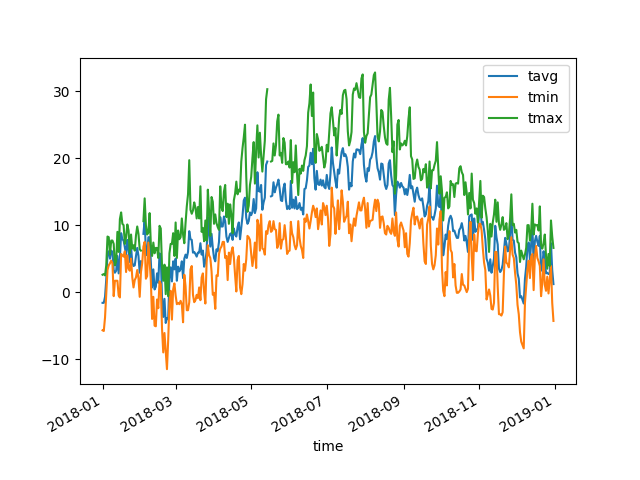
I had been running a script using meteostat fine, but it looks like perhaps something has broken in the code? I debugged by trying to run this sample script from the documentation.

`# Import Meteostat library and dependencies
from datetime import datetime
import matplotlib.pyplot as plt
from meteostat import Point, Daily

Set time period

start = datetime(2018, 1, 1)
end = datetime(2018, 12, 31)

Create Point for Vancouver, BC

vancouver = Point(49.2497, -123.1193, 70)

Get daily data for 2018

data = Daily(vancouver, start, end)
data = data.fetch()

Plot line chart including average, minimum and maximum temperature

data.plot(y=['tavg', 'tmin', 'tmax'])
plt.show()`

I'm running this in a JupterLab Notebook. This is the error it gives me:

`---------------------------------------------------------------------------
KeyError Traceback (most recent call last)
/usr/local/anaconda/lib/python3.6/site-packages/pandas/core/indexes/base.py in get_loc(self, key, method, tolerance)
2897 try:
-> 2898 return self._engine.get_loc(casted_key)
2899 except KeyError as err:

pandas/_libs/index.pyx in pandas._libs.index.IndexEngine.get_loc()

pandas/_libs/index.pyx in pandas._libs.index.IndexEngine.get_loc()

pandas/_libs/hashtable_class_helper.pxi in pandas._libs.hashtable.PyObjectHashTable.get_item()

pandas/_libs/hashtable_class_helper.pxi in pandas._libs.hashtable.PyObjectHashTable.get_item()

KeyError: 'distance'

The above exception was the direct cause of the following exception:

KeyError Traceback (most recent call last)
/usr/local/anaconda/lib/python3.6/site-packages/pandas/core/generic.py in _set_item(self, key, value)
3575 try:
-> 3576 loc = self._info_axis.get_loc(key)
3577 except KeyError:

/usr/local/anaconda/lib/python3.6/site-packages/pandas/core/indexes/base.py in get_loc(self, key, method, tolerance)
2899 except KeyError as err:
-> 2900 raise KeyError(key) from err
2901

KeyError: 'distance'

During handling of the above exception, another exception occurred:

ValueError Traceback (most recent call last)
in
12
13 # Get daily data for 2018
---> 14 data = Daily(vancouver, start, end)
15 data = data.fetch()
16

/usr/local/anaconda/lib/python3.6/site-packages/meteostat/daily.py in init(self, loc, start, end, model)
238 self.stations = loc.index
239 elif isinstance(loc, Point):
--> 240 stations = loc.get_stations('hourly', start, end)
241 self.stations = stations.index
242 else:

/usr/local/anaconda/lib/python3.6/site-packages/meteostat/point.py in get_stations(self, granularity, start, end)
70 # Get nearby weather stations
71 stations = Stations()
---> 72 stations = stations.nearby(self.lat, self.lon, self.radius)
73
74 # Guess altitude if not set

/usr/local/anaconda/lib/python3.6/site-packages/meteostat/stations.py in nearby(self, lat, lon, radius)
161 # Get distance for each stationsd
162 temp.stations['distance'] = temp.stations.apply(
--> 163 lambda station: distance(station, [lat, lon]), axis=1)
164
165 # Filter by radius

/usr/local/anaconda/lib/python3.6/site-packages/pandas/core/frame.py in setitem(self, key, value)
3042 else:
3043 # set column
-> 3044 self._set_item(key, value)
3045
3046 def _setitem_slice(self, key: slice, value):

/usr/local/anaconda/lib/python3.6/site-packages/pandas/core/frame.py in _set_item(self, key, value)
3119 self._ensure_valid_index(value)
3120 value = self._sanitize_column(key, value)
-> 3121 NDFrame._set_item(self, key, value)
3122
3123 # check if we are modifying a copy

/usr/local/anaconda/lib/python3.6/site-packages/pandas/core/generic.py in _set_item(self, key, value)
3577 except KeyError:
3578 # This item wasn't present, just insert at end
-> 3579 self._mgr.insert(len(self._info_axis), key, value)
3580 return
3581

/usr/local/anaconda/lib/python3.6/site-packages/pandas/core/internals/managers.py in insert(self, loc, item, value, allow_duplicates)
1196 value = _safe_reshape(value, (1,) + value.shape)
1197
-> 1198 block = make_block(values=value, ndim=self.ndim, placement=slice(loc, loc + 1))
1199
1200 for blkno, count in _fast_count_smallints(self.blknos[loc:]):

/usr/local/anaconda/lib/python3.6/site-packages/pandas/core/internals/blocks.py in make_block(values, placement, klass, ndim, dtype)
2742 values = DatetimeArray._simple_new(values, dtype=dtype)
2743
-> 2744 return klass(values, ndim=ndim, placement=placement)
2745
2746

/usr/local/anaconda/lib/python3.6/site-packages/pandas/core/internals/blocks.py in init(self, values, placement, ndim)
2398 values = np.array(values, dtype=object)
2399
-> 2400 super().init(values, ndim=ndim, placement=placement)
2401
2402 @Property

/usr/local/anaconda/lib/python3.6/site-packages/pandas/core/internals/blocks.py in init(self, values, placement, ndim)
129 if self._validate_ndim and self.ndim and len(self.mgr_locs) != len(self.values):
130 raise ValueError(
--> 131 f"Wrong number of items passed {len(self.values)}, "
132 f"placement implies {len(self.mgr_locs)}"
133 )

ValueError: Wrong number of items passed 9, placement implies 1`

Date column missing when fetching daily data

Unable to get the date column.
Below is the code:

# Import Meteostat library and dependencies
from datetime import datetime
import matplotlib.pyplot as plt
from meteostat import Point, Daily

# Set time period
start = datetime(2018, 1, 1)
end = datetime(2018, 12, 31)

# Create Point for Vancouver, BC
vancouver = Point(49.2497, -123.1193, 70)

# Get daily data for 2018
data = Daily(vancouver, start, end)
data = data.fetch()

print(data.columns)

Version = 1.6.1
Platform = Windows

Columns in the data: ['tavg', 'tmin', 'tmax', 'prcp', 'snow', 'wdir', 'wspd', 'wpgt', 'pres', 'tsun']

2 Issues: Getting data from the future and integrity of the datasets

1. ISSUE: Getting data from dates in the future.

Steps to reproduce:
While using the export function on the website for all historically hourly data for station ID 10488 in Dresden (atm till tomorrow). Same while using python (future dates till 2020-08-21)

"""define the periode for fetching"""
start = datetime(2021, 8, 1)
end = datetime(2021, 8, 31, 23, 59)
station = "10488"

"""Get hourly data"""
df_weatherdata = Hourly(station, start, end)
df_weatherdata = df_weatherdata.fetch()
df_weatherdata.reset_index(inplace=True)
df_weatherdata.rename(columns={"time": "datetime"}, inplace=True)
df_weatherdata=df_weatherdata.assign(id_national=station)
print(df_weatherdata)

Why can i query future data???

2. ISSUE: Integrity
There might be a problem with the quality of the data.

Download the historically hourly data for station ID 10488 in Dresden and search for: 2021-03-01 00:00:00
RESULT:
2020-03-01 00:00:00,8.0,2.0,66.0,0.0,0.0,230.0,25.9,44.0,998.9,0.0,4.0,01048

Steps to reproduce:
"""define the periode for fetching"""
start = datetime(2020, 3, 1)
end = datetime(2020, 5, 31, 23, 59)
station = "10488"

"""Get hourly data"""
df_weatherdata = Hourly(station, start, end)
df_weatherdata = df_weatherdata.fetch()
df_weatherdata.reset_index(inplace=True)
df_weatherdata.rename(columns={"time": "datetime"}, inplace=True)
df_weatherdata=df_weatherdata.assign(id_national=station)
print(df_weatherdata)

RESULT:
datetime,temp,dwpt,rhum,prcp,snow,wdir,wspd,wpgt,pres,tsun,coco,id_national
2020-03-01 00:00:00,7.7,1.3,64.0,0.0,0.0,220.0,27.4,44.0,998.9,0.0,4.0,10488
Compare the data from both datasets -> they differ completely

Get Hourly weather data for a list of dates

Hello,
Thank you for this useful tool. I have two questions :

  1. Is it possible to fetch Hourly weather data for a list of datetime for the same location as a bulk? For example, if I want to get Hourly data for the list [2019-05-01 19:00:00, 2019-05-08 19:00:00, 2019-05-15 19:00:00] for the same location.
  2. If I want to fetch the weather data at this specific time2019-05-01 19:00:00 for instance, Do the start date and the end date of the Hourly class have to have the same value (2019-05-01 19:00:00 here) ?

Thank you in advance !

Some station can not be fetched and return an empty dataframe

Issue: Some station id return an empty dataframe while using the python api. When checking using the website, data for the time frame 2020.03.01-2020.05.31 is avaiable. I checked following station using the sample code from: https://dev.meteostat.net/python/hourly.html

What I already noticed, sometimes WMO id or National id are used to fetch the data. But with those 5 stations an empty dataframe is always received.:

country,lon,lat,hight_m,station_name,id_wmo,id_national_1,id_national_2,id_icao,id_iata
Germany,13.4710,51.0063,285.00,Wilsdruff-Mohorn,,13654,13654,,
Tschechien,14.0333,50.6833,377.00,Usti Nad Labem,11502,11502,,,
Tschechien,13.9333,50.55,836.00,Milesovka,11464,11464,,,
Tschechien,14.1667,50.4667,158,Doksany,11509,11509,,,
Germany,14.2833,51.7667,68.00,Cottbus (Flugplatz),10492,10492,00879,ETHT,CBU

Steps to reproduce:

import pandas as pd
from datetime import datetime
from meteostat import Stations, Point, Hourly

stations = ["13654", "11502", "11464", "11509", "10492"]

for station in stations:
    """define the periode for fetching"""
    start = datetime(2020, 3, 1)
    end = datetime(2020, 5, 31, 23, 59)
    """Get hourly data and opt-out for model data"""
    df_weatherdata = Hourly(station, start, end, model=False)
    df_weatherdata = df_weatherdata.fetch()
    df_weatherdata.reset_index(inplace=True)
    """
    date,time in hour, temperature, dewpoint (Taupunkt), relative air humidity, rainfall, snow, wind direction, wind speed, peak wind speed, air pressure (NN), sonne in min, weather condition code
    "datetime","temp_degc","dwpt_degc","rhum_proz","prcp_mm","snow_mm","wdir_deg","wspd_km/h","wpgt_km/h","pres_hPa","tsun_min","coco","id_national"
    """
    df_weatherdata.rename(columns={"time": "datetime"}, inplace=True)
    df_weatherdata.rename(columns={"temp": "temp_degc"}, inplace=True)
    df_weatherdata.rename(columns={"dwpt": "dwpt_degc"}, inplace=True)
    df_weatherdata.rename(columns={"rhum": "rhum_proz"}, inplace=True)
    df_weatherdata.rename(columns={"prcp": "prcp_mm"}, inplace=True)
    df_weatherdata.rename(columns={"snow": "snow_mm"}, inplace=True)
    df_weatherdata.rename(columns={"wdir": "wdir_deg"}, inplace=True)
    df_weatherdata.rename(columns={"wspd": "wspd_km/h"}, inplace=True)
    df_weatherdata.rename(columns={"wpgt": "wpgt_km/h"}, inplace=True)
    df_weatherdata.rename(columns={"pres": "pres_hPa"}, inplace=True)
    df_weatherdata.rename(columns={"tsun": "tsun_min"}, inplace=True)
    df_weatherdata.rename(columns={"id_national": "datetime"}, inplace=True)
    df_weatherdata = df_weatherdata.assign(id_national=station)
    df_weatherdata = df_weatherdata.astype(
        {
            "datetime": "object",
            "temp_degc": "float64",
            "dwpt_degc": "float64",
            "rhum_proz": "float64",
            "prcp_mm": "float64",
            "snow_mm": "float64",
            "wdir_deg": "float64",
            "wspd_km/h": "float64",
            "wpgt_km/h": "float64",
            "pres_hPa": "float64",
            "tsun_min": "float64",
            "coco": "object",
            "id_national": "object",
        }
    )
    print("---------------------------------------------->")
    print(station)
    print(df_weatherdata)

Retrieved data does not correspond to hourly/daily/monthly_start/end values of station

Hi, I just found out about meteostat a few days ago and am excited to start playing with it for a project.

However I have run into this issue:

stations = Stations()
stations = stations.nearby(latitude, longitude) # arbitrary values that come from the frontend
station = stations.fetch(1)
print(station)
                             name country region  ... monthly_start monthly_end       distance
id                                                ...                                         
65660  Grand Bassa, Roberts Field      LR     MG  ...    1942-01-01  2021-01-01     290.650562

[1 rows x 16 columns]

As you can see, the monthly_start is in 1942 and monthly_end is in 2021.

But when I fetch the data, the rows that are retrieved to not correlate to the expected range.

data = Monthly(station['id']) # station id from above
data = data.fetch()
print(data)
            tavg  tmin  tmax   prcp  snow  wdir  wspd  wpgt    pres  tsun
time                                                                     
1969-08-01  25.1   NaN   NaN  561.0   NaN   NaN   NaN   NaN  1013.9   NaN
1969-09-01  25.6   NaN   NaN  447.0   NaN   NaN   NaN   NaN  1012.5   NaN
1970-01-01  26.5   NaN   NaN   10.0   NaN   NaN   NaN   NaN  1011.4   NaN
1970-02-01  27.1   NaN   NaN   26.0   NaN   NaN   NaN   NaN  1010.3   NaN
1970-03-01  27.7   NaN   NaN   99.0   NaN   NaN   NaN   NaN  1010.2   NaN
...          ...   ...   ...    ...   ...   ...   ...   ...     ...   ...
1996-09-01  25.5  21.6  29.3  590.0   NaN   NaN   NaN   NaN  1012.0   NaN
1996-10-01  26.1  21.7  30.5  285.0   NaN   NaN   NaN   NaN  1011.9   NaN
1996-12-01  27.1  21.8  32.3    3.0   NaN   NaN   NaN   NaN  1010.9   NaN
1997-02-01  28.2  21.1  35.3    0.0   NaN   NaN   NaN   NaN  1010.9   NaN
1997-03-01  28.5  21.7  35.3    1.0   NaN   NaN   NaN   NaN  1010.2   NaN

[266 rows x 10 columns]

This is only one example - I get similar inconsistent results for most requests.

Am I misunderstanding the meaning of the values such as monthly_start?

Inconsistency between manual daily average and Daily fetch

Hi!

First of all, thank you for making this amazing library available. It has been incredibly useful for my research!

I'm trying to get some temperature and humidity time series for my work. However, seeing that humidity min/max are not in the Daily class by default I decided to do the manual aggregation as described in #68. However, I get very different time series, at least in Python 3.85 with meteostat 1.6.0 and pandas 1.1.3.

Snippet:

from datetime import datetime
import matplotlib.pyplot as plt
from meteostat import Hourly, Stations, Daily

start = datetime(2007, 12,30)
end = datetime(2021, 12, 31)
lat, lon = 6.25, -75.5

stations = Stations()
station = stations.nearby(lat, lon).fetch(1)
data_daily = Daily(station, start, end, model = True).fetch()
data_agg = Hourly(station, start, end, timezone = "America/Bogota", model = True)
data_agg = data_agg.normalize().aggregate('1D').fetch()

fig = plt.figure()
plt.plot(data_daily.index.date, data_daily["tavg"].values, label = "Daily mean by Meteostat")
plt.plot(data_agg.index.date, data_agg["temp"].values, color = "black", label = "Daily mean calculated with aggregate", linewidth = 0.25)


plt.legend()

Any ideas on why this might be happening? FWIW, the default Daily output from meteostat seems more consistent but I don't really know what might be happening to cause both methods to output such different results.

Thank you so much in advance!

Problems with Hourly.normalize for the actual date for stations which do not have a WMO or ICAO tag

I realised a problem for stations not having an WMO / ICAO id when trying to retrieve hourly data for the actual date because of the following error message when executing data.index.tz_localize(None):

Traceback (most recent call last):
File "getweatherinfo1.py", line 34, in
dataIndex=data.index.tz_localize(None)
AttributeError: 'Index' object has no attribute 'tz_localize'
++++++++++++++++++++++++++++

with a code similar to:

from datetime import datetime

from meteostat import Stations, Hourly

stationId = 'D0312' # just a station which does not have WMO / ICAO id

date=datetime.today().date() # construct the datetime range for the current date
startString="{} 00:00:00".format(date)
endString="{} 23:59:00".format(date)
start = datetime.fromisoformat(startString)
end = datetime.fromisoformat(endString)

data = Hourly(stations=stationId, start=start, end=end, timezone='Europe/Berlin')
data = data.normalize()
data = data.interpolate()
data = data.fetch()
print(data)
dataIndex=data.index.tz_localize(None)
.....
+++++++++++++++++++++++++++++++++++

print(data) produces the following output:

                         temp      dwpt        rhum  prcp  snow   wdir       wspd  wpgt         pres  tsun  coco

time
2021-01-10 00:00:00+01:00 -0.700000 -1.000000 98.000000 0.0 NaN 264.0 6.800000 10.1 1025.300000 NaN NaN
2021-01-10 01:00:00+01:00 -0.300000 -0.400000 99.000000 0.0 NaN 260.0 6.800000 11.2 1025.100000 NaN NaN
2021-01-10 02:00:00+01:00 -0.400000 -0.700000 98.000000 0.0 NaN 246.0 11.200000 16.2 1025.100000 NaN NaN
2021-01-10 03:00:00+01:00 -1.200000 -1.200000 100.000000 0.0 NaN 240.0 10.100000 16.2 1024.900000 NaN NaN
2021-01-10 04:00:00+01:00 -1.500000 -1.500000 100.000000 0.0 NaN 239.0 10.100000 15.1 1024.700000 NaN NaN
2021-01-10 05:00:00+01:00 -1.000000 -1.000000 100.000000 0.0 NaN 236.0 14.400000 21.2 1024.500000 NaN NaN
2021-01-10 06:00:00+01:00 -0.800000 -1.600000 94.000000 0.0 NaN 227.0 13.700000 23.4 1024.400000 NaN NaN
2021-01-10 07:00:00+01:00 -1.500000 -2.100000 96.000000 0.0 NaN 213.0 10.400000 20.2 1024.300000 NaN NaN
2021-01-10 08:00:00+01:00 -2.100000 -2.500000 97.000000 0.0 NaN 224.0 15.100000 23.0 1024.400000 NaN NaN
2021-01-10 09:00:00+01:00 -2.200000 -3.000000 94.000000 0.0 NaN 213.0 14.400000 23.4 1024.500000 NaN NaN
2021-01-10 10:00:00+01:00 -2.100000 -3.200000 92.000000 0.0 NaN 216.0 16.200000 24.5 1024.600000 NaN NaN
2021-01-10 11:00:00+01:00 -1.500000 -2.900000 90.000000 0.0 NaN 221.0 18.000000 27.7 1024.500000 NaN NaN
2021-01-10 12:00:00+01:00 -0.800000 -2.400000 89.000000 0.0 NaN 219.0 19.100000 29.2 1024.000000 NaN NaN
2021-01-10 13:00:00+01:00 -0.200000 -1.800000 89.000000 0.0 NaN 231.0 21.600000 32.8 1023.600000 NaN NaN
2021-01-10 13:00:00+00:00 -0.033333 -1.533333 89.666667 0.0 NaN 233.0 20.283333 32.8 1023.083333 NaN NaN
2021-01-10 14:00:00+00:00 0.133333 -1.266667 90.333333 0.0 NaN 235.0 18.966667 32.8 1022.566667 NaN NaN
2021-01-10 15:00:00+00:00 0.300000 -1.000000 91.000000 0.0 NaN 237.0 17.650000 32.8 1022.050000 NaN NaN
2021-01-10 16:00:00+00:00 0.466667 -0.733333 91.666667 NaN NaN 239.0 16.333333 NaN 1021.533333 NaN NaN
2021-01-10 17:00:00+00:00 0.633333 -0.466667 92.333333 NaN NaN 241.0 15.016667 NaN 1021.016667 NaN NaN
2021-01-10 19:00:00+01:00 0.800000 -0.200000 93.000000 NaN NaN 243.0 13.700000 NaN 1020.500000 NaN NaN
2021-01-10 19:00:00+00:00 0.800000 -0.200000 93.000000 NaN NaN 243.0 13.700000 NaN 1020.500000 NaN NaN
2021-01-10 20:00:00+00:00 0.800000 -0.200000 93.000000 NaN NaN 243.0 13.700000 NaN 1020.500000 NaN NaN
2021-01-10 21:00:00+00:00 0.800000 -0.200000 93.000000 NaN NaN 243.0 13.700000 NaN 1020.500000 NaN NaN
2021-01-10 22:00:00+00:00 NaN NaN NaN NaN NaN NaN NaN NaN NaN NaN NaN
++++++++++++++++++++++++++++++++++++++++++++++
The data.normilze() method has filled some gaps in the hourly data for this station but the time is UTC for those rows being added. Furthermore in the last row no data are filled.

Without data.normalize() and data.interpolate() no traceback dump will be produced by executing data.index.tz_localize(None) but then there a gaps in the hourly data.

Consider splitting hourly data dumps into annual chunks

Currently, the Meteostat bulk data interface provides two data dumps per weather station - one for daily and one for hourly records. Especially the processing of hourly dumps takes multiple seconds for common tasks. Splitting hourly dumps into multiple chunks, e.g. one per year, could improve performance.

Set model=False as default for daily and monthly data

I think that the model parameter should have False as default value in the Daily and Monthly classes.

I'm pretty sure that most of the people looking for Daily or Monthly data will be interested in having the "real" data with no interpolation and will be confused to see that by calling the class without arguments you get a different result as in the web interface.

Getting no data for some Points

I am not getting any reply for some points using point and fetch. How can I check what the error is?

--# Get hourly data
data = Hourly(point1, start, end, timezone='America/Chicago')
df = data.fetch()

How do I change the radius in this?

Hourly crashes when selected station does not provide hourly data

If a station Id, for which no hourly data exist (e.g. ...09161, 09177, 09186... selected from full.json), is used in e.g.
data = Hourly(stations=stationId, start=start, end=end, timezone='Europe/Berlin')
Hourly crashes, with producing this traceback dump:

+++++++++++++++++++++++++++++++++++++
Traceback (most recent call last):
File "/usr/local/lib/python3.7/site-packages/meteostat/hourly.py", line 168, in init
self._get_data(self._stations)
File "/usr/local/lib/python3.7/site-packages/meteostat/hourly.py", line 122, in _get_data
'UTC', level='time').tz_convert(
File "/usr/local/lib/python3.7/site-packages/pandas/core/generic.py", line 9650, in tz_localize
ax = ax.set_levels(new_level, level=level)
File "/usr/local/lib/python3.7/site-packages/pandas/core/indexes/multi.py", line 830, in set_levels
if is_list_like(levels[0]):
File "/usr/local/lib/python3.7/site-packages/pandas/core/indexes/extension.py", line 215, in getitem
result = self._data[key]
File "/usr/local/lib/python3.7/site-packages/pandas/core/arrays/datetimelike.py", line 538, in getitem
result = self._data[key]
IndexError: index 0 is out of bounds for axis 0 with size 0

The above exception was the direct cause of the following exception:

Traceback (most recent call last):
File "t.py", line 18, in
data = Hourly(stations=stationId, start=start, end=end, timezone='Europe/Berlin')
File "/usr/local/lib/python3.7/site-packages/meteostat/hourly.py", line 170, in init
raise Exception('Cannot read hourly data') from read_error
Exception: Cannot read hourly data`
+++++++++++++++++++++++++++++++

It would be good if in such a case an empty frame would be returned which could be handled via the data.empty method.

TypeError: __init__() got an unexpected keyword argument 'lat'

Running example on Python 3.85.

from datetime import datetime
import matplotlib.pyplot as plt
from meteostat import Stations, Daily

Get weather stations ordered by distance to Vancouver, BC

stations = Stations(lat = 49.2497, lon = -123.1193, daily = datetime(2018, 1, 1))

Fetch closest station (limit = 1)

station = stations.fetch(1)


TypeError Traceback (most recent call last)
in
1 # Get weather stations ordered by distance to Vancouver, BC
----> 2 stations = Stations(lat = 49.2497, lon = -123.1193, daily = datetime(2018, 1, 1))
3 # Fetch closest station (limit = 1)
4 station = stations.fetch(1)

TypeError: init() got an unexpected keyword argument 'lat'

โ€‹

Since late last night, I started getting errors running the python package for Meteosat with both my own code and with the sample code when the output of the point() function is used to call the Daily() or Hourly() functions.

Set time period

start = datetime(2018, 1, 1)
end = datetime(2018, 12, 31)

Create Point for Vancouver, BC

vancouver = Point(49.2497, -123.1193, 70)

Get daily data for 2018

data = Daily(vancouver, start, end)
data = data.fetch()


TypeError Traceback (most recent call last)
in
12
13 # Get daily data for 2018
---> 14 data = Daily(vancouver, start, end)
15 data = data.fetch()
16

~\anaconda3\lib\site-packages\meteostat\daily.py in init(self, loc, start, end)
231 self._stations = loc.index
232 elif isinstance(loc, Point):
--> 233 stations = loc.get_stations('hourly', start, end)
234 self._stations = stations.index
235 else:

~\anaconda3\lib\site-packages\meteostat\point.py in get_stations(self, granularity, start, end)
77
78 # Apply inventory filter
---> 79 stations = stations.inventory(granularity, (start, end))
80
81 # Apply altitude filter

~\anaconda3\lib\site-packages\meteostat\stations.py in inventory(self, granularity, required)
238 temp._stations = temp._stations[
239 (pd.isna(temp._stations[granularity + '_start']) == False) &
--> 240 (temp._stations[granularity + '_start'] <= required[0]) &
241 (
242 temp._stations[granularity + '_end'] +

~\anaconda3\lib\site-packages\pandas\core\ops\common.py in new_method(self, other)
63 other = item_from_zerodim(other)
64
---> 65 return method(self, other)
66
67 return new_method

~\anaconda3\lib\site-packages\pandas\core\arraylike.py in le(self, other)
39 @unpack_zerodim_and_defer("le")
40 def le(self, other):
---> 41 return self._cmp_method(other, operator.le)
42
43 @unpack_zerodim_and_defer("gt")

~\anaconda3\lib\site-packages\pandas\core\series.py in _cmp_method(self, other, op)
4976 rvalues = extract_array(other, extract_numpy=True)
4977
-> 4978 res_values = ops.comparison_op(lvalues, rvalues, op)
4979
4980 return self._construct_result(res_values, name=res_name)

~\anaconda3\lib\site-packages\pandas\core\ops\array_ops.py in comparison_op(left, right, op)
241
242 elif is_object_dtype(lvalues.dtype):
--> 243 res_values = comp_method_OBJECT_ARRAY(op, lvalues, rvalues)
244
245 else:

~\anaconda3\lib\site-packages\pandas\core\ops\array_ops.py in comp_method_OBJECT_ARRAY(op, x, y)
53 result = libops.vec_compare(x.ravel(), y.ravel(), op)
54 else:
---> 55 result = libops.scalar_compare(x.ravel(), y, op)
56 return result.reshape(x.shape)
57

pandas_libs\ops.pyx in pandas._libs.ops.scalar_compare()

TypeError: '<=' not supported between instances of 'str' and 'datetime.datetime'

Evaluate SQLite Caching

Meteostat currently stores cached data dumps in Feather file format. Before a final release of version 1.0 we should evaluate if there is a better approach for caching data. I believe SQLite could improve performance when querying weather data for multiple stations as we don't have to load full dumps into Pandas.

I'll try to provide some benchmarks in the upcoming weeks.

Exception: Cannot read weather station directory

i am using the meteostat python API from the google colab interface. After the new update when i try to execute the command "stations = Stations(lat = 37.983810,lon = 23.727539)" i get the exception "Cannot read weather station directory". the Stations._cache_dir is "/root/.meteostat/cache". There is a root folder on Google colab but it is empty. If i try to manually create this folder it fails because of the dot at the start of meteostat i think. I set the Stations._cache_dir = '/root/meteostat/cache' and after running it it created the folders with the stations folder inside but it was empty and i got the same exception. Is there anything i can do to fix this or anything i am doing wrong?
Thank you in advance

Wrong endpoint creation

Dear @clampr,

I run into following issue:

from datetime import datetime
from meteostat import Point, Hourly

dt_start = datetime(2021, 10, 1),
dt_end = datetime(2021, 10, 10),
data=Hourly(Point(53.2811, 13.8583, 100), dt_start, dt_end)
data.fetch()

I receive the following Warning and an empty dataframe:

Warning: Cannot load hourly/full/2021/10286.csv.gz from https://bulk.meteostat.net/v2/

I have checked out that the code runs If I manually download the file via the path without 2021/ :

curl "https://bulk.meteostat.net/v2/hourly/full/10286.csv.gz" --output "10286.csv.gz"

Afterwards the code runs without Warning and as expected.

Btw.: Nice API.

Add Time Zone Support

The Hourly class should be extended with a feature which allows users to specify a time zone. Based on the time zone the library should adapt the period and translate the datetime of each record into the respective time zone.

stations.region() does not return every station for a specific region

Hello,

I currently am switching from bulkdownloads to meteostat and it makes life much easier.
Unfortunately i encountered a small issue by accident.

If i use the .region-Function the state "Nordrhein-Westfalen" has 4 Stations.
`from meteostat import Stations

stations = Stations()
stations = stations.region('DE', 'NW')
print(stations.count())
`

by plotting the stations, combined with a shapefile of the region it looks like this.
grafik

In comparison i plotted Germany, again with the data i got via .regions-Function and NW has more than 4 Stations.
`from meteostat import Stations

stations = Stations()
stations = stations.region('DE', None)
print(stations.count())
`
grafik
Edit: highlighted the state by removing the other states.

Python Kernel Crash

Hi,
i just tried an little example:

from datetime import datetime
import matplotlib.pyplot as plt
from meteostat import Stations, Daily

# Time period
start = datetime(2018, 1, 1)
end = datetime(2018, 12, 31)

# Get a weather station
stations = Stations()
stations = stations.nearby(49.2497, -123.1193)

on Windows 10, Python 3.8.5 -- IPython 7.19.0 (in Spyder 4.1.5) and the Python Kernel Crashes:

Kernel wird neu gestartet... 
Populating the interactive namespace from numpy and matplotlib
[SpyderKernelApp] WARNING | No such comm: 03c8b35f3aec11ebb031b8ca3a73ea1a

Have you any idea what's maybe wrong ?

Weather data at regular intervals

Disclaimer: I am proposing this enhancement in large part because it would be useful for a personal project that I am currently working on.

For example: a client wishes to obtain daily weather data at Frankfurt Airport for every weekend day in the year 2020.

Currently, they would have to either make 52 different queries (one for each weekend), or make a single query that would return data for every day of the year.

I would like to propose an additional method for the Daily and Hourly classes that would allow the client to specify a 'timespan' (in the above case, this would be 2 days) and a 'gap' (in the above case, this would be 5 days) before fetching the dataframe.

The result might look like this:

from datetime import datetime
from meteostat import Stations, Daily

start = datetime(2020, 1, 4)
end = datetime(2020, 12, 31)

data = Daily('10637', start=start, end=end)
data = data.interval('2D', '5D')
data = data.fetch()

#data contains only 104 rows

As for use cases (in addition to my aforementioned project), I could see this feature being useful for comparing weather data year-on-year, or possibly tracking seasonal changes in the weather.

Add Min, Avg & Max humidity in Daily()

Hi everyone,

I love using the Python Meteostat API for getting access to meteo data through Daily() function. Unfortunately, Daily() doesn't include Min, average and Max humidity but Hourly() have humidity data.

Today, if i want to get the min, avg and max humidity data, i have to use Hourly() in order to have the 24 hours data for extract the min, avg and the max data of humidity of the day.

Python code:
hourly_data = Hourly(location, start_date, end_date)
min_humidity = hourly_data.dict['_data']['rhum'].min()
avg_humidity = hourly_data.dict['_data']['rhum'].avg()
max_humidity = hourly_data.dict['_data']['rhum'].max()

Daily() documentation: https://dev.meteostat.net/python/daily.html#api
Hourly() documentation: https://dev.meteostat.net/python/hourly.html#api

Is it possible to add min, avg and max humidity directly in Hourly() result ?

Thank you

Allow Bypassing of Cache

Currently, Meteostat always creates a local copy of the required bulk data, even if max_age is set to 0. These files are stored in Apache Parquet format.

However, it seems that PyArrow, which is used for writing/reading Parquet files, is causing errors in some environments (#8).

I propose we directly return a DataFrame once a file is loaded from bulk.meteostat.net and only store the file locally if max_age is > 0. This would allow memory-only processing of Meteostat data and it's a workaround for PyArrow.

Getting ImportError with the provided example

I'm just trying to run the example code from the documentation and I'm running into an ImportError from the first meteostat module call (Point).

ImportError: cannot import name 'Point' from partially initialized module 'meteostat' (most likely due to a circular import) (c:\git\NOAA Weather\meteostat.py)

Any ideas what might be causing this?

For context I'm running:
python 3.8.2
conda 4.8.3

I've tried uninstalling/reinstalling with the provided documentation (pip install meteostat) to no effect.

The Method _load of class Core may return different types of values

When running the method "load" of the Class Core without the "paths" argument, it returns False instead of an empty list.
As far as i can tell, this is bad practice, since a list is not a boolean and a function should return values of one type.

My suggestion for improvement would be to remove the line "return false" from this code.

Sincerely,
Aaron

data type "string" not understood on python package

I am having trouble punning the python package for meteostat, with both my own code, and with the sample code. This is on meteostat 1.1.1 on pandas 1.1.5.

Here is what I'm trying to run:

`# Import Meteostat library and dependencies
from datetime import datetime
import matplotlib.pyplot as plt
from meteostat import Point, Daily

Set time period

start = datetime(2018, 1, 1)
end = datetime(2018, 12, 31)

Create Point for Vancouver, BC

vancouver = Point(49.2497, -123.1193, 70)

Get daily data for 2018

data = Daily(vancouver, start, end)
data = data.fetch()

Plot line chart including average, minimum and maximum temperature

data.plot(y=['tavg', 'tmin', 'tmax'])
plt.show()`

This is the error it's returning

`---------------------------------------------------------------------------
TypeError Traceback (most recent call last)
in
12
13 # Get daily data for 2018
---> 14 data = Daily(vancouver, start, end)
15 data = data.fetch()
16

/usr/local/anaconda/lib/python3.6/site-packages/meteostat/daily.py in init(self, loc, start, end)
231 self._stations = loc.index
232 elif isinstance(loc, Point):
--> 233 stations = loc.get_stations('hourly', start, end)
234 self._stations = stations.index
235 else:

/usr/local/anaconda/lib/python3.6/site-packages/meteostat/point.py in get_stations(self, granularity, start, end)
69
70 # Get nearby weather stations
---> 71 stations = Stations()
72 stations = stations.nearby(self.lat, self.lon, self.radius)
73

/usr/local/anaconda/lib/python3.6/site-packages/meteostat/stations.py in init(self)
103
104 # Get all weather stations
--> 105 self._load()
106
107 # Clear cache

/usr/local/anaconda/lib/python3.6/site-packages/meteostat/stations.py in _load(self)
88 self._columns,
89 self._types,
---> 90 self._parse_dates)
91
92 # Add index

/usr/local/anaconda/lib/python3.6/site-packages/meteostat/core.py in _load_handler(self, path, columns, types, parse_dates)
122 names=columns,
123 dtype=types,
--> 124 parse_dates=parse_dates)
125
126 except HTTPError:

/usr/local/anaconda/lib/python3.6/site-packages/pandas/io/parsers.py in parser_f(filepath_or_buffer, sep, delimiter, header, names, index_col, usecols, squeeze, prefix, mangle_dupe_cols, dtype, engine, converters, true_values, false_values, skipinitialspace, skiprows, nrows, na_values, keep_default_na, na_filter, verbose, skip_blank_lines, parse_dates, infer_datetime_format, keep_date_col, date_parser, dayfirst, iterator, chunksize, compression, thousands, decimal, lineterminator, quotechar, quoting, escapechar, comment, encoding, dialect, tupleize_cols, error_bad_lines, warn_bad_lines, skipfooter, doublequote, delim_whitespace, low_memory, memory_map, float_precision)
676 memory_map=memory_map,
677 float_precision=float_precision,
--> 678 na_filter=na_filter,
679 delim_whitespace=delim_whitespace,
680 warn_bad_lines=warn_bad_lines,

/usr/local/anaconda/lib/python3.6/site-packages/pandas/io/parsers.py in _read(filepath_or_buffer, kwds)
438 )
439 kwds["compression"] = compression
--> 440
441 if kwds.get("date_parser", None) is not None:
442 if isinstance(kwds["parse_dates"], bool):

/usr/local/anaconda/lib/python3.6/site-packages/pandas/io/parsers.py in init(self, f, engine, **kwds)
785
786 Parameters
--> 787 ----------
788 filepath_or_buffer : str, path object or file-like object
789 Any valid string path is acceptable. The string could be a URL. Valid

/usr/local/anaconda/lib/python3.6/site-packages/pandas/io/parsers.py in _make_engine(self, engine)
1012
1013 sep = options["delimiter"]
-> 1014 delim_whitespace = options["delim_whitespace"]
1015
1016 # C engine not supported yet

/usr/local/anaconda/lib/python3.6/site-packages/pandas/io/parsers.py in init(self, src, **kwds)
1706
1707 to_remove = []
-> 1708 index = []
1709 for idx in self.index_col:
1710 i = ix(idx)

pandas/_libs/parsers.pyx in pandas._libs.parsers.TextReader.cinit()

/usr/local/anaconda/lib/python3.6/site-packages/pandas/core/dtypes/common.py in pandas_dtype(dtype)

TypeError: data type "string" not understood`

Cannot use .bounds().fetch() with the latest version

I tried to update meteostat to the latest version but when using .bounds().fetch() I always get an empty dataframe. I was able to solve only by going back to 1.2.2. Is this a bug or are there maybe some temporary files/cache files hanging around somewhere? :)

stations = Stations()
stations = stations.bounds((65, -135), (22, -83))
list_stations = stations.fetch()
list_stations.head()

Which Parameters Matter Most?

Hi all,

Meteostat supports certain parameters on the Hourly, Daily and Monthly interface which were chosen by myself because I thought they are of common interest. I know that, depending on your use case, you may need different data parameters.

To get an overview of the most-requested parameters for the different interfaces, I would like to get your opinion on what should be included or removed in the future. Please keep in mind that we cannot keep adding more and more parameters as this would lead to a regression of performance. Therefore, we won't be able to support edge cases.

Ideally, I would like to limit the number of parameters to a maximum of 15 by interface. Please vote for your favourites by adding a comment. The checked options are currently included in the respective dumps/interfaces.

Hourly Data

Hourly data is the highest resolution Meteostat offers. We can only include parameters which are widely supported by our data sources.

  • Air temperature (temp)
  • Dew point (dwpt)
  • Relative humidity (rhum)
  • Precipitation total of previous hour (prcp)
  • Snow depth (snow)
  • Wind direction degrees (wdir)
  • Average wind speed of previous hour (wspd)
  • Maximum wind gust of previous hour (wpgt)
  • Sea-level air pressure (pres)
  • Sunshine total of previous hour (tsun)
  • Solar radiation total of previous hour
  • Weather condition code (coco)

We could remove either dwpt or rhum (either can be calculated from the other & air temperature) from the dumps (not from the interface) to reduce the dump size.

Daily Data

  • Average daily air temperature (tavg)
  • Minimum daily air temperature (tmin)
  • Maximum daily air temperature (tmax)
  • Average daily relative humidity
  • Minimum daily relative humdity
  • Maximum daily relative humidity
  • Daily precipitation total (prcp)
  • Maximum daily snow depth (snow)
  • Average daily wind direction (wdir)
  • Average daily wind speed (wspd)
  • Maximum daily wind gust (wpgt)
  • Average daily sea-level air pressure (pres)
  • Daily sunshine total (tsun)
  • Daily solar radiation total

Monthly Data

  • Average monthly air temperature (tavg)
  • Average daily minimum air temperature (tmin)
  • Average daily maximum air temperature (tmax)
  • Absolute monthly minimum air temperature
  • Absolute monthly maximum air temperature
  • Monthly precipitation total (prcp)
  • Maximum monthly snow depth (snow)
  • Average monthly wind direction (wdir)
  • Average monthly wind speed (wspd)
  • Maximum monthly wind gust (wpgt)
  • Average monthly sea-level air pressure (pres)
  • Monthly sunshine total (tsun)
  • Monthly solar radiation total

This is awesome! But how to efficiently query lots of data?

I really don't know how I didn't discover this API before...I was really looking for a European-aggregated database for weather observation. This is just awesome :D

I would like to make a map of daily tmax in Europe so I just tried to use bounds followed by a fetch

stations = Stations()
stations = stations.bounds((70, -25), (30, 50))
list_stations = stations.fetch()
start = datetime(2021, 5, 1)
end = datetime(2021, 5, 2)
data = Daily(list_stations, start, end)
data = data.fetch()

This is obviously taking a long time as from the code it seems it is querying individually every csv and extracting info to reconstruct the output df.

Is there a better way to obtain daily data over an area? Seems that all endpoints only support querying data by station ID which means that they will also work with a list but likely iterate over it.

Thanks again for making this lib available to everyone :)

ImportError: cannot import name 'Point'

I have used this package before but this time when I try to import 'Point' it says
ImportError: cannot import name 'Point'... (I am using the Vancouver example)

Add Linter

Before the first stable release, a proper Python linter should be added to the project and all components of the library should be adjusted accordingly.

Imputation performs worse!

Hey everyone,

Thanks for your work, I really like it. The package is very user-friendly and easy to follow. However I have just noticed some strange behaviors when I took a query of Hourly data. I directly show my results and the exact latitude and longitude I used.

!pip install meteostat -q
from datetime import datetime, timedelta
import matplotlib.pyplot as plt
from meteostat import Point, Hourly, Daily

LAT, LON = 36.268548, 50.008506 # this is the exact location of Alborz shopping mall

# Set time period
start = datetime(2018, 1, 1, 0, 0)
end = datetime(2022, 5, 23, 23, 59)

qazvin = Point(LAT, LON)

hourly_data = Hourly(qazvin, start, end)

# hourly_data = hourly_data.normalize()
# hourly_data = hourly_data.interpolate()

hourly_data = hourly_data.fetch()

round(hourly_data.isnull().sum() / hourly_data.shape[0] * 100, 2)
>>> 
temp      0.57
dwpt      0.57
rhum      0.57
prcp     75.07
snow    100.00
wdir      3.78
wspd      1.49
wpgt    100.00
pres      1.99
tsun    100.00
coco     92.37
dtype: float64

While running after uncommenting both normalization and interpolation, it output:

>>>
temp      8.91
dwpt      8.91
rhum      8.91
prcp     77.27
snow    100.00
wdir      8.91
wspd      8.91
wpgt    100.00
pres      8.91
tsun    100.00
coco     83.82
dtype: float64

Why is this happening?

KeyError: 'distance'

I have been using the meteostat Python package for a few months now as part of my thesis and this is the first time i run my project after your last update. When i try to get the stations nearby a location i get the error "KeyError: 'distance'". I tried pip install meteostat -U but it did not solve the issue and i have to present my thesis in a month...
This is the code i am running:

stations = Stations()
stations = stations.nearby(coordinates_df[cntry]["Lat"], coordinates_df[cntry]["Long"])
station = stations.fetch(1)
data = Hourly(station, start = confirmed_df.index[0].to_pydatetime() - datetime.timedelta(days=14), end = confirmed_df.index[confirmed_df.index.shape[0]-1].to_pydatetime() + datetime.timedelta(days=1))
data = data.fetch()

When i run this code this is what i get:


KeyError Traceback (most recent call last)
c:\users\george vangelatos\appdata\local\programs\python\python39\lib\site-packages\pandas\core\indexes\base.py in get_loc(self, key, method, tolerance)
3079 try:
-> 3080 return self._engine.get_loc(casted_key)
3081 except KeyError as err:

pandas_libs\index.pyx in pandas._libs.index.IndexEngine.get_loc()

pandas_libs\index.pyx in pandas._libs.index.IndexEngine.get_loc()

pandas_libs\hashtable_class_helper.pxi in pandas._libs.hashtable.PyObjectHashTable.get_item()

pandas_libs\hashtable_class_helper.pxi in pandas._libs.hashtable.PyObjectHashTable.get_item()

KeyError: 'distance'

The above exception was the direct cause of the following exception:

KeyError Traceback (most recent call last)
c:\users\george vangelatos\appdata\local\programs\python\python39\lib\site-packages\pandas\core\generic.py in _set_item(self, key, value)
3825 try:
-> 3826 loc = self._info_axis.get_loc(key)
3827 except KeyError:

c:\users\george vangelatos\appdata\local\programs\python\python39\lib\site-packages\pandas\core\indexes\base.py in get_loc(self, key, method, tolerance)
3081 except KeyError as err:
-> 3082 raise KeyError(key) from err
3083

KeyError: 'distance'

During handling of the above exception, another exception occurred:

ValueError Traceback (most recent call last)
in
----> 1 greece_full = createCovidDataFrame("Greece")
2 greece_full

in createCovidDataFrame(cntry)
794
795 stations = Stations()
--> 796 stations = stations.nearby(coordinates_df[cntry]["Lat"], coordinates_df[cntry]["Long"])
797 station = stations.fetch(1)
798

c:\users\george vangelatos\appdata\local\programs\python\python39\lib\site-packages\meteostat\stations.py in nearby(self, lat, lon, radius)
160
161 # Get distance for each stationsd
--> 162 temp.stations['distance'] = temp.stations.apply(
163 lambda station: distance(station, [lat, lon]), axis=1)
164

c:\users\george vangelatos\appdata\local\programs\python\python39\lib\site-packages\pandas\core\frame.py in setitem(self, key, value)
3161 else:
3162 # set column
-> 3163 self._set_item(key, value)
3164
3165 def _setitem_slice(self, key: slice, value):

c:\users\george vangelatos\appdata\local\programs\python\python39\lib\site-packages\pandas\core\frame.py in _set_item(self, key, value)
3241 self._ensure_valid_index(value)
3242 value = self._sanitize_column(key, value)
-> 3243 NDFrame._set_item(self, key, value)
3244
3245 # check if we are modifying a copy

c:\users\george vangelatos\appdata\local\programs\python\python39\lib\site-packages\pandas\core\generic.py in _set_item(self, key, value)
3827 except KeyError:
3828 # This item wasn't present, just insert at end
-> 3829 self._mgr.insert(len(self._info_axis), key, value)
3830 return
3831

c:\users\george vangelatos\appdata\local\programs\python\python39\lib\site-packages\pandas\core\internals\managers.py in insert(self, loc, item, value, allow_duplicates)
1201 value = safe_reshape(value, (1,) + value.shape)
1202
-> 1203 block = make_block(values=value, ndim=self.ndim, placement=slice(loc, loc + 1))
1204
1205 for blkno, count in _fast_count_smallints(self.blknos[loc:]):

c:\users\george vangelatos\appdata\local\programs\python\python39\lib\site-packages\pandas\core\internals\blocks.py in make_block(values, placement, klass, ndim, dtype)
2730 values = DatetimeArray._simple_new(values, dtype=dtype)
2731
-> 2732 return klass(values, ndim=ndim, placement=placement)
2733
2734

c:\users\george vangelatos\appdata\local\programs\python\python39\lib\site-packages\pandas\core\internals\blocks.py in init(self, values, placement, ndim)
140
141 if self._validate_ndim and self.ndim and len(self.mgr_locs) != len(self.values):
--> 142 raise ValueError(
143 f"Wrong number of items passed {len(self.values)}, "
144 f"placement implies {len(self.mgr_locs)}"

ValueError: Wrong number of items passed 9, placement implies 1

Weathers' element

As a quick search in your nice tool, I didn't find How is it possible to get the other elements such as precipitations, or wind?,

And, Does this tool cover all the world weathers' stations?

Recommend Projects

  • React photo React

    A declarative, efficient, and flexible JavaScript library for building user interfaces.

  • Vue.js photo Vue.js

    ๐Ÿ–– Vue.js is a progressive, incrementally-adoptable JavaScript framework for building UI on the web.

  • Typescript photo Typescript

    TypeScript is a superset of JavaScript that compiles to clean JavaScript output.

  • TensorFlow photo TensorFlow

    An Open Source Machine Learning Framework for Everyone

  • Django photo Django

    The Web framework for perfectionists with deadlines.

  • D3 photo D3

    Bring data to life with SVG, Canvas and HTML. ๐Ÿ“Š๐Ÿ“ˆ๐ŸŽ‰

Recommend Topics

  • javascript

    JavaScript (JS) is a lightweight interpreted programming language with first-class functions.

  • web

    Some thing interesting about web. New door for the world.

  • server

    A server is a program made to process requests and deliver data to clients.

  • Machine learning

    Machine learning is a way of modeling and interpreting data that allows a piece of software to respond intelligently.

  • Game

    Some thing interesting about game, make everyone happy.

Recommend Org

  • Facebook photo Facebook

    We are working to build community through open source technology. NB: members must have two-factor auth.

  • Microsoft photo Microsoft

    Open source projects and samples from Microsoft.

  • Google photo Google

    Google โค๏ธ Open Source for everyone.

  • D3 photo D3

    Data-Driven Documents codes.