Giter VIP home page Giter VIP logo

crypto-whale-watching-app's Introduction

Introduction

Welcome! This is a Python-based Dash app meant to track whale activity in buy / sell walls on crypto-currency exchanges (presently just operational for GDAX, but more exchanges to come). This document aims to explain the purpose, functionality, and future of this project. Please do share this with your fellow coders / traders / crypto-aficionados, and contribute to the future of this project by calling out issues, requesting new features, and submitting pull requests to improve the app.

The newest version of this app is quite computationally intense, and as such, it is recommended that the new version be run locally pursuant to the instructions below. If this version gives you trouble at all, a less computationally-intense earlier version of the app can be found at this commit version here, and thanks to a generous member of the community, is hosted online here.

If anyone has questions about the app, feel free to reach out to open an issue.

Scroll down to the How-To / User Guide section to learn more about how to run the app yourself. The most recent updates to the app include new features like an improved depth chart (shown in the screenshot below), as well as a side-menu that allows selective hiding / showing of various pairs of interest.

First UI View

What's the point of this app?

Presently, GDAX allows users to see the buy and sell limit order volume via the "depth chart" shown below.

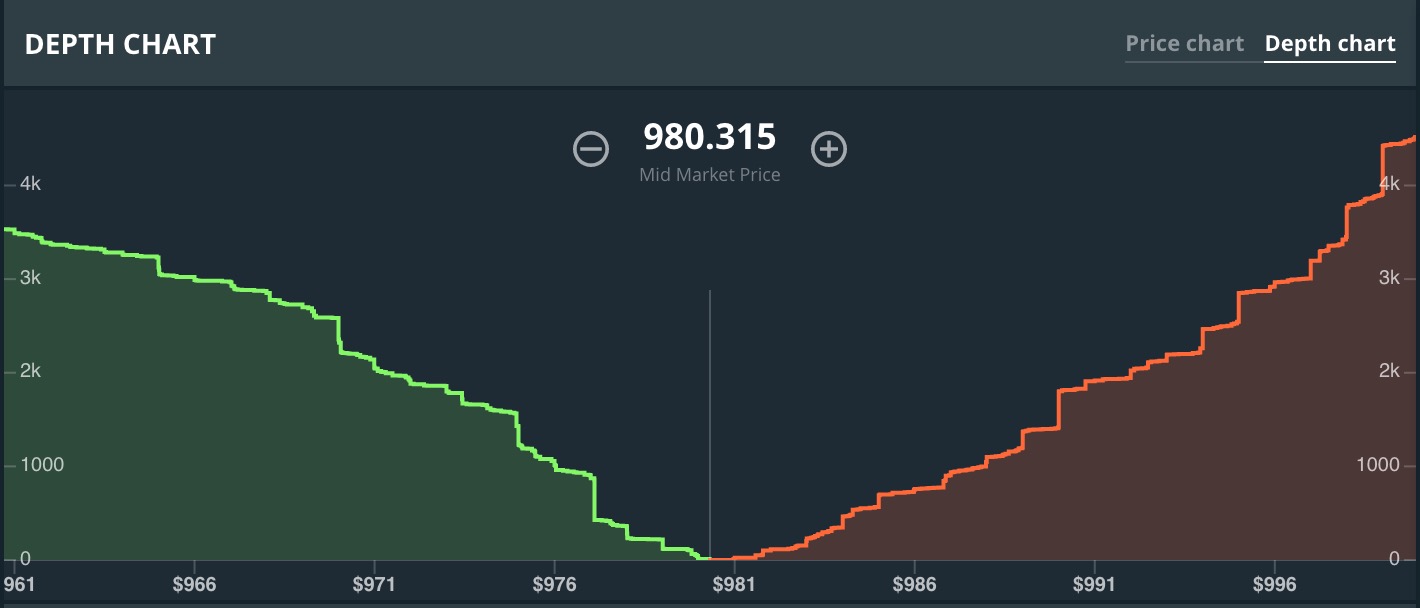
The problem with this is that the depth chart does not tell us where the volume behind buy and sell walls is coming from. It could be from a few whales seeking to manipulate the market, or it could be from a large number of individuals who have placed orders around a modal point. In technical terms, there is no way to see how much of present resistance or support levels are due to individuals vs. group clustering.

This difference is quite important, as it impacts how quickly walls can be pulled, etc., so having buy & sell-wall information at the order level can prove quite valuable for traders. This simple app allows you to access just that information, by focusing on individual limit orders that constitute large walls, and particularly emphasizing the largest orders, enabling the user to spot whales that may be manipulating the present price via various methods. How exactly we define / spot whale activity is the focus of the next section.

How to spot a whale:

This is perhaps the most important question when it comes to the purpose of this app. We have iterated on this many times, and have arrived at an algorithmic definition that spots 2 types of whales:

  • Single Price-Point Whales:
    • Place one large order at a single price-point
    • Example: 500 ETH for sale at $1000 via 1 unique order
    • Represented via a bubble in the visualization.
    • Tooltip includes order price-point, volume, and number of unique orders
  • Ladder Price-Point Whales:
    • Place many medium-sized orders for identical volume increasing in price
    • Example: 500 total ETH for sale starting at $900 and spanning until $1000 via 10 unique 50-ETH orders
    • Represented via a line bar spanning the range of the ladder
    • Tooltip includes number and volume of orders, price-range of ladder, and total volume

While these two may seem different, their market impacts are often comparable. I think a real world analogy helps to illustrate this point:

Imagine that you are looking to understand if there is any whale activity at your local coffee shop (I know this is silly but I promise it is a good example; stay with me here). You could sit near the ordering area and write down each individual order. If someone comes along and orders 100 lattes, that would get your attention--you have spotted a whale! What if, however, someone was ordering 5 lattes, and then getting in the back of the line again, and ordering another 5 lattes, repeating this until they had purchased a total of 100 lattes? Both of these individuals had a whale-like impact on market movement, but if all you care about is the size of each individual order, you will miss out on the sneaky whales that may be splitting their orders across a ladder of price-points.

Given that GDAX's API doesn't display ETH addresses (only unique order IDs), we cannot say with 100% certainty that what looks like a "ladder price-point whale" is in fact a unitary actor. We have to make some assumptions. To continue the coffee shop metaphor, we aren't able to actually look at the people in line for coffee; instead, we have a blindfold on and are jotting down what we hear the barista say. We hear "1 order for 5 lattes" once and write it down, but if we hear "1 order for 5 lattes" 100 different times in close succession, then we can make the safe assumption that we are dealing with a whale, as this is analogous to seeing 100 orders for 10 ETH stacked in a ladder of price-points in close succession on GDAX.

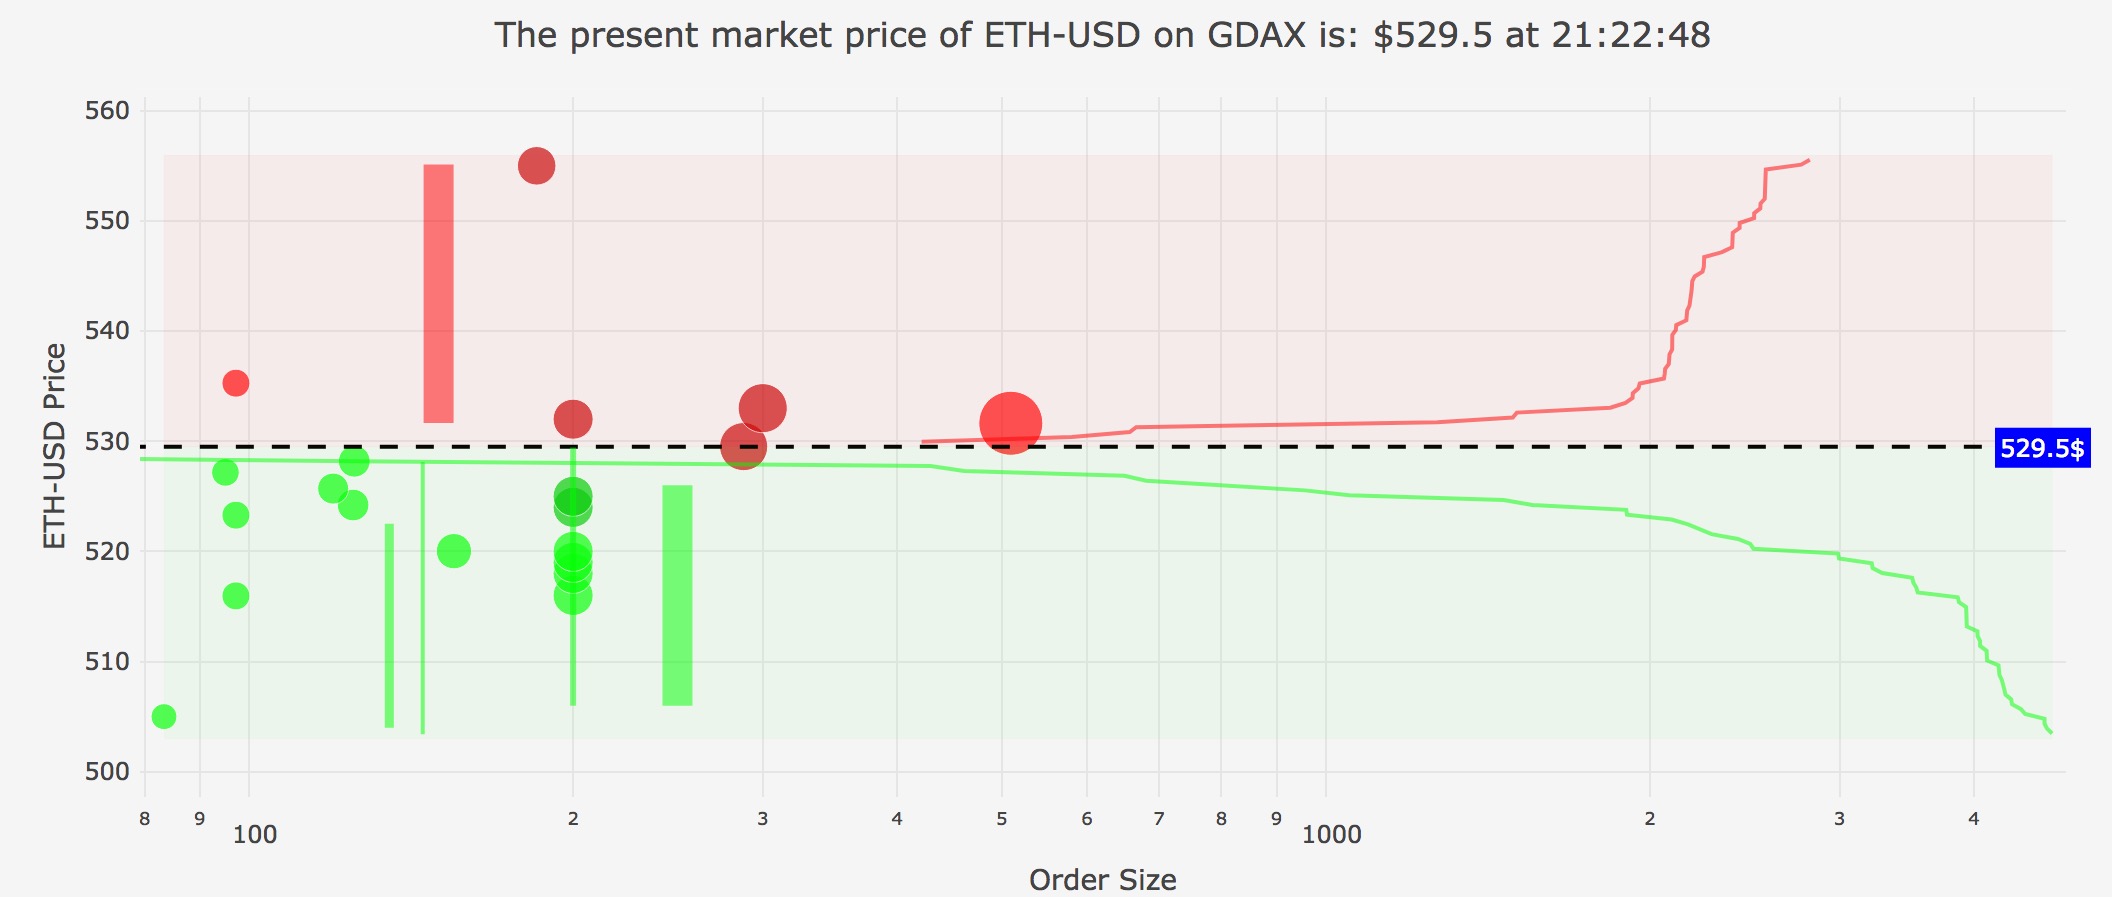
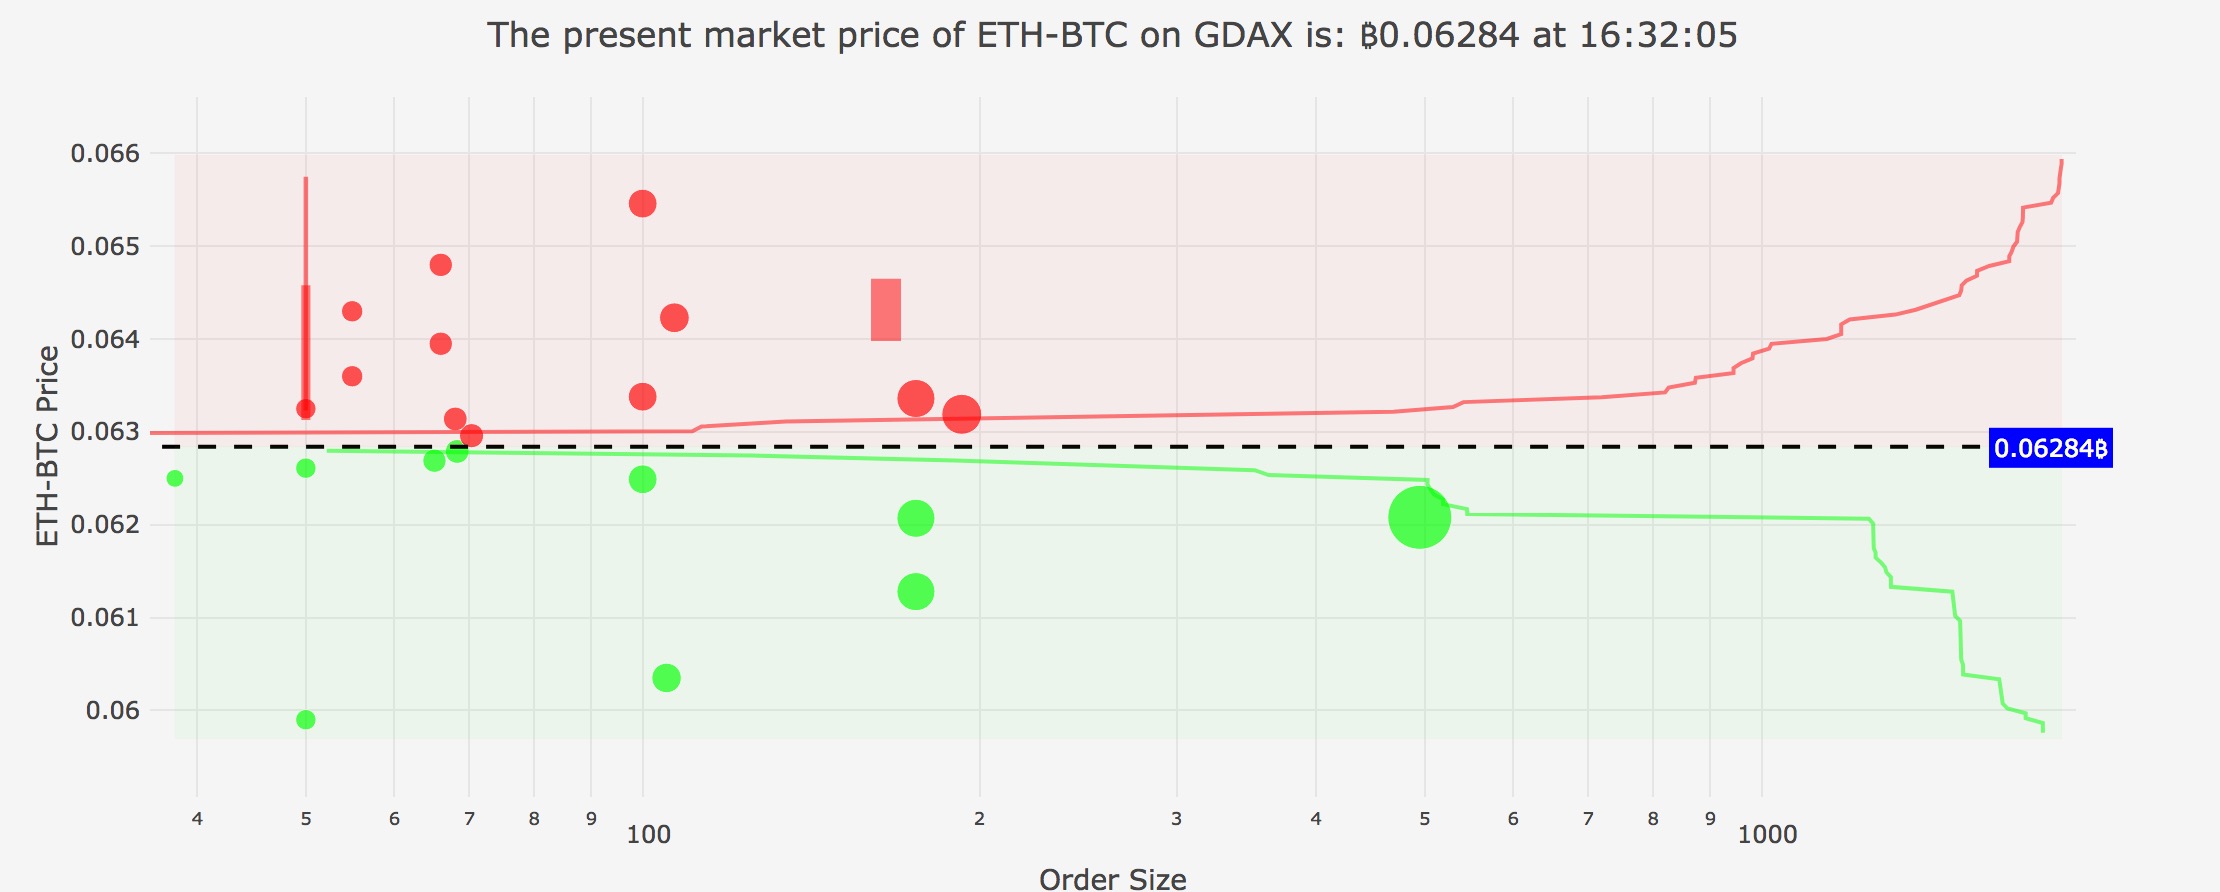
As can be seen from the UI screenshot below, for each currency pairing the user can easily examine the most obvious whales hiding amongst the walls. The algorithm used displays only those orders that make up >= 1% of the volume of the portion of the order book shown in the visualization (which is presently +/-5% from present market price). This methodology makes our analysis robust both in times of price stability--when there is both resistance and support similar in magnitude--as well as during times of large price fluctuation--when there may be very little support or very little resistance. Thanks to the creative coloring algorithm behind the visualization, the brightest colors are those most likely to be whales. The colors become progressively darker as the number of distinct orders at a price-point increases, allowing for easy visual identification of whales in the market.

Main UI

In addition to the main views which provide at-a-glance information about the largest orders, users can freeze the live refresh within the app in order to zoom in on particular sections of the order book, or to take better advantage of the tooltip capabilities of the Plotly visualization. Given that we now track both single price-point and ladder price-point whales, there are often times when bubbles overlap the linebar charts. When this happens, simply freeze the visualization and zoom in on a particular area to separate the two in a more detailed view. An example of the tooltip functionalities for both the ladder and single price-point whales can be seen via the screenshots below.

Single-Price-Point Whale

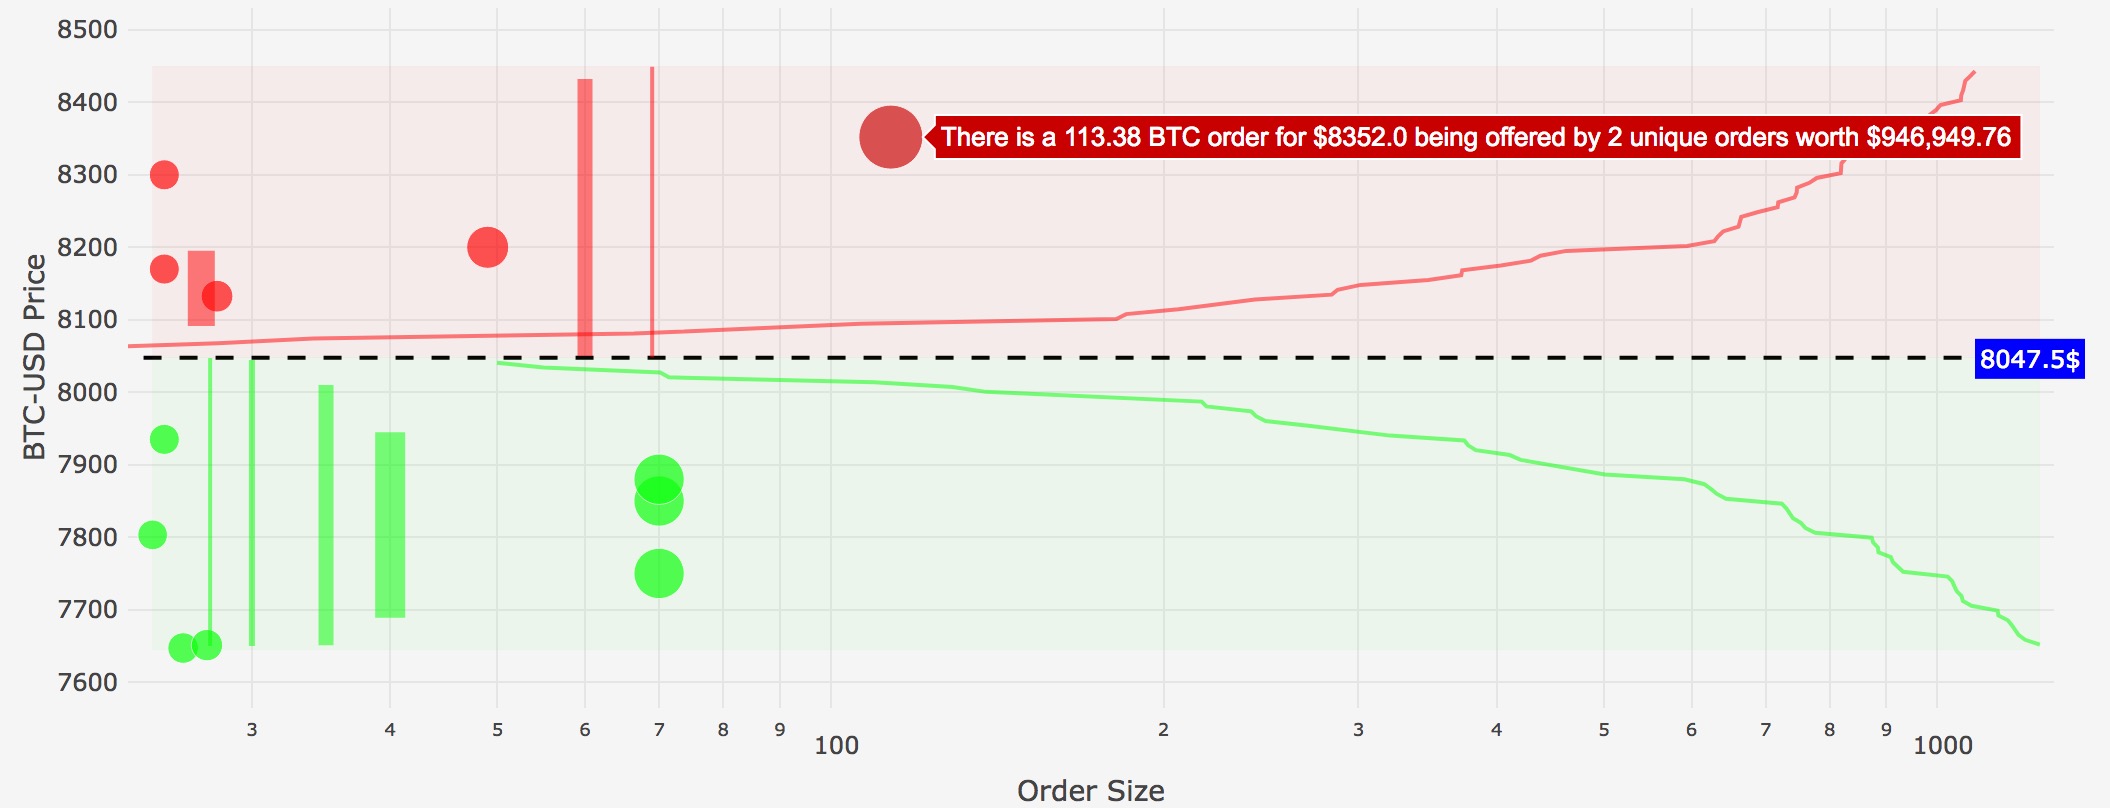
In the image above we are looking at a zoom-in on the chart of BTC/USD. The bubble that we have hovered over near the top towards the center of the view is a slightly dark red bubble (as opposed to the brightest red) because there are 2 orders at that exact price price-point; hence, we cannot be 100% confident that it is one whale acting unilaterally. That said, those 2 orders alone constitute almost $1,000,000.00 in sell-side pressure, so they are important to call out, and thus our methodology captures them. We can see additional useful information via the tooltip--namely, that these 2 sell orders together constitute 113.38 BTC in sell-order volume, with each of those orders being placed at a price-point of $8,352.00. Lastly, we see the count of unique orders at this price point (2), along with the sum total value of those orders ($946,949.76).

Ladder-Price-Point-Whale

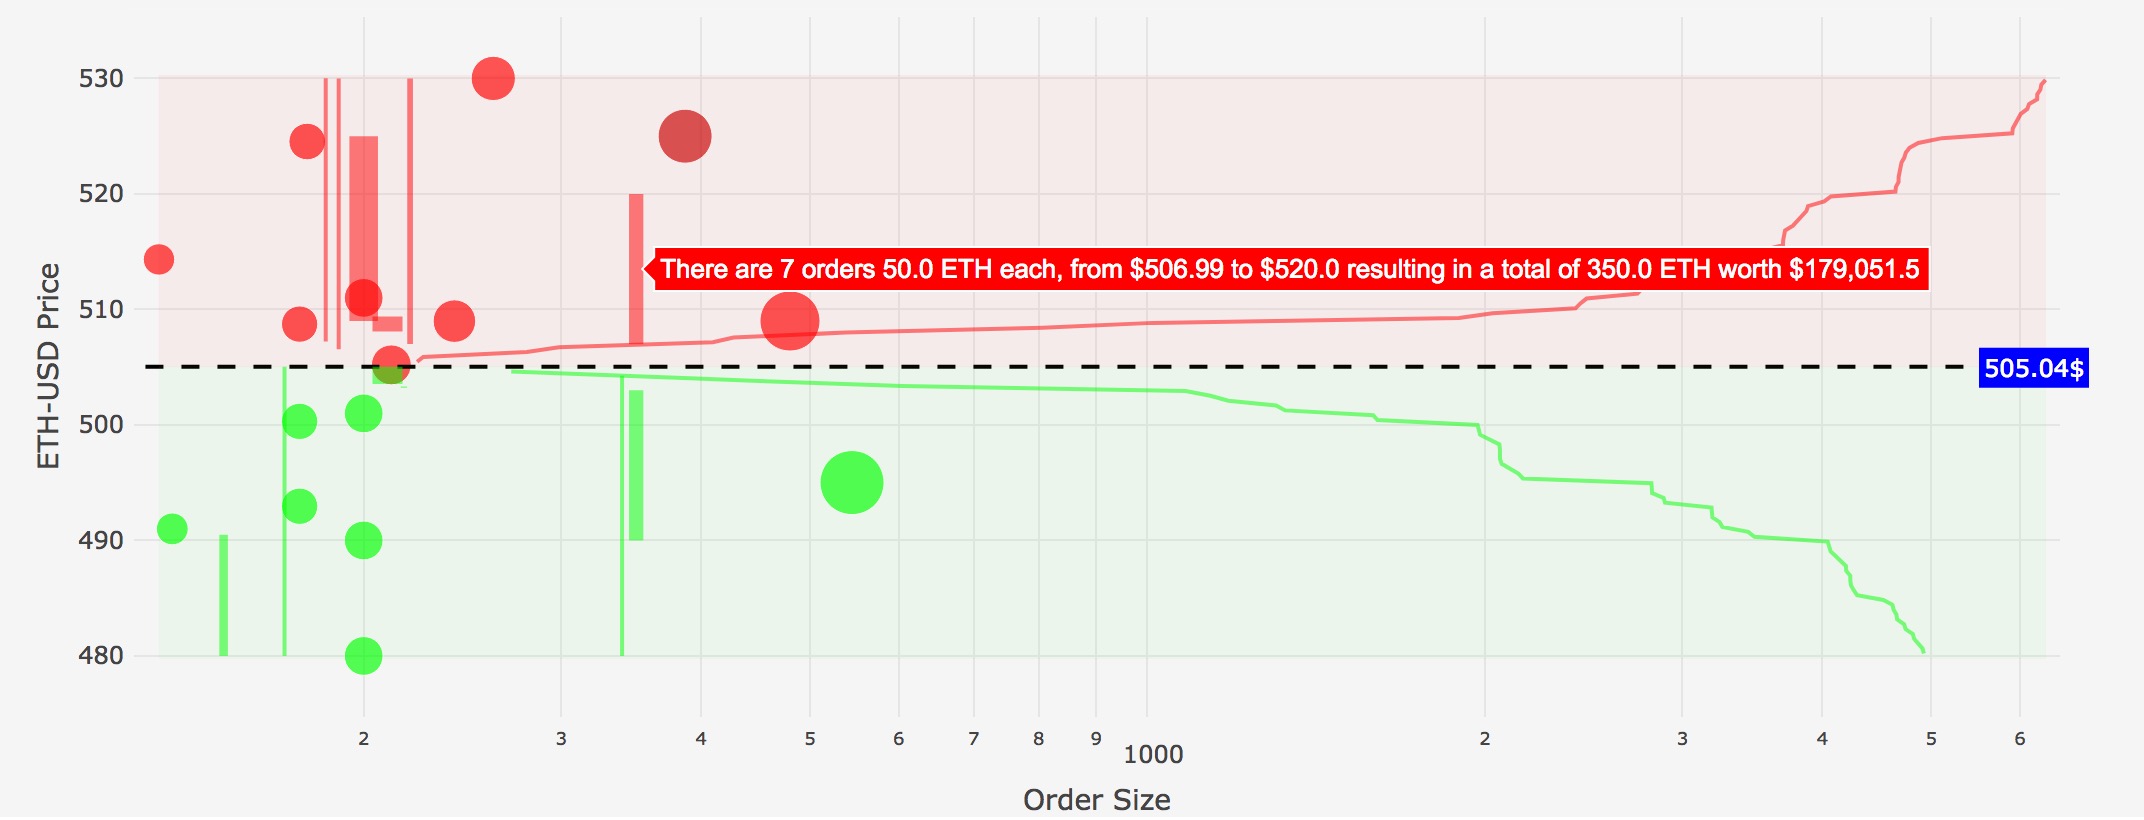
In the image above we are looking at the chart for ETH/USD, hovering over a large ladder price-point whale. Here we can see that the tooltip calls out the total number of rungs on the ladder--7 orders of 50 ETH each--as well as the price range in which those orders are found--from $506.99 to $520.00--and the total market value of those orders (in this case $179,051.50). The thickness of the line is also proportional to the size of each rung on the order ladder.

We cannot be as certain that ladder price-point whales are, in fact, individual whales, as it could just be a few people who place similar orders of identical size at different psychological modal points, but in most cases this is unlikely, and we leave it up to the user to make the ultimate determination as to whether or not they believe a particular order or set of orders to be a whale or not. That said, we do recognize that the ladder price-point whale methodology could perhaps be improved with variable controls, and we are actively looking into this along with other improvements. Our app only serves to provide the information, and to ascribe some semblance of a probability to the likelihood that an observation is a whale or not.

How-To / User Guide (and a few more technical details)

The present version tracks all major pairings (ETH/USD; ETH/BTC; BTC/USD; LTC/USD) but I can add more upon request. It is set to update every 5 seconds (to optimize load-time) but this can be changed easily in the code if you want to make the refreshes faster / slower. There are also buttons that allow the user to pause the automatic refresh ("Freeze all" / "Unfreeze all"), and hide any of the currency pairings that they do not wish to see displayed. The refresh-pausing functionality allows the user to preserve any zoom or limitation that they have selected via the Plotly viz.

The size of each observation is determined algorithmically using a transformation of the square root of the volume of all orders at that particular price-point calibrated so that the bubbles never become unreasonably large or small. The color-coding allows for easy identification of whales, as described in the section above.

Note: all of these limitations--i.e. the volume minimum, the order book limitations, etc., are parameterized within the app.py code and thus can be easily changed if so desired.

Anyone interested with Python 3.6 installed can download the app.py or clone the repo and run the app locally, just check to be sure you have the few required modules installed (I recommend managing them within a virtual environment created using conda or whatever other package manager you prefer). Once you have Python 3.6 installed, open up a Terminal and type:

pip install -r /path/to/requirements.txt

Once its finished type:

python app.py

Then open up your browser and type in the set of numbers that pop up in terminal, which should look similar to "127.0.0.1:8050".

Support Needed

Below is a summary of the main needs that we have presently with which anyone can assist (this is a community project after all!):

  1. Technical assistance and ideation:

    1. If you have coding experience, check out the code and issues tab and see if you can help with anything or propose new additions.

    2. If you want new features integrated or have any other ideas, open a new issue and I'll address it ASAP.

  2. Overall promotion:

    1. Keep sharing with you friends / fellow traders / coders so that we can get more constructive feedback.

    2. Consider starring us on GitHub as a means of sharing this project with the broader community.

Contribution Rules

All are welcome to contribute issues / pull-requests to the codebase. All I ask is that you include a detailed description of your contribution, that your code is thoroughly-commented, and that you test your contribution locally with the most recent version of the Master branch integrated prior to submitting the PR.

crypto-whale-watching-app's People

Contributors

cracklord avatar dependabot[bot] avatar mifunetoshiro avatar pmaji avatar stainedhat avatar theimo1221 avatar

Stargazers

 avatar  avatar  avatar  avatar  avatar  avatar  avatar  avatar  avatar  avatar  avatar  avatar  avatar  avatar  avatar  avatar  avatar  avatar  avatar  avatar  avatar  avatar  avatar  avatar  avatar  avatar  avatar  avatar  avatar  avatar  avatar  avatar  avatar  avatar  avatar  avatar  avatar  avatar  avatar  avatar  avatar  avatar  avatar  avatar  avatar  avatar  avatar  avatar  avatar  avatar  avatar  avatar  avatar  avatar  avatar  avatar  avatar  avatar  avatar  avatar  avatar  avatar  avatar  avatar  avatar  avatar  avatar  avatar  avatar  avatar  avatar  avatar  avatar  avatar  avatar  avatar  avatar  avatar  avatar  avatar  avatar  avatar  avatar  avatar  avatar  avatar  avatar  avatar  avatar  avatar  avatar  avatar  avatar  avatar  avatar  avatar  avatar  avatar  avatar  avatar

Watchers

 avatar  avatar  avatar  avatar  avatar  avatar  avatar  avatar  avatar  avatar  avatar  avatar  avatar  avatar  avatar  avatar  avatar  avatar  avatar  avatar  avatar  avatar  avatar  avatar  avatar  avatar  avatar  avatar  avatar  avatar  avatar  avatar  avatar  avatar  avatar  avatar  avatar  avatar  avatar  avatar  avatar  avatar  avatar  avatar  avatar  avatar  avatar

crypto-whale-watching-app's Issues

License

Is this open source and what is the license?

Requirements

Since there are a couple of dependencies you should do a requirements file so people can install all the dependencies with pip. To create a requirements file all you need to do is setup a virtual env and only install the required python packages then do "pip freeze > requirements.txt". With that it will output all the names of the dependencies along with the version you were using.

app.py cannot work and got the error 'message': 'Failed to subscribe', 'reason': 'No channels provided'

Hi @pmaji,

When I try to launch app.py then I got some exception as below,

127.0.0.1 - - [16/Oct/2019 01:16:10] "POST /_dash-update-component HTTP/1.1" 200 -
Exception in thread Thread-65:
Traceback (most recent call last):
  File "C:\Users\Alex\AppData\Local\Programs\Python\Python37-32\lib\threading.py", line 917, in _bootstrap_inner
    self.run()
  File "C:\Users\Alex\AppData\Local\Programs\Python\Python37-32\lib\threading.py", line 865, in run
    self._target(*self._args, **self._kwargs)
  File "C:\Users\Alex\AppData\Local\Programs\Python\Python37-32\lib\site-packages\cbpro\websocket_client.py", line 41, in _go
    self._listen()
  File "C:\Users\Alex\AppData\Local\Programs\Python\Python37-32\lib\site-packages\cbpro\websocket_client.py", line 91, in _listen
    self.on_message(msg)
  File "C:\Users\Alex\Desktop\crypto-whale-watching-app-master\gdax_book.py", line 21, in on_message
    sequence = message['sequence']
**KeyError: 'sequence'**

Then I set a break point at

    def on_message(self, message):
        sequence = message['sequence']

to figure out what happens, then I got the error as below,
<class 'dict'>: {'type': 'error', 'message': 'Failed to subscribe', 'reason': '**No channels provided**'}

Could you give me guidance on how to solve this problem? Thank you.

Installation fails due to conflicting urllib3 version

Hi, users are unable to run crypto-whale-watching-app due to dependency conflict with urllib3 package.
As shown in the following full dependency graph of crypto-whale-watching-app, crypto-whale-watching-app requires urllib3,while requests==2.21.0 requires urllib3>=1.21.1,<1.25.

According to pip’s “first found wins” installation strategy, urllib3==1.25.3 is the actually installed version.
However, urllib3==1.25.3 does not satisfy urllib3>=1.21.1,<1.25.

Dependency tree------

crypto-whale-watching-app(version range:)
| +-attrs(version range:==19.1.0)
| +-bintrees(version range:==2.0.7)
| +-cbpro(version range:==1.1.4)
| +-certifi(version range:==2018.1.18)
| +-chardet(version range:==3.0.4)
| +-click(version range:==6.7)
| +-colorama(version range:==0.3.9)
| +-dash(version range:==0.30.0)
| +-dash-core-components(version range:==0.38.0)
| +-dash-html-components(version range:==0.13.2)
| +-dash-renderer(version range:==0.15.0)
| +-dash-table(version range:==3.6.0)
| +-datetime(version range:==4.3)
| +-decorator(version range:==4.2.1)
| +-flask(version range:==1.0.2)
| +-flask-compress(version range:==1.4.0)
| +-gdax(version range:==1.0.6)
| +-idna(version range:==2.6)
| +-ipython-genutils(version range:==0.2.0)
| +-itsdangerous(version range:==0.24)
| +-jinja2(version range:==2.10.1)
| +-jsonschema(version range:==2.6.0)
| +-jupyter-core(version range:==4.4.0)
| +-markupsafe(version range:==1.0)
| +-nbformat(version range:==4.4.0)
| +-numpy(version range:==1.16.2)
| +-pandas(version range:==0.24.2)
| +-plotly(version range:==2.7.0)
| | +-decorator(version range:>=4.0.6)
| | +-nbformat(version range:>=4.2)
| | +-pytz(version range:)
| | +-requests(version range:)
| | | +-chardet(version range:>=3.0.2,<3.1.0)
| | | +-idna(version range:>=2.5,<2.9)
| | | +-urllib3(version range:>=1.21.1,<1.26)
| | | +-certifi(version range:>=2017.4.17)
| | +-six(version range:)
| +-pymongo(version range:==3.5.1)
| +-pyrsistent(version range:==0.14.11)
| | +-six(version range:)
| +-python-dateutil(version range:==2.8.0)
| +-pytz(version range:==2019.1)
| +-requests(version range:==2.21.0)
| | +-chardet(version range:>=3.0.2,<3.1.0)
| | +-idna(version range:>=2.5,<2.9)
| | +-urllib3(version range:>=1.21.1,<1.25)
| | +-certifi(version range:>=2017.4.17)
| +-retrying(version range:==1.3.3)
| | +-six(version range:>=1.7.0)
| +-six(version range:==1.10.0)
| +-sortedcontainers(version range:==2.1.0)
| +-traitlets(version range:==4.3.2)
| +-urllib3(version range:>=1.24.2)
| +-websocket-client(version range:==0.40.0)
| | +-six(version range:)
| +-werkzeug(version range:==0.15.2)
| +-zope.interface(version range:==4.6.0)

Thanks for your help.
Best,
Neolith

How to run

I installed modules with pip, when i run, i get error

[root@sultryserver crypto-whale-watching-app]# python app.py 
  File "app.py", line 35
SyntaxError: Non-ASCII character '\xe2' in file app.py on line 35, but no encoding declared; see http://www.python.org/peps/pep-0263.html for details
[root@sultryserver crypto-whale-watching-app]# 

Is there any instruction to run this ? Any specific Python version required ?

Add selection of Pairs

Hello team,

needed Tasks:

  • Add Js function to hide/ shown specific graphs (solved in #40)
  • Decrease Callbacks/ Load to one (as well included in #40)
  • Choose Method of selection
    Dropdown, Radio Buttons?
  • Decide if user can change Pairs on client Side
    I recommend keeping tested Pairs in Python Code to ensure stability and user expierience

Thanks and Greets

Theimo

Time Stamping - Alt Coin Buzz

You guys have a great tool here! I haven't seen any work lately. I'd like to promote you on my segments that I do on Alt Coin Buzz. It's a TA segment along with the news. Are you still working on this? If so can I promote, or would it be better to wait?

Also wondering if you guys are working on a time stamp for the trades to be included in the roll-over. Certainly would be helpful to see if the larger orders are set up to affect the price.

Thank you in advance!

Wrong order sizes listed on graph

order size

Should be 30, 40, 50, ... 120, 130...

Or is this intentional to not clog the space up?

@pmaji also unrelated, but ladder_tooltip_screenshot.JPG and bubble_tooltip_screenshot.JPG should be updated to show the new info available in the tooltip (and I guess the readme as well).

Adding Binance / Other Exchanges

An issue to collect data and tasks needed for adding binance

  • Decrease Callback/ Load Amount to 1 in #40

  • Analyze compatibility
    Needed changes in Data call?
    Needed changes in Data storage (Multiple times same pair e.g. "ETH-USD")

  • Discuss form of presentation
    Original:Send all data to client, and hide/ show selection on clientside with js?
    Update: Sending all data should be no problem due to changes in #40
    Maybe rework show/ hide in the future, to show/ hide complete exchanges.

  • Add Dropdown to select exchange
    Update Show/ Hide Button is much easier

  • define format for get_data function
    Goal is to keep get_data modular for future.

  • exclude api calls from get_data function

When we change this we should change #28 aswell

Thanks and Greets

Theimo

Order Book chart

Hello,

in my Opinion it would be nice to see the total size of order-book by a line in the background.
Due to the fact, we already have the data, it would be little problematic.

I just have the problem I´m not familiar with Plotty....

Thanks and Greets

Theimo

Edit:
Needed Tasks:

  • Sum upp Data for graph
  • Add code for Plotty

pair.webSocketKill division by zero error

Exception in thread Thread-66:
Traceback (most recent call last):
  File "C:\Python\lib\threading.py", line 916, in _bootstrap_inner
    self.run()
  File "C:\Python\lib\threading.py", line 864, in run
    self._target(*self._args, **self._kwargs)
  File "C:\Users\mifune\Desktop\app.py", line 647, in websockThread
    kill = 5 / pair.webSocketKill
ZeroDivisionError: division by zero

Better plot coloring / market price visual

  • show logic for margins specification and adding background color
  • need to choose a better background / plot color (just picked one arbitrarily to show proof of concept)
  • need to add horizontal line to show market price
  • would love to be to selectively color the background such that above the market price is a very faint color of red and below market price is a very faint color of green (this comes after the horizontal line implementation)

Adding visual call-outs for high order count vs. low order count

Taken from a reddit comment; should be able to do something like this:

"Can you put perhaps a thin black stroke around the circles that are controlled by say under 5 addresses and perhaps a thick one around 1 address? Also a small written text of the price really close would be great - hoovering the mouse and it going in less than 2 seconds is hard to keep track of when they’re moving. Thanks excellent tool."

Error: MacOS: Found existing installation six 1.4.1

Hi,
I get this error on my MacOS 10.13.3 (17D102) when running the installation and hence cannot continue:

Found existing installation: six 1.4.1
DEPRECATION: Uninstalling a distutils installed project (six) has been deprecated and will be removed in a future version. This is due to the fact that uninstalling a distutils project will only partially uninstall the project.
Uninstalling six-1.4.1:
Exception:
Traceback (most recent call last):
File "/Library/Python/2.7/site-packages/pip/basecommand.py", line 215, in main
status = self.run(options, args)
File "/Library/Python/2.7/site-packages/pip/commands/install.py", line 342, in run
prefix=options.prefix_path,
File "/Library/Python/2.7/site-packages/pip/req/req_set.py", line 778, in install
requirement.uninstall(auto_confirm=True)
File "/Library/Python/2.7/site-packages/pip/req/req_install.py", line 754, in uninstall
paths_to_remove.remove(auto_confirm)
File "/Library/Python/2.7/site-packages/pip/req/req_uninstall.py", line 115, in remove
renames(path, new_path)
File "/Library/Python/2.7/site-packages/pip/utils/init.py", line 267, in renames
shutil.move(old, new)
File "/System/Library/Frameworks/Python.framework/Versions/2.7/lib/python2.7/shutil.py", line 302, in move
copy2(src, real_dst)
File "/System/Library/Frameworks/Python.framework/Versions/2.7/lib/python2.7/shutil.py", line 131, in copy2
copystat(src, dst)
File "/System/Library/Frameworks/Python.framework/Versions/2.7/lib/python2.7/shutil.py", line 103, in copystat
os.chflags(dst, st.st_flags)
OSError: [Errno 1] Operation not permitted: '/tmp/pip-3DElGw-uninstall/System/Library/Frameworks/Python.framework/Versions/2.7/Extras/lib/python/six-1.4.1-py2.7.egg-info'

Adding OKEX info in separate version / integrated version

So a fan / supporter reached out and mentioned that they were wondering if we could integrate OKEX into our present methodology. They had already written some python code to hit the OKEX websocket API, so some of the work has already been done for us!

See this link here for their first crack at some websocket code. I'm thinking how we might want to add this. At the moment, I'm thinking of maybe demo'ing a separate instance of the app dropping the coinbase api info and replacing it with OKEX info. If it works, we can then think of a solution that combines both--either via a menu option to select the exchange, etc.

I welcome any and all thoughts at how to proceed on this matter!

Adding ETHBTC ratio

appv0.1.txt

Hi, I'm no way near a coder, just a sysadmin debugging perl/python/bash code sometimes. I was playing around to see if I was able to add the ethbtc chart, I think I got it.( Don't really understand the details, it's all copy pasta from your code ;) )

Feel free to take a look and adapt it if you want to merge in the code!

Thanks again for sharing!

App doesn't work any more

Doesn't plot any graph, doesn't load any data.

Error here:

  File "C:\Python\lib\threading.py", line 916, in _bootstrap_inner
    self.run()
  File "C:\Python\lib\threading.py", line 864, in run
    self._target(*self._args, **self._kwargs)
  File "C:\Python\lib\site-packages\cbpro\websocket_client.py", line 41, in _go
    self._listen()
  File "C:\Python\lib\site-packages\cbpro\websocket_client.py", line 91, in _listen
    self.on_message(msg)
  File "C:\test\gdax_book.py", line 21, in on_message
    sequence = message['sequence']
KeyError: 'sequence'

And doesn't load any data:

2020-11-25 10:45:59.950112 [Errors]: Empty data for GDAXETH-EUR Will wait 3s
2020-11-25 10:46:00.125238 [Errors]: Empty data for GDAXETH-BTC Will wait 3s
2020-11-25 10:46:00.412958 [Errors]: Empty data for GDAXBTC-USD Will wait 3s

Edit: I see this is also mentioned in bugs #112 and #113

I tested both on Windows and Linux, same issue. Maybe related to danpaquin/coinbasepro-python#365 ?

building issues

am i the only one not able to build this?? downloaded dash and still can't find out how to build this at all?

Changing dark/ bright

Hello,

what do you guys think about changing current dark/ bright to an algorithm based color.

This way you could see a difference between 1, 4, 6 and 100 unique Orders.

Currently 1=4 and 6=100.

Additionally if we touch this, we should think about making it readable for people with red-green issue

Thanks and Greets

Theimo

Edit: Needed Tasks

  • create a button that changes the color coding to something that red/green color-blind people can use
  • implemented color based on unique orders in #37
  • discuss continuous dark/ bright vs slider with border

Rework legend

  • Logscale
  • Color Description
  • Show/ Hide Buttons
  • Filtering on low volume

error help

error message below:
File "C:\Users\test\Downloads\crypto-whale-watching-app-master\crypto-whale-watching-app-master\gdax_book.py", line 23, in on_message
sequence = message['sequence']
KeyError: 'sequence'

can help?

Is there a way to grab the results and store in Variable or print in console

I wanted to see if its possible in order to grab the results from the graphs and store them in a variable i can use to perform other tasks for example i want to get the prices and total btc that is in the orderbook that a whale has placed when i run dash it prints everything to the console but i would like to print the data from the app or store them in a variable any way of doing this?

Exceptions in thread

Is it just me?

Server should be running now
Initializing order Book websocket for ETH-USD
-- Subscribed! --

Initializing order Book websocket for ETH-BTC
-- Subscribed! --

Initializing order Book websocket for BTC-USD
-- Subscribed! --

Initializing order Book websocket for LTC-USD
-- Subscribed! --

Initializing order Book websocket for LTC-BTC
-- Subscribed! --

Initializing order Book websocket for ETH-EUR
-- Subscribed! --

Initializing order Book websocket for BTC-EUR
-- Subscribed! --

Initializing order Book websocket for LTC-EUR
-- Subscribed! --

Initializing order Book websocket for BCH-USD
-- Subscribed! --

Initializing order Book websocket for BCH-BTC
-- Subscribed! --

Initializing order Book websocket for BCH-EUR
-- Subscribed! --

Web sockets up
Exception in thread Thread-2:
Traceback (most recent call last):
File "C:\Python\lib\threading.py", line 916, in _bootstrap_inner
self.run()
File "C:\Python\lib\threading.py", line 864, in run
self._target(*self._args, **self._kwargs)
File "C:\Users\mifune\Desktop\app.py", line 592, in sendPrepareThread
sendCache = prepare_send()
File "C:\Users\mifune\Desktop\app.py", line 471, in prepare_send
figure=cData[exchange + ticker]
KeyError: 'GDAXETH-USD'

ReCalc up
Everything should be running now, starting Watchdog, to control the herd
Watchdog detected dead Preparer, restarting
Watchdog got some bad sheeps back to group
Exception in thread Thread-47:
Traceback (most recent call last):
File "C:\Python\lib\threading.py", line 916, in _bootstrap_inner
self.run()
File "C:\Python\lib\threading.py", line 864, in run
self._target(*self._args, **self._kwargs)
File "C:\Users\mifune\Desktop\app.py", line 592, in sendPrepareThread
sendCache = prepare_send()
File "C:\Users\mifune\Desktop\app.py", line 471, in prepare_send
figure=cData[exchange + ticker]
KeyError: 'GDAXLTC-EUR'

Install erros - version conflicts

Trying to install with python 3.6.0 but got the following error. Modifying the version manually creates a lot more errors...

ERROR: Cannot install -r requirements.txt (line 3) and requests==2.21.0 because these package versions have conflicting dependencies.

The conflict is caused by:
    The user requested requests==2.21.0
    cbpro 1.1.4 depends on requests==2.13.0

To fix this you could try to:
1. loosen the range of package versions you've specified
2. remove package versions to allow pip attempt to solve the dependency conflict

ERROR: ResolutionImpossible: for help visit https://pip.pypa.io/en/latest/user_guide/#fixing-conflicting-dependencies

Hosting

Looking for long term and speedy options for hosting this. I tried Heroku to no avail. The present plan now is to move to AWS long-term, but I'm open to other suggestions in this thread.

noob issue, invalid syntax

Python 3.6.0 (v3.6.0:41df79263a11, Dec 23 2016, 08:06:12) [MSC v.1900 64 bit (AMD64)] on win32

pip install -r D:\_installers\crypto-whale-watching-app-master\requirements.txt
          ^
SyntaxError: invalid syntax

Questions to explore further beyond the app

Given the treasure trove of data that we now are developing, as well the growing community of traders / coders that are involved in this project, I wanted to open an issue where people can periodically contribute questions that they want explored further.

My aim to open up a Python Notebook separate from this app in which we can dig into deeper (perhaps more long-form analytic questions) that this app or curiosity in general may create. Comment below with any hypotheses you want tested or theories you want explored, etc., and I will add them to the master list of topics to add to the exploratory Python Notebook that will be created.

List of subjects to investigate:

  • Investigate temporal weekly trends (i.e. what really are GDAX's volume / volatility trends over the course of a week, and are these patterns predictable? Do things really go up Sat. night and come down Sunday morning?)
  • Impact of holidays (if any) on trading patterns
  • Is there a time-zone that dominates the volume?
  • Are particularly time-zones more / less bearish / bullish than others?
  • Is it true that eth price follows btc with a short but perceptible lag?
  • Correlation between bot activity and price movement (i.e when bot trading is more prominent does that necessarily lead to a higher likelihood of upwards vs. downwards price swings)
  • Correlation between more volume and price?
  • Investigation of whether or not TA beats buy-and-hold and over what time span if at all?
  • Portfolio performance question? Does holding the 20 lowest price coins vs. the 20 highest price coins yield a higher return over time?
  • Are there any exchanges in particular that more often than not lead the market? (i.e. does an upswing on GDAX cause an upswing elsewhere?)
  • Look in the data to first identify what seem like the same bot trading regularly, and then see what correlation there is to price swings.

Adding ETC

I was wondering if you plan on adding ETC to the app now that's ETC is listed on Coinbase Pro.

Websocket empty?

Hi all,
I have been trying out the app and I think is awesome, although I am getting a lot of websocket empty messages. This is the same issue that @pmaji open in danpaquin/coinbasepro-python#361 but I think is specific to whale-watching-app hence I open it here. Taking a look at the code I think the problem is although the code is trying to use websockets, is still performing polling requests (for each websocket message) which are rate limited by CB. The line 25 in gdax_book is doing this:
res = self._client.get_product_order_book(self.product,level=3)

for each message that is received on the websocket.
CB docs mention this:
Level 3 is only recommended for users wishing to maintain a full real-time order book using the websocket stream. Abuse of Level 3 via polling will cause your access to be limited or blocked.

At the moment I only see one way of fixing this:
-Get the full order book ONCE (when app is launched) and store in database
-update it for each message we get on the websocket

Let me know your thoughts please, happy to help with the project.
Cheers

Few ideas and questions

  • Add a link to the bottom of the page linking to the github
  • Add a slider to adjust the refresh time
  • Permit to add dynamically new charts, as we saw, the only thing to change is the eth-btc or eth-usd to get bch-usd etc... It shouldn't be too hard to re-use the code and let user add charts with a button
  • If we could add new charts/pair add a save button and just save the config so we won't loose anything if we stop the app.
  • Adjust the size of the circles size when zoomed in the graph, it's hard to see when you zoom on the small order!

Q.

  • I was trying to find documentation regarding the column address you request in the code, what does it return ? In the description you said the app allow us to see if walls are from one person of few person right ? In the graph X axis is the price Y the order size, how can I see if the big red circle with a sell order size of 350 and at a price of 815 is only one whale or few others players ? I can only see a circle, what if a guy set a sell order at 815 for 200 and and another one at the same price for 150, how can I see these are two different person/order ?

Thanks!

Variable controls for ladder price-point whales

@theimo1221 you can see in my updated README that I have split our definition of whale into two types. There is a bit of a methodological blind spot that I identified though when it comes to what I called "ladder price-point whales", i.e. those that we mark with the linebar chart instead of the bubble. Namely, the problem is that we ALSO pick up on psychological modal points.

What I mean by this is that, for example, 10 ETH is a very popular volume amount. So is 5 ETH. If many people put orders for 10 ETH along the span of say pricepoints of $950 to $1000, our present methodology would flag this as a potential whale. That said, if we saw a bunch of orders for 10.0085 ETH spanning that same range of prices, THAT is more likely to be a whale, because it is a rarer volume number (and thus less likely to just be a psychological modal point that many people might pick).

It's very hard to control for this, but I think one way to do it might be to exclude from our ladder price-point whale-identification logic any span of orders that is obviously a popular order number (i.e. 10 / 5 / 1 / and maybe a few others). The problem is that this logic is a lot more based on assumptions than the single price-point whale identification logic, but we can make it a bit better I think (given the logic I laid out here). Let me know your thoughts.

Adding "total price" worth to ladder whale orders

Now with #66 merged, hovering over a bubble shows the total price of the order/s. I tried to add the same to the ladder whale orders, and if I play with a simple test dataframe it works, but when I try with app.py, I get an error on:

    vol_grp_bid = vol_grp_bid[
        ((vol_grp_bid[TBL_VOLUME] >= minVolume) & (vol_grp_bid['count'] >= 2.0) & (vol_grp_bid['count'] < 70.0))]

for some reason. Could someone with more experience implement this?

Problem with "unique" orders

Look at this comparision:
image

In the bottom current code, wich groups by price and then filters all less than 1% of Volume in Range.
In the top I first filter all orders < 1% of Volume in Range and then group by prize.

This results in much better data. e.g. the sell order at 0.083 (yellow) is 1 50 ETH order plus 5 additional orders (summed up to 6 ETH).
Top graph warns about a whale. Bottom graph say "Nah, it´s okay, there are 6 unique orders"

Wrote it as an issue to post picture.

Continuous improvement of documentation

  • update requirements.txt with few new packages added by contributors
  • figure out what kind of license we want to use for this project and add it to files / potentially read me
  • update README
  • finalize comments throughout

Group by volume additionally

Had a nice and good discussion with Paul. We found many good and some little points.

Pull #41 did a lot of changes towards original goal of detecting whales and fake Resistances/ Supports.

Currrently we spot fakes by grouping price.
An additional approach would be grouping by volume (e.g. 50 orders of 1.53 ETH from $962.65 to $984.42.

At current state we thing adding a bar at the position of summed up volume with the bot beeing at the start and top beeing at the end of price range could be best.

Needed steps to do this:

  • Calculate new dataset
  • Grouping dataset
  • adding go.bar or rectangle
  • needs description in legend
    I guess go.bar won´t work cause we start at different y-levels

Errors appearing when hosting

Hi guys, the syncing stopping problem is still an issue. When looking at the logs I discovered that they often print errors for different graphs like this:

127.0.0.1 - - [20/Feb/2018 04:07:42] "POST /_dash-update-component HTTP/1.0" 500 -
[2018-02-20 04:07:42,794] ERROR in app: Exception on /_dash-update-component [POST]
Traceback (most recent call last):
  File "/usr/local/lib/python3.5/dist-packages/flask/app.py", line 1982, in wsgi_app
    response = self.full_dispatch_request()
  File "/usr/local/lib/python3.5/dist-packages/flask/app.py", line 1614, in full_dispatch_request
    rv = self.handle_user_exception(e)
  File "/usr/local/lib/python3.5/dist-packages/flask/app.py", line 1517, in handle_user_exception
    reraise(exc_type, exc_value, tb)
  File "/usr/local/lib/python3.5/dist-packages/flask/_compat.py", line 33, in reraise
    raise value
  File "/usr/local/lib/python3.5/dist-packages/flask/app.py", line 1612, in full_dispatch_request
    rv = self.dispatch_request()
  File "/usr/local/lib/python3.5/dist-packages/flask/app.py", line 1598, in dispatch_request
    return self.view_functions[rule.endpoint](**req.view_args)
  File "/usr/local/lib/python3.5/dist-packages/dash/dash.py", line 537, in dispatch
    for component_registration in self.callback_map[target_id]['inputs']:
KeyError: 'live-graph-ethbtc.figure'

App looks like it's doing nothing on initial load

I've been wondering how to fix this myself but I don't know enough about these libraries to figure it out. When you load the app it looks like it's doing nothing for 10 seconds until it makes the first requests to the server to get the data.

It seems to be because of the interval being set to 10 seconds, it waits for the first 10 seconds to tick and then it loads the data. What would be better is if it loaded the graphs immediately on the page's first load and then updated them every 10 seconds, but I can't see how to do this from the library being used.

Tooltips

Hi,

I really appreciate this tool and it's fantastic. The only thing really bugs me is that the tool tips when you hover over an order block disappears too fast without you getting a chance to digest the information. Is there any way you could possibly make an option to just always keep the hover tooltips on if for example you clicked the order block.

Thanks

Recommend Projects

  • React photo React

    A declarative, efficient, and flexible JavaScript library for building user interfaces.

  • Vue.js photo Vue.js

    🖖 Vue.js is a progressive, incrementally-adoptable JavaScript framework for building UI on the web.

  • Typescript photo Typescript

    TypeScript is a superset of JavaScript that compiles to clean JavaScript output.

  • TensorFlow photo TensorFlow

    An Open Source Machine Learning Framework for Everyone

  • Django photo Django

    The Web framework for perfectionists with deadlines.

  • D3 photo D3

    Bring data to life with SVG, Canvas and HTML. 📊📈🎉

Recommend Topics

  • javascript

    JavaScript (JS) is a lightweight interpreted programming language with first-class functions.

  • web

    Some thing interesting about web. New door for the world.

  • server

    A server is a program made to process requests and deliver data to clients.

  • Machine learning

    Machine learning is a way of modeling and interpreting data that allows a piece of software to respond intelligently.

  • Game

    Some thing interesting about game, make everyone happy.

Recommend Org

  • Facebook photo Facebook

    We are working to build community through open source technology. NB: members must have two-factor auth.

  • Microsoft photo Microsoft

    Open source projects and samples from Microsoft.

  • Google photo Google

    Google ❤️ Open Source for everyone.

  • D3 photo D3

    Data-Driven Documents codes.