rcastelo / gsva Goto Github PK
View Code? Open in Web Editor NEWGene set variation analysis
Gene set variation analysis


When I use the function gsva(), the following error was encountered.
iteration: Error in serialize(data, node$con, xdr = FALSE) :
error writing to connection
In addition: Warning messages:
1: In .filterFeatures(expr, method) :
3501 genes with constant expression values throuhgout the samples.
2: In .filterFeatures(expr, method) :
Since argument method!="ssgsea", genes with constant expression values are discarded.
3: In .gsva(expr, mapped.gset.idx.list, method, kcdf, rnaseq, abs.ranking, :
Some gene sets have size one. Consider setting 'min.sz > 1'.
Error in serialize(data, node$con, xdr = FALSE) :
error writing to connection
I don't know what is wrong, because this function ran successfully in the past. I restart the R, but it does not work.
Looking forward to your reply! Thank you very much!
Hi,
I have a question about whether to filter my dataset before GSVA. In the original article, I noticed that the RNA-seq and microarray datasets (commonPickrellHuang) were all filtered before GSVA. GSVA and GSEA shares many similarities. The GSEA website says
Typically, the GSEA team runs the analysis on unfiltered data. One suggested approach is to run GSEA on the unfiltered data.
So I wonder whether GSVA algorithm beneift from filtering poorly expressed genes?
Following up this conversation at the Bioconductor support site, consider adding support to combine scores from directional gene sets.
Hi There,
I am wondering why did you discontinue with the bootstrap option in the new version??
Best regards
Bhagwan
Hi,
I have a question about gene identifier. I promise I use the same type for gene names, such as symbol or ENTREZ id. I have run the same data and same code several days before.But today it doesn't work. The error is shown below. I would appreciate so much if you could help me.

Clover

the above line gave me NAN, any reason for it, I guess it could be the method or the gene set. any suggestion, I use it for one year and just got this error today.
Hi, thanks for your great tool!
The Rmd in vignette produces gene set list as follows:
gs <- lapply(gs, function(n, p)
                   paste0("g", sample(1:p, size=n, replace=FALSE)), p)
names(gs) <- paste0("gs", 1:length(gs))
Here, the global variable p is not necessary for lapply()
And the following command should be OK.
gs <- lapply(gs, function(n)
                   paste0("g", sample(1:p, size=n, replace=FALSE)))
names(gs) <- paste0("gs", 1:length(gs))
Best~
> diff <- gsva(data3, c2BroadSets, annotation, method = "gsva", min.sz=1, max.sz=Inf, parallel.sz=0,mx.diff=TRUE, verbose=TRUE)
Mapping identifiers between gene sets and feature names
Error in as.vector(x, "character") :
  **cannot coerce type 'closure' to vector of type 'character'**
> data3[1:4,1:4]
      CGGA_1052 CGGA_1263   CGGA_1411   CGGA_235
ABCC3 -9.965784 -3.158855 -4.09283600 -9.9657843
ABCC8  1.133433 -2.381182 -0.02568772  0.3015840
ACTA2 -1.396008 -2.968641  0.95600263 -1.4590570
ACTN1 -3.453792 -6.361835 -3.24782496 -0.5832813
Hi,dear author, I used a expression matrix data3 and a geneSets(geneSets <- getGmt("c7.all.v6.2.symbols.gmt")) to run gsva, while get the above error,what should I do, great thanks for your kind help!
Hello,
I've recently been using this package as part of my RNA-Seq analysis, and encountered a problem since updating to R v4.1.0. When I try to run the main gsva function, R simply crashes/aborts during the process, without any error messages being printed - just the popup window stating that "R encountered a fatal error." But it runs fine with the exact same inputs if I switch back to R v4.0.5. I'm using VST-normalized RNA-Seq data, with the following settings:
Below is my sessionInfo() output. I can also provide some of my data/gene sets if that would be of use.
R version 4.1.0 (2021-05-18)
Platform: x86_64-w64-mingw32/x64 (64-bit)
Running under: Windows 10 x64 (build 19042)

Matrix products: default

locale:
[1] LC_COLLATE=English_Canada.1252  LC_CTYPE=English_Canada.1252
[3] LC_MONETARY=English_Canada.1252 LC_NUMERIC=C
[5] LC_TIME=English_Canada.1252

attached base packages:
[1] grid      stats     graphics  grDevices utils     datasets  methods   base

other attached packages:
 [1] forcats_0.5.1        stringr_1.4.0        dplyr_1.0.6          purrr_0.3.4
 [5] readr_1.4.0          tidyr_1.1.3          tibble_3.1.2         tidyverse_1.3.1
 [9] plotly_4.9.3         ggplot2_3.3.3        DT_0.18              janitor_2.1.0
[13] magrittr_2.0.1       ComplexHeatmap_2.8.0 circlize_0.4.12      GSVA_1.40.0
[17] enrichR_3.0          ReactomePA_1.36.0    shinyjs_2.0.0        shiny_1.6.0
I was also able to reproduce the same behaviour on Ubuntu 20. Any help would be greatly appreciated. Thanks!
Hello!
Is there a way to perform leading edge analysis on the ssGSEA results?
I'm looking to find which genes are most prominent in the determination of the enrichment scores
Thanks
Taken from ?gsva:
     p <- 10 ## number of genes
     n <- 30 ## number of samples
     nGrp1 <- 15 ## number of samples in group 1
     nGrp2 <- n - nGrp1 ## number of samples in group 2

     geneSets <- list(set1=paste("g", 1:3, sep=""),
                      set2=paste("g", 4:6, sep=""),
                      set3=paste("g", 7:10, sep=""))
     y <- matrix(rnorm(n*p), nrow=p, ncol=n,
                 dimnames=list(paste("g", 1:p, sep="") , paste("s", 1:n, sep="")))
     y[geneSets$set1, (nGrp1+1):n] <- y[geneSets$set1, (nGrp1+1):n] + 2

     library(limma)
     design <- cbind(sampleGroup1=1, sampleGroup2vs1=c(rep(0, nGrp1), rep(1, nGrp2)))
     fit <- lmFit(y, design)
     fit <- eBayes(fit)
     topTable(fit, coef="sampleGroup2vs1")

rownames(y) # okay, so far so good:
##  [1] "g1"  "g2"  "g3"  "g4"  "g5"  "g6"  "g7"  "g8"  "g9"  "g10"

     ## estimate GSVA enrichment scores for the three sets
     library(GSVA)
     gsva_es <- gsva(y, geneSets, mx.diff=1)

rownames(y) # What the hey!?
##  [1] "g1"  "g2"  "g3"  "g4"  "g5"  "g6"  "g7"  "g8"  "g9"  "g10"
## attr(,".match.hash")
## <hash table>
You can see how calling gsva modifies rownames(y) in place. This is very unexpected; R functions should not exhibit side effects like this, given that y is not an environment or reference class.
The addition of attributes breaks downstream functions like the SummarizedExperiment constructor:
SummarizedExperiment::SummarizedExperiment(y)
## Error in validObject(.Object) :
##   invalid class “SummarizedExperiment” object:
##     'names(x)' must be NULL or a character vector with no attributes
Why not just use base::match()? Surely the speed improvement, if any, cannot be so fantastic as to tolerate this behavior.
R Under development (unstable) (2020-11-09 r79409)
Platform: x86_64-apple-darwin19.5.0 (64-bit)
Running under: macOS Catalina 10.15.5

Matrix products: default
BLAS:   /Users/luna/Software/R/trunk/lib/libRblas.dylib
LAPACK: /Users/luna/Software/R/trunk/lib/libRlapack.dylib

locale:
[1] en_US.UTF-8/en_US.UTF-8/en_US.UTF-8/C/en_US.UTF-8/en_US.UTF-8

attached base packages:
[1] stats     graphics  grDevices utils     datasets  methods   base

other attached packages:
[1] GSVA_1.39.11 limma_3.47.3

loaded via a namespace (and not attached):
 [1] Rcpp_1.0.6                  compiler_4.1.0
 [3] GenomeInfoDb_1.27.3         XVector_0.31.1
 [5] DelayedMatrixStats_1.13.4   rhdf5filters_1.3.3
 [7] MatrixGenerics_1.3.0        bitops_1.0-6
 [9] tools_4.1.0                 zlibbioc_1.37.0
[11] SingleCellExperiment_1.13.4 digest_0.6.27
[13] bit_4.0.4                   rhdf5_2.35.0
[15] lattice_0.20-41             annotate_1.69.0
[17] RSQLite_2.2.2               memoise_1.1.0
[19] rlang_0.4.10                fastmatch_1.1-0
[21] Matrix_1.3-2                graph_1.69.0
[23] DelayedArray_0.17.7         DBI_1.1.1
[25] parallel_4.1.0              GenomeInfoDbData_1.2.4
[27] httr_1.4.2                  S4Vectors_0.29.6
[29] vctrs_0.3.6                 IRanges_2.25.6
[31] stats4_4.1.0                bit64_4.0.5
[33] grid_4.1.0                  GSEABase_1.53.1
[35] Biobase_2.51.0              R6_2.5.0
[37] HDF5Array_1.19.0            AnnotationDbi_1.53.0
[39] BiocParallel_1.25.2         XML_3.99-0.5
[41] irlba_2.3.3                 BiocSingular_1.7.1
[43] Rhdf5lib_1.13.0             blob_1.2.1
[45] sparseMatrixStats_1.3.2     matrixStats_0.57.0
[47] BiocGenerics_0.37.0         GenomicRanges_1.43.3
[49] rsvd_1.0.3                  beachmat_2.7.6
[51] SummarizedExperiment_1.21.1 xtable_1.8-4
[53] ScaledMatrix_0.99.2         RCurl_1.98-1.2
Create a parameter class and constructor function for the zscore method.
I am trying to wrap my head around the implementation of the random walk statistic (the positioning of tau, in particular) and how it's compatible with its definition in the paper:

Shouldn't
stepCDFinGeneSet <- cumsum((abs(R[geneRanking, j]) * indicatorFunInsideGeneSet)^alpha) / sum((abs(R[geneRanking, j]) * indicatorFunInsideGeneSet)^alpha)
be in fact
stepCDFinGeneSet <- cumsum((abs(R[geneRanking, j])^alpha * indicatorFunInsideGeneSet)) / sum((abs(R[geneRanking, j])^alpha * indicatorFunInsideGeneSet))
? (the results don't differ unless tau=0). Thank you for your help.
Hello,
For ssGSEA on scRNA-seq data it appears the code is running the .fastRndWalk function n_cells * gene_sets number of times. I was curious whether moving this function to C++ could speed up this operation (and potentially make it more memory efficient) so I roughly reimplemented the function using Rcpp with a few minor changes.
Hijacking your vignette code to make some example data.
library("Rcpp")
library("GSVA")
library("BiocParallel")

set.seed(100)

p <- 20000 ## number of genes
n <- 100    ## number of samples (cells)
## simulate expression values from a standard Gaussian distribution
X <- matrix(rnorm(p*n), nrow=p,
            dimnames=list(paste0("g", 1:p), paste0("s", 1:n)))

X <- as(X, "CsparseMatrix")

## sample gene set sizes
gs <- as.list(sample(10:100, size=100, replace=TRUE))
## sample gene sets
gs <- lapply(gs, function(n, p)
                   paste0("g", sample(1:p, size=n, replace=FALSE)), p)
names(gs) <- paste0("gs", 1:length(gs))
Preparing the data to run the old and new functions.
X <- GSVA:::.filterFeatures(X, "ssgsea")

geneSets <- GSVA:::.mapGeneSetsToFeatures(gs, rownames(X))

n <- ncol(X)

R <- t(sparseMatrixStats::colRanks(X, ties.method = "average"))
mode(R) <- "integer"

Ra <- abs(R)^0.25
The R implementation of .fastRndWalk.
.fastRndWalk <- function(gSetIdx, geneRanking, j, Ra) {
    n <- length(geneRanking)
    k <- length(gSetIdx)
    idxs <- sort.int(match(gSetIdx, geneRanking))

    stepCDFinGeneSet2 <-
        sum(Ra[geneRanking[idxs], j] * (n - idxs + 1)) /
        sum((Ra[geneRanking[idxs], j]))


    stepCDFoutGeneSet2 <- (n * (n + 1) / 2 - sum(n - idxs + 1)) / (n - k)

    walkStat <- stepCDFinGeneSet2 - stepCDFoutGeneSet2

    walkStat
}

R_fastRndWalk <- function(){
  es <- bplapply(as.list(1:n), function(j) {
    geneRanking <- order(R[, j], decreasing=TRUE)
    es_sample <- lapply(geneSets, .fastRndWalk, geneRanking, j, Ra)

    unlist(es_sample)
  }, BPPARAM=SerialParam(progressbar=TRUE))
  es <- do.call("cbind", es)
  return(es)
}
Here's the Rcpp implementation of fasterRndWalk.
sourceCpp(code="
  #include <Rcpp.h>
  using namespace Rcpp;

  // [[Rcpp::export]]
  double fasterRndWalk(IntegerVector gSetIdx, IntegerVector geneRanking, int j, NumericMatrix Ra) {
    int n = geneRanking.size();
    int k = gSetIdx.size();
    IntegerVector idxs = match(gSetIdx, geneRanking) - 1;

    double sum1 = 0;
    double sum2 = 0;
    for (int i = 0; i < k; ++i) {
      int idx = idxs[i];
      double value = Ra(geneRanking[idx] - 1, j - 1);
      sum1 += value * (n - idx);
      sum2 += value;
    }

    double stepCDFinGeneSet2 = sum1 / sum2;
    double stepCDFoutGeneSet2 = (n * (n + 1) / 2 - sum(n - idxs + 1)) / (n - k);
    double walkStat = stepCDFinGeneSet2 - stepCDFoutGeneSet2;

    return walkStat;
  }
")

Rcpp_fasterRndWalk <- function() {
  es <- bplapply(as.list(1:n), function(j) {
    geneRanking <- order(R[, j], decreasing=TRUE)
    es_sample <- lapply(geneSets, fasterRndWalk, geneRanking, j, Ra)

    unlist(es_sample)
  }, BPPARAM=SerialParam(progressbar=TRUE))
  es <- do.call("cbind", es)
  return(es)
}
Benchmarking the two implementations.
bench::mark(
  R_fastRndWalk(),
  Rcpp_fasterRndWalk(),
  time_unit="s",
  iterations=10,
  check=FALSE)

# A tibble: 2 × 13
  expression             min median `itr/sec` mem_alloc `gc/sec` n_itr  n_gc total_time result memory                   time            gc
  <bch:expr>           <dbl>  <dbl>     <dbl> <bch:byt>    <dbl> <int> <dbl>      <dbl> <list> <list>                   <list>          <list>
1 R_fastRndWalk()      14.4   14.4     0.0684    3.25GB    0.212    10    31      146.  <NULL> <Rprofmem [128,647 × 3]> <bench_tm [10]> <tibble [10 × 3]>
2 Rcpp_fasterRndWalk()  3.71   3.75    0.267    30.67MB    0.160    10     6       37.4 <NULL> <Rprofmem [22,813 × 3]>  <bench_tm [10]> <tibble [10 × 3]>
The C++ implementation is almost 4 times faster and uses about 100 times less memory.
The results are slightly different.
> R_fastRndWalk()[1:10, 1:10]
           [,1]       [,2]       [,3]      [,4]      [,5]       [,6]       [,7]      [,8]      [,9]       [,10]
gs1   1460.4123  786.42436  848.96567 1652.6371 1699.5721  868.81145   99.72889 1147.2828  403.7456  951.345237
gs2   1351.3376 1589.24939 1166.46396 -813.0662 1193.3584 1436.63892 -671.25817 1470.0535 1757.5663 1528.896167
gs3    989.5343 -724.26180  988.38412 1285.1941 1725.1857  755.75058  413.20320 1216.5852 1103.2568  860.702336
gs4   2270.6517  913.43945 1786.67177 1630.7358  832.9891  888.71093 1349.89766 1286.1466 1130.9348  347.736033
gs5    965.6410 1770.05765 -718.08133  631.8339 1105.8057 2099.18587  853.27931 1738.7601 -361.8615 1696.477819
gs6   1241.1693  605.35762 1390.54474  218.5366 1603.1661 1064.22024  738.78739 1321.9661 1595.9738  866.650390
gs7   1821.4801 1105.39881 1805.02746  676.4591  738.2390 1670.38658  800.48911 1655.6888 1616.6367 1087.332425
gs8  -1150.0557 3321.83607 -297.52957 2636.5804 2193.6280 1574.25666 1273.75154  693.2889  918.0266 2620.212948
gs9    966.0466   39.91441  -81.57265 -301.6164 1266.5278  751.08846  846.78107 1121.3221  348.3009   -2.232159
gs10  1701.1213 2497.79930 1937.79704  224.0872 2921.6033  -65.45541 1132.45168 1988.8786  482.1426 1195.779765

> Rcpp_fasterRndWalk()[1:10, 1:10]
           [,1]       [,2]       [,3]      [,4]      [,5]       [,6]      [,7]      [,8]      [,9]       [,10]
gs1   1461.2588  787.11592  849.46221 1653.3682 1700.3948  869.71002  100.5005 1147.6113  404.5719  951.448069
gs2   1351.7445 1590.10813 1167.39739 -812.7176 1193.5546 1436.89530 -670.6217 1470.8496 1758.2667 1529.485934
gs3    990.3381 -723.26908  989.34011 1285.4300 1725.7057  756.63913  413.2240 1217.1778 1103.9727  861.649998
gs4   2271.2896  914.25031 1787.42785 1631.2987  833.0586  889.30922 1350.6158 1286.2566 1131.0374  348.201812
gs5    966.2519 1770.93258 -718.06508  631.9691 1105.8603 2099.70185  853.5787 1739.6593 -361.5559 1696.634394
gs6   1242.0753  605.57559 1391.00445  219.5044 1603.2600 1064.83204  739.1218 1322.4162 1596.2087  867.207822
gs7   1822.1339 1105.67133 1805.62463  677.3429  738.5166 1670.98240  801.3700 1655.7198 1617.6060 1087.722861
gs8  -1149.3512 3321.87337 -297.04575 2637.5285 2194.2728 1574.87523 1273.8755  693.7584  918.8056 2620.856900
gs9    966.5787   40.34541  -80.57416 -301.3876 1267.3939  751.96272  846.8289 1121.3280  348.5236   -1.692659
gs10  1701.4705 2498.41092 1938.07949  224.7069 2922.3907  -64.56492 1132.6352 1989.6011  483.1052 1195.850440
My C++ is rusty (because of Rust) and I know very little C, so I imagine someone else could improve this further or reimplement it in C and avoid any more dependencies. I'm not too proud to admit that I needed ChatGPT to debug a line of code for me here.
Some relevant versions.
> R.Version()$version.string
[1] "R version 4.2.1 (2022-06-23)"
> packageVersion("GSVA")
[1] ‘1.46.0’
> packageVersion("Rcpp")
[1] ‘1.0.9’
> packageVersion("BiocParallel")
[1] ‘1.32.5’
Cheers,
Bob
Fixing --as-cran notes on the R code.
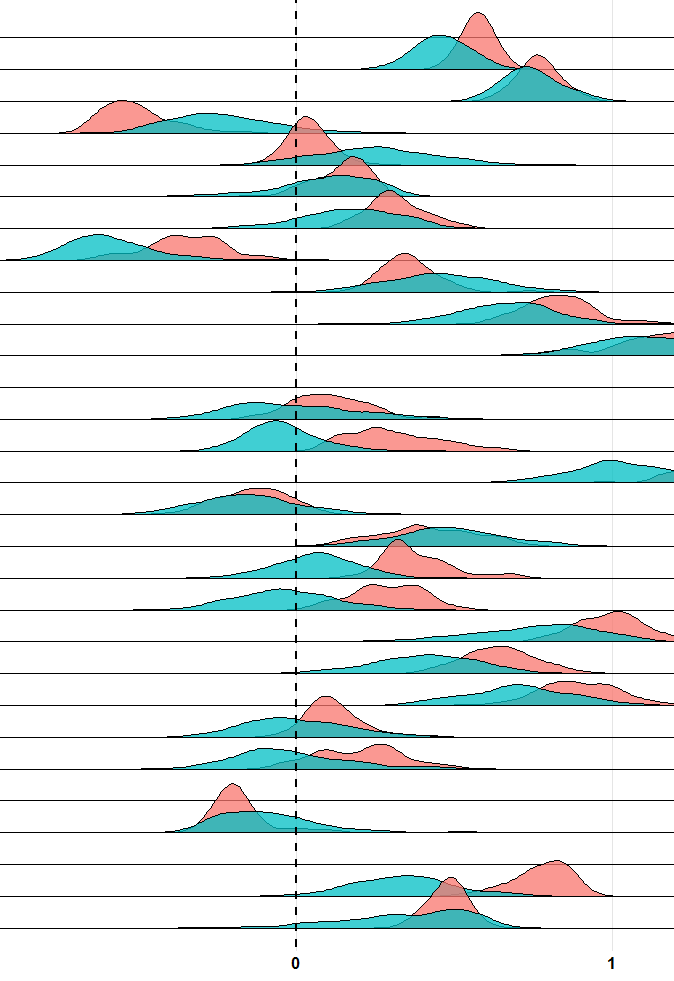
Thank you for this great package. Please is there an explanation why there are negative enrichment scores and what they could mean? I understand that while comparing two groups, one group being negative will imply that the group with positive values is enriched for a certain signature. But what if both groups have negative or positive values? E.g. see plot below:

Thanks for your helpful response.
Hi, guys. I tired to use GSVA for calculation of score of each immune cell type in a TCGA RNAseq follow Wang et al. 's instruction at https://xsliulab.github.io/tumor-immunogenicity-score/#calculation-of-aps-tis-and-iis.
After dowlnloading data from UCSC Xena, and tiding and cleanning the RNAseq and clinical data, I tried:
load("results/merged_geneList.RData")
load("results/TCGA_RNASeq_PanCancer.RData")
gsva(ExprMatList = list(TCGA_RNASeq_PanCancer), merged_geneList, group_col = "Cell_type", gene_col = "Symbol", method = "gsva")-> res_pancan.GSVA
then I saw this error:
Error in (function (classes, fdef, mtable) :
unable to find an inherited method for function ‘gsva’ for signature ‘"spec_tbl_df", "missing"’
I am not sure if it's beacuse there maybe some NA in the RNAseq dataset, or because I need to change the dataframe for this gvsa function.
Could someone please enlighten me?
Thanks in advance!
Hi. Thank you for developing and maintaining such a cool tool. I have several questions about the function.
In the GSVA manual, it states that several parameters are used only when method = 'gsva'. Does that mean I cannot input count data when method = 'ssgsea' since kcdf cannot be setted? So what the data format are required when method = 'ssgsea'? FPKM, TPM, or CPM? And does it have to be in log scale?
PathwayGSVA <- gsva(as.matrix(expr_data_TPM), PathwayGMT_ls, method = "ssgsea", parallel.sz = 1,
                    min.sz = 10, max.sz = Inf, verbose = T, kcdf = 'Gaussian', abs.ranking = TRUE)
A following question is for such a function listed above, the last two parameters should be removed?
The workhorse of the GSVA package is the function gsva(), which requires the following two input arguments: A **normalized gene expression dataset**, which can be provided in one of the following containers: ...
Besides, what does the nomalized dataset mean? Should I normalize the expression dataset before the ssgsea or will the function perform the normalization when running ssgsea?
Since I am not familiar with R and ExpressionSet class, it's really hart to find the final result, i.e. enrichment score.
Could you add this code into manual explicitly:
result <- gsva(...)
result_enrichment_score <- result@assayData$exprs
Hi,
I wonder if there is a way to use hgnc_symbol instead of entrezgene.
Thanks
the data shape is 40000 (samples) * 2000 (genes), when I using gsva(data, geneset_df, parallel.sz=10, BPPARAM=MulticoreParam(parallel.sz, progressbar=True), I got error:
Error in mcfork(detached) :
unable to fork, possible reason: Cannot allocate memory
Calls: gsva ... bploop.iterate -> .send_to -> .send_to -> -> mcfork
Execution halted
Error while shutting down parallel: unable to terminate some child processes
I see there has been several reports of this issue (https://support.bioconductor.org/p/p134681/) but it is still present on both the release version (1.46.0) and development version (as of today, April 5th 2023).
I tried running GSVA:::.mapGeneSetsToFeatures using the processed inputs that GSVA::gsva does and the error cited on the Bioconductor support occurs. Now, strangely when I copy the function into my global env or run those lines individually, there is no error. When I copy the entire GSVA method for my inputs (matrix and GeneSetCollection), replace GSVA:::.mapGeneSetsToFeatures with my copied version of the function, and fix the namespacing (adding :: and ::: where required), it works.
Here is the output from sessionInfo():
R version 4.2.3 (2023-03-15)
Platform: x86_64-pc-linux-gnu (64-bit)
Running under: Ubuntu 20.04.4 LTS

Matrix products: default
BLAS/LAPACK: /opt/intel/compilers_and_libraries_2018.2.199/linux/mkl/lib/intel64_lin/libmkl_rt.so

locale:
 [1] LC_CTYPE=en_US.UTF-8       LC_NUMERIC=C               LC_TIME=en_US.UTF-8
 [4] LC_COLLATE=en_US.UTF-8     LC_MONETARY=en_US.UTF-8    LC_MESSAGES=en_US.UTF-8
 [7] LC_PAPER=en_US.UTF-8       LC_NAME=C                  LC_ADDRESS=C
[10] LC_TELEPHONE=C             LC_MEASUREMENT=en_US.UTF-8 LC_IDENTIFICATION=C

attached base packages:
[1] stats4    stats     graphics  grDevices datasets  utils     methods   base

other attached packages:
 [1] GSEABase_1.60.0      graph_1.76.0         annotate_1.76.0      XML_3.99-0.14
 [5] AnnotationDbi_1.60.2 IRanges_2.32.0       S4Vectors_0.36.2     Biobase_2.58.0
 [9] BiocGenerics_0.44.0  GSVA_1.46.0          msigdb_1.6.0         edgeR_3.40.2
[13] limma_3.54.2         purrr_1.0.1          tidyr_1.3.0          ggplot2_3.4.2
[17] stringr_1.5.0        data.table_1.14.8    tictoc_1.1

loaded via a namespace (and not attached):
 [1] bitops_1.0-7                  matrixStats_0.63.0            bit64_4.0.5
 [4] filelock_1.0.2                httr_1.4.5                    GenomeInfoDb_1.34.9
 [7] tools_4.2.3                   utf8_1.2.3                    R6_2.5.1
[10] irlba_2.3.5.1                 HDF5Array_1.26.0              DBI_1.1.3
[13] colorspace_2.1-0              rhdf5filters_1.10.1           withr_2.5.0
[16] tidyselect_1.2.0              bit_4.0.5                     curl_5.0.0
[19] compiler_4.2.3                cli_3.6.1                     DelayedArray_0.24.0
[22] scales_1.2.1                  rappdirs_0.3.3                digest_0.6.31
[25] XVector_0.38.0                htmltools_0.5.5               pkgconfig_2.0.3
[28] sparseMatrixStats_1.10.0      MatrixGenerics_1.10.0         dbplyr_2.3.2
[31] fastmap_1.1.1                 rlang_1.1.0                   RSQLite_2.3.1
[34] shiny_1.7.4                   DelayedMatrixStats_1.20.0     generics_0.1.3
[37] BiocParallel_1.32.6           dplyr_1.1.1                   RCurl_1.98-1.12
[40] magrittr_2.0.3                BiocSingular_1.14.0           GenomeInfoDbData_1.2.9
[43] Matrix_1.5-4                  Rcpp_1.0.10                   munsell_0.5.0
[46] Rhdf5lib_1.20.0               fansi_1.0.4                   lifecycle_1.0.3
[49] stringi_1.7.12                yaml_2.3.7                    SummarizedExperiment_1.28.0
[52] zlibbioc_1.44.0               rhdf5_2.42.0                  BiocFileCache_2.6.1
[55] AnnotationHub_3.6.0           grid_4.2.3                    blob_1.2.4
[58] promises_1.2.0.1              parallel_4.2.3                ExperimentHub_2.6.0
[61] crayon_1.5.2                  lattice_0.20-45               Biostrings_2.66.0
[64] beachmat_2.14.0               KEGGREST_1.38.0               locfit_1.5-9.7
[67] knitr_1.42                    pillar_1.9.0                  GenomicRanges_1.50.2
[70] codetools_0.2-19              ScaledMatrix_1.6.0            glue_1.6.2
[73] BiocVersion_3.16.0            renv_0.17.2                   BiocManager_1.30.20
[76] httpuv_1.6.9                  png_0.1-8                     vctrs_0.6.1
[79] gtable_0.3.3                  cachem_1.0.7                  xfun_0.38
[82] mime_0.12                     rsvd_1.0.5                    xtable_1.8-4
[85] later_1.3.0                   SingleCellExperiment_1.20.1   tibble_3.2.1
[88] memoise_2.0.1                 ellipsis_0.3.2                interactiveDisplayBase_1.36.0
Hi,
I have read the code of gsva, and have a question: how to handle the genes with same expression (or the same order/rank)?
The code (line 706-805) seems to give different ranks to the genes that have same expression:
compute_rank_score <- function(sort_idx_vec){
		tmp <- rep(0, num_genes)
		tmp[sort_idx_vec] <- abs(seq(from=num_genes,to=1) - num_genes/2)
		return (tmp)
}
rank.scores <- rep(0, num_genes)
sort.sgn.idxs <- apply(gene.density, 2, order, decreasing=TRUE) # n.genes * n.samples
rank.scores <- apply(sort.sgn.idxs, 2, compute_rank_score)
Thank you.
Hi @rcastelo,
Trying to use the GSVA package to put univariate drug response expression biomarkers into the pathway context for use in molecular tumour boards. Our use case allows a researcher or clinician to upload the expression profile (logTPM or RMA normalized microarray) of a patient and use the data to query PharmacoDB.ca for a list of biomarkers associated with response to a given drug therapy from in vitro high throughput drug screening studies in cancer cell lines.
We want to allow clinicians to take these univariate biomarkers and put them into a pathway context to see if the gene associated with drug response is in a pathway known to be involved in their patient's cancer or cancer more generally. To this end, we are trying to use the ssGSEA method via GSVA to identify relevant gene sets from a list we compiled via msigdbr.
I have found a bug, in the sense that I can reproducibly cause an error in the package by passing a single column matrix into the GSVA method. However, it is not clear to me from the package vignette or a brief review of Barbie et al. (2009) if the method is actually intended to work with a literal single patient's gene expression profile.
expr <- matrix(rnorm(26), ncol=1, dimnames=list(LETTERS, "sample1"))
gs <- list(set1=c("A", "D", "G"), set2=c("Z", "Y", "X"))
gsea <- gsva(expr, gs, method="ssgsea", min.sz=1, verbose=TRUE)
## Estimating ssGSEA scores for 2 gene sets.
## [1] "Calculating ranks..."
## [1] "Calculating absolute values from ranks..."
## |======================================================================| 100%
## [1] "Normalizing..."
## Error in `rownames<-`(`*tmp*`, value = names(geneSets)) :
##  attempt to set 'rownames' on an object with no dimensions
## In addition: Warning message:
## In .filterFeatures(expr, method) :
##  26 genes with constant expression values throuhgout the samples.
The actual bug is caused because the matrix gets simplified to a vector before trying to assign rownames on line 885 of gsva.R, inside the ssgsea function, and could be fixed by converting es, which is a vector when the bug occurs, into a single column matrix with something like if (n == 1 && !is.matrix(es)) es <- matrix(es, ncol=1, dimnames=list(names(es), colnames(X)).
It is worth noting that the bug doesn't occur when length(geneSets) == 1, since the condition is already converting es back to being a matrix.
I wanted to confirm that the method is able to handle enrichment analysis using only one patient profile before I open a PR with a fix.
If the method does support the single patient case and you would like a PR please let me know. If it does not and/or you have suggestions for an alternative approach it would be appreciated.
We actually already have a "reference" gene expression population that the user uploads to identify genes of interest, so maybe we could add the mean of that population as a reference population.
> sessionInfo()
R version 4.2.0 Patched (2022-04-26 r82266)
Platform: x86_64-pc-linux-gnu (64-bit)
Running under: Ubuntu 22.04 LTS

Matrix products: default
BLAS:   /opt/R/R-latest/lib/R/lib/libRblas.so
LAPACK: /opt/R/R-latest/lib/R/lib/libRlapack.so

locale:
 [1] LC_CTYPE=en_US.UTF-8       LC_NUMERIC=C
 [3] LC_TIME=en_US.UTF-8        LC_COLLATE=en_US.UTF-8
 [5] LC_MONETARY=en_US.UTF-8    LC_MESSAGES=en_US.UTF-8
 [7] LC_PAPER=en_US.UTF-8       LC_NAME=C
 [9] LC_ADDRESS=C               LC_TELEPHONE=C
[11] LC_MEASUREMENT=en_US.UTF-8 LC_IDENTIFICATION=C

attached base packages:
[1] stats     graphics  grDevices utils     datasets  methods   base

other attached packages:
[1] GSVA_1.45.0

loaded via a namespace (and not attached):
 [1] KEGGREST_1.37.0             SummarizedExperiment_1.27.1
 [3] beachmat_2.13.1             BiocSingular_1.13.0
 [5] HDF5Array_1.25.0            rhdf5_2.41.0
 [7] lattice_0.20-45             pak_0.3.0.9000
 [9] vctrs_0.4.1                 stats4_4.2.0
[11] blob_1.2.3                  XML_3.99-0.9
[13] rlang_1.0.2                 glue_1.6.2
[15] DBI_1.1.2                   BiocParallel_1.31.6
[17] SingleCellExperiment_1.19.0 BiocGenerics_0.43.0
[19] bit64_4.0.5                 matrixStats_0.62.0
[21] GenomeInfoDbData_1.2.8      zlibbioc_1.43.0
[23] MatrixGenerics_1.9.0        Biostrings_2.65.0
[25] rsvd_1.0.5                  ScaledMatrix_1.5.0
[27] memoise_2.0.1               Biobase_2.57.1
[29] callr_3.7.0                 IRanges_2.31.0
[31] fastmap_1.1.0               ps_1.7.0
[33] GenomeInfoDb_1.33.3         irlba_2.3.5
[35] parallel_4.2.0              AnnotationDbi_1.59.0
[37] GSEABase_1.59.0             Rcpp_1.0.8.3
[39] xtable_1.8-4                cachem_1.0.6
[41] DelayedArray_0.23.0         S4Vectors_0.35.0
[43] graph_1.75.0                annotate_1.75.0
[45] XVector_0.37.0              bit_4.0.4
[47] png_0.1-7                   processx_3.5.3
[49] GenomicRanges_1.49.0        grid_4.2.0
[51] cli_3.3.0                   tools_4.2.0
[53] bitops_1.0-7                rhdf5filters_1.9.0
[55] RCurl_1.98-1.6              RSQLite_2.2.14
[57] crayon_1.5.1                Matrix_1.4-1
[59] DelayedMatrixStats_1.19.0   sparseMatrixStats_1.9.0
[61] httr_1.4.3                  Rhdf5lib_1.19.2
[63] R6_2.5.1                    compiler_4.2.0
Best,
Christopher Eeles
Software Developer
Haibe-Kains Lab | PM-Research
University Health Network
Dear GSVA developers team
I am a new user of GSVA.
I ran GSVA (Bioconductor version: Release (3.12)) using a set of RNA-seq data from a data base.
Though GSVA scores appears to be normally calculated and stored in an output file, the below messages are returned:
警告メッセージ:
1: .filterFeatures(expr, method) で:
521 genes with constant expression values throuhgout the samples.
2: .filterFeatures(expr, method) で:
Since argument method!="ssgsea", genes with constant expression values are discarded.
(Note: Since R and RStudio has been run on Ubuntu with Japanese language, some of the messages are in Japanese.)
I have a couple of question:
Sincerely,
T Yaoi
hello, I am trying to use GSVA to calculate an enrichment score of the HRD pathway. I am inputting into the gsva function a gene expression count matrix and a list object of genes in the hrd pathway. I am getting results but am having trouble interpreting them. Is there a minimum number or specific combination of gene sets that need to be input into the gsva function?
Hello:
There may be an issue with how ranking is used when computing the KS statistic in formula (3) (I attached the paper and R code downloaded from Bioconductor). The paper says “Conceptually, Eq. 3 produces a distribution over the genes to assess if the genes in the gene set are more likely to be found at either tail of the rank distribution”. The “rank distribution” in question is the distribution of r_i_j values over the gene index “i” for a given sample j. That is, to compute KS, one needs to rank the r_i_j values.
According to the paper, the computation proceeds as follows:
In the attached R code, KS is computed by:
line 503 : ks_test_m <- function(gset_idxs, gene.density, sort.idxs,...)
I ran gsva() to see how it works and got the following results:
a) “gene.density” is actually r_i_j, not z_i_j
b) ks_test_m() is called in line 490 where the 3rd argument is set to sort.sgn.idxs
c) sort.sgn.idxs is computed in line 401 as follows: sorting is applied to the density, so sort.sgn.idxs is actually z_(i)_j, 2).
The problem (please correct me if I'm wrong) is that because of transformation in 3) the ordering of r_i_j is not the same as that of z_i_j. It looks like they assumed that 2) can be reused in 4), but that's not the case.
Besides, there is another (unused?) function for KS in the code:
ks_test_Rcode <- function(gene.density, gset_idxs, tau=1, make.plot=FALSE)
If you look at the body and compare to the formula (3), it's clear that gene.density is again r_i_j, and, most important, the sorting is done as:
sort.idxs <- order(gene.density,decreasing=T)
That is, sorting is done wrt r_i_j, which I believe is the correct way. On the other hand, it looks like ks_test_m() doesn't sort the r_i_j values properly. Please let us know what you think.
Regards,
Nik Tuzov
Create a parameter class and constructor function for the plage method.
Hey! Here are the bug i met:
library('GSVA')
Error: package or namespace load failed for ‘GSVA’ in loadNamespace(i, c(lib.loc, .libPaths()), versionCheck = vI[[i]]):
There is no package named 'GenomeInfoDbData'.
I have installed GSVA successfully through bioconductor and i pick this GenomeInfoDb and GenomeInfoDbData into my library manually, but it still cannot work. And, my R version is 4.2.3.
How to fix this? Thx!
Hi,
I got something wrong when running the function gsva(). Strangely, It seemed that this error occured randomly. Sometimes, the same code ran successfully.
gene_features
str(gene_features)
List of 1
$ : chr [1:50] "CXCL8" "TMEFF1" "MAGEE1" "CXCL1" ...
expr <- as.matrix(st.RNA@assays$Spatial@counts)
      es.matrix=GSVA::gsva(expr,
                     gene_features,
                     kcdf="Poisson",
                     method="ssgsea",
                     abs.ranking=T,
                     parallel.sz=3)
st.RNA is my 10X Visium Seurat data
Setting parallel calculations through a MulticoreParam back-end
with workers=3 and tasks=100.
Estimating ssGSEA scores for 1 gene sets.
[1] "Calculating ranks..."
[1] "Calculating absolute values from ranks..."
  |                                                                                                  |   0%
Error in d$value$value : $ operator is invalid for atomic vectors
sessionInfo(package = "GSVA")
R version 4.2.1 (2022-06-23)
Platform: x86_64-pc-linux-gnu (64-bit)
Running under: Ubuntu 20.04.1 LTS
Matrix products: default
BLAS: /usr/lib/x86_64-linux-gnu/blas/libblas.so.3.9.0
LAPACK: /usr/lib/x86_64-linux-gnu/lapack/liblapack.so.3.9.0
locale:
[1] LC_CTYPE=en_US.UTF-8 LC_NUMERIC=C LC_TIME=en_US.UTF-8
[4] LC_COLLATE=en_US.UTF-8 LC_MONETARY=en_US.UTF-8 LC_MESSAGES=en_US.UTF-8
[7] LC_PAPER=en_US.UTF-8 LC_NAME=C LC_ADDRESS=C
[10] LC_TELEPHONE=C LC_MEASUREMENT=en_US.UTF-8 LC_IDENTIFICATION=C
attached base packages:
character(0)
other attached packages:
[1] GSVA_1.44.2
Thanks for your help!
The neuronal_dn and oligodendrocytic_dn gene sets are identical. Is it a bug?
library(GSVAdata)
data(brainTxDbSets)
identical(brainTxDbSets$oligodendrocytic_dn, brainTxDbSets$neuronal_dn)
[1] TRUE
Dear Sir,
I have a query regarding the input matrix in gsva() method.
Does GSVA accept count data or gene length normalised data?
Hi
if I have three groups in my dataset, shall I apply gsva in each group separately or shall I do it for all samples at once?
when I added some samples to one group, the socer of samples from the same group was changed, does score change with number of samples in each group?
thank you
I have the R package tictoc installed and this leads to an unexpected error in the gsva function. Somehow tictoc overrides the as.list() which leads to this line always producing an empty list. Could you test whether you get the same behavior?
I "solved" it by going back to RELEASE_3_12 which does not include the line causing trouble.
I ran gsva with expr="matrix" and gset.idx.list="list"
Dear ,
I got the following error when I tried to install GSVA from bioconductor, could you please help?
clang: error: unsupported option '-fopenmp'
make: *** [blasctl.o] Error 1
ERROR: compilation failed for package ‘RhpcBLASctl’
Thank you
Hi,
I am trying to calculate GSVA scores from RNA gene expression data from TCGA adult tumors (n = 9000 samples) and a bunch of pediatric tumors from another dataset (OpenPBTA; n = 970 samples). Although, these are two different datasets, we have all the data harmonized using the same pipeline.
When running with the combined dataset of adult + pediatric tumors (~10000 samples and 30,000 genes) I am getting an error:
gsea_scores <- gsva(expr = total.matrix, # log transformed FPKM values
                          gset.idx.list =  geneset,
                          method = "gsva",
                          min.sz = 1, max.sz = 50,
                          mx.diff = TRUE,
                          verbose = FALSE)

vector limit exhausted
I was wondering what is the recommended route here when the sample size is large: should I combine and run all datasets (nearly 11000 samples) together or should I run the TCGA adult tumors separately and OpenPBTA pediatric tumors separately? If the latter is possible, are separately computed GSVA scores comparable?
Thanks,
Komal
ssGSEA method parameter class and constructor
The main function gsva() provides access to four different methods with different sets of parameters which has caused confusion in the past. The new API will offer four S4 classes for the respective methods' parameters and use S4 method dispatch to ensure each method can only be invoked with the appropriate set of parameters. Arguments to gsva() that are not method-specific parameters will not need to be changed.
Hi, I analyzed scRNA-seq data, by "FindMarkers" I got the different gene expression matrix between control and treat group. so this matrix contains gene name in row, 2 samples in column, and the expression data. By "getGmt", I could get specific MSigDB dataset. then the codes are :
          method= c("gsva", "ssgsea", "zscore", "plage"),
          kcdf=c("Gaussian", "Poisson", "none"),
          abs.ranking=F,
          min.sz=1,
          max.sz=Inf,
          parallel.sz=1L,
          mx.diff=T,
          #tau=switch(method, gsva=1, ssgsea=0.25, NA),
          ssgsea.norm=TRUE,
          verbose=T)
But I got Warning message:
Estimating GSVA scores for 3 gene sets.
Estimating ECDFs with Gaussian kernels
|============================================================================| 100%
Warning message:
In .gsva(expr, mapped.gset.idx.list, method, kcdf, rnaseq, abs.ranking, :
Some gene sets have size one. Consider setting 'min.sz > 1'.
And all the scores of each pathway are same.
HALLMARK_COMPLEMENT -0.729128(control group) 0.4434137(treat group)
HALLMARK_XENOBIOTIC_METABOLISM -0.729128(control group) 0.4434137(treat group)
HALLMARK_COAGULATION -0.729128(control group) 0.443413(treat group)
How could I do? Thank you.
Thank you for developing such a useful tool. I ran into an error (no method or default for coercing “matrix” to “dMatrix”) when running the GSVA function. I found that this error only occurs when the version of the GSVA package is greater than 1.44.2. The following code is a minimal example of repeating the error. Looking forward to your reply.
> packageVersion(pkg = "GSVA")
[1] ‘1.44.2’
> library(GSVA)
> library(Seurat)
>
> # load data
> data(pbmc_small)
> pbmc_small <- SeuratObject::UpdateSeuratObject(pbmc_small)
Validating object structure
Updating object slots
Ensuring keys are in the proper strucutre
Ensuring feature names don't have underscores or pipes
Object representation is consistent with the most current Seurat version
> my.matrix <- SeuratObject::GetAssayData(pbmc_small, assay = "RNA", slot = "data")
>
> # custom geneset
> markers <- list()
> markers$Tcell_gd <- c("TRDC+", "TRGC1+", "TRGC2+", "TRDV1+","TRAC-","TRBC1-","TRBC2-")
> markers$Tcell_NK <- c("FGFBP2+", "SPON2+", "KLRF1+", "FCGR3A+", "CD3E-","CD3G-")
> markers$Tcell_CD4 <- c("CD4","CD40LG")
> markers$Tcell_CD8 <- c("CD8A","CD8B")
> markers$Tcell_Treg <- c("FOXP3","IL2RA")
>
> ssgsea.scores <- GSVA::gsva(my.matrix,
+                             gset.idx.list = markers,
+                             method = "ssgsea",
+                             kcdf = "Gaussian",
+                             ssgsea.norm = F,
+                             parallel.sz = 1, verbose = F)
[1] "Calculating ranks..."
[1] "Calculating absolute values from ranks..."
Warning messages:
1: In .local(expr, gset.idx.list, ...) :
  Using 'dgCMatrix' objects as input is still in an experimental stage.
2: In .gsva(expr, mapped.gset.idx.list, method, kcdf, rnaseq, abs.ranking,  :
  Some gene sets have size one. Consider setting 'min.sz > 1'.
> detach("package:GSVA", unload = TRUE)
> BiocManager::install("GSVA", force = T)
> packageVersion(pkg = "GSVA")
[1] ‘1.44.3’
> library(GSVA)
> ssgsea.scores <- GSVA::gsva(my.matrix,
+                             gset.idx.list = markers,
+                             method = "ssgsea",
+                             kcdf = "Gaussian",
+                             ssgsea.norm = F,
+                             parallel.sz = 1, verbose = F)
[1] "Calculating ranks..."
[1] "Calculating absolute values from ranks..."
Error in as(es, "dMatrix") :
  no method or default for coercing “matrix” to “dMatrix”
In addition: Warning messages:
1: In .local(expr, gset.idx.list, ...) :
  Using 'dgCMatrix' objects as input is still in an experimental stage.
2: In .gsva(expr, mapped.gset.idx.list, method, kcdf, rnaseq, abs.ranking,  :
  Some gene sets have size one. Consider setting 'min.sz > 1'.
detach("package:GSVA", unload = TRUE)
devtools::install_github("rcastelo/GSVA", force = T)
> packageVersion(pkg = "GSVA")
[1] ‘1.45.3’
> library(GSVA)
> ssgsea.scores <- GSVA::gsva(my.matrix,
+                             gset.idx.list = markers,
+                             method = "ssgsea",
+                             kcdf = "Gaussian",
+                             ssgsea.norm = F,
+                             parallel.sz = 1, verbose = F)
[1] "Calculating ranks..."
[1] "Calculating absolute values from ranks..."
Error in as(es, "dMatrix") :
  no method or default for coercing “matrix” to “dMatrix”
In addition: Warning messages:
1: In .local(expr, gset.idx.list, ...) :
  Using 'dgCMatrix' objects as input is still in an experimental stage.
2: In .gsva(expr, mapped.gset.idx.list, method, kcdf, rnaseq, abs.ranking,  :
  Some gene sets have size one. Consider setting 'min.sz > 1'.
Hello,
I wanted to ask about the gsva() function. I am using it to calculate ssGSEA scores in TCGA samples. I have 25 genes sets for which I calculate these scores.
In this 25 gene sets I have around 700 unique genes. So my question is: when I calculate the scores - should I subset the expression data (input for expr argument) to include only the genes that I have in my gene sets? Or is it better to keep all the genes that were originally in the expression data?
I think with the subsetting I am able to see clearer differences between my gene sets (when I visualise them on a heatmap), however I am not sure if it is a correct approach and perhaps I should keep all genes in the input matrix instead.
Can I also ask about the mx.diff argument? I know the default is set to TRUE, however I don't really understand the difference between the two methods available. Which one would be more suitable to identify specific cell phenotypes in bulk based on input gene signatures?
I would appreciate any help,
Best wishes
Hi @rcastelo,
Your GSVA was very great contribution. And there are two problems perplexed me . Firstly, how can i run the GSVA package with single cell RNA-seq data and how to build the gmt file with mouse.
Secondly, Why run single cell matrix so slowly, and occured error like, cholmod error 'problem too large' r .
Hope your comment.
Hello,
After I plot density of ssGSEA method result, I am curious what the zero line means. As the documentation says,
GSVA assesses the relative enrichment of gene sets across samples using a non-parametric approach.
If the mean of distribution locate at left of zero, does it mean this gene list of interest relatively un-enrich comparing with other genes in the genome???
Best,
Shixiang
Is there a way in GSVA to obtain the genes that make up the pathways that are identified as differentially expressed? I can go to msigdb and enter the pathway, of course, but it would be nice to pull this up in R code.
Thanks
Barbie et al., 2009 states that "For a given signature G of size NG and single sample S, of the data set of N genes, the genes are replaced by their ranks according the their absolute expression from high to low". However, I noticed that ssgsea function implemented in the GSVA package takes the absolute value of the ranks rather than the input gene expression matrix:
print("Calculating ranks...")

R <- t(sparseMatrixStats::colRanks(X, ties.method = "average"))
mode(R) <- "integer"

print("Calculating absolute values from ranks...")

Ra <- abs(R)^alpha
If I understand correctly, the algorithm described in Barbie et al. allows the use of bidirectional gene sets that consist of a mix of genes whose up or down regulation both indicate increased pathway activity. The implementation in GSVA then only allows unidirectional gene sets. I can get around this by passing to GSVA the absolute value of my relative expression matrix:
abs(scale(x = gene_expression_matrix, center = TRUE, scale = TRUE))
although it would be nice if this feature was explicitly implemented.
Thank you for implementing and maintaining this useful and versatile package!
Consistently getting the error running GSVA using FPKM matrix (53238 x 11353) and gene set list (244 signatures):
gsva(FPKM, geneSet, method = "gsva", kcdf = "Gaussian", mx.diff = FALSE, parallel.sz=10)
GSVA_1.36.3
R version 4.0.3 (2020-10-10)
Platform: x86_64-conda-linux-gnu (64-bit)
Running under: Ubuntu 18.04.5 LTS
Fixing --as-cran notes on the C code.
Hi.
On my way to run the gsva() I created the gene set collection with the following command from piano package
GSC.C2.msigdb <- loadGSC(file="geneSets/c2.all.v6.1.symbols.gmt", type="gmt")
After that, I provided it with an expression matrix into the gsva() in the following way gsva_res <- gsva( data, GSC.C2.msigdb$gsc[1:186], mx.diff=FALSE, verbose=TRUE)
So while initially, I provided it with 186 gene-sets, the result matrix had dim(gsva_res) 6 72. Where 72 were my samples and 6, the gene-sets.
class(GSC.C2.msigdb$gsc) returns "list"
Hello!
Thanks for your work in GSVA r package. I have a question about this package. That is, how to get the pathways with gene name enriched such as we do in clusterProfiler? The format can be like this:

Looking forward to your reply!
Clover
Dear GSVA team,
Thank you for a very useful tool.
I have a question regarding the p-values of the enrichment significance. I understand that is is not implemented in the GSVA algorithm, but how about permutation-based p-values for ssGSEA? Could you let me know how to find them in output if they are implemented into the tool?
Best regards,
Andrey
A declarative, efficient, and flexible JavaScript library for building user interfaces.
🖖 Vue.js is a progressive, incrementally-adoptable JavaScript framework for building UI on the web.
TypeScript is a superset of JavaScript that compiles to clean JavaScript output.
An Open Source Machine Learning Framework for Everyone
The Web framework for perfectionists with deadlines.
A PHP framework for web artisans
Bring data to life with SVG, Canvas and HTML. 📊📈🎉
JavaScript (JS) is a lightweight interpreted programming language with first-class functions.
Some thing interesting about web. New door for the world.
A server is a program made to process requests and deliver data to clients.
Machine learning is a way of modeling and interpreting data that allows a piece of software to respond intelligently.
Some thing interesting about visualization, use data art
Some thing interesting about game, make everyone happy.
We are working to build community through open source technology. NB: members must have two-factor auth.
Open source projects and samples from Microsoft.
Google ❤️ Open Source for everyone.
Alibaba Open Source for everyone
Data-Driven Documents codes.
China tencent open source team.